Global average surface temperature was 1.2°C higher than the pre-industrial average in 2021 (Hansen, BBC). The international community set 1.5°C as its preferred limit to global warming. Previous estimates expected to pass this threshold beyond 2030 (NYT), but more recent ones suggest it may be breached this decade (BBC/UK Met).
To resolve, I will check Berkeley Earth's press releases each January reporting the global mean temperature (for example, here are Berkeley's releases for 2022 and 2021). If they report greater than 1.5 warming in the previous calendar year, then this question resolves to that year.
In which year will global average surface temperature exceed 1.5°C for the first time this decade, or will it not happen this decade?
 1,000
1,000🏅 Top traders
| # | Name | Total profit |
|---|---|---|
| 1 | Ṁ1,024 | |
| 2 | Ṁ244 | |
| 3 | Ṁ54 | |
| 4 | Ṁ27 | |
| 5 | Ṁ0 |
People are also trading
https://berkeleyearth.org/global-temperature-report-for-2023/
The global annual average for 2023 in our dataset was estimated as 1.54 ± 0.06 °C (2.77 ± 0.11 °F) above the average during the period 1850 to 1900, which is traditionally used a reference for the preindustrial period. This is the first time that any year has exceeded the key 1.5 °C (2.7 °F) threshold.
@StevenK and https://berkeleyearth.org/press-release-2023-was-the-warmest-year-on-recordpress-release/
2023 is also the first year in the Berkeley Earth dataset to breach the 1.5°C warming threshold.
resolves to 2023
@StevenK Using the Normal distribution, T=1.54±0.06 means P(T>1.50) = 0.75. Shouldn't the market resolve to 75%?
From Berkeley's own predictions from August:
https://berkeleyearth.org/august-2023-temperature-update/
"
The surprising recent warmth and the potential for a strong El Niño, has continued to raise our estimates for the final 2023 annual average. We now consider there to be a 55% chance that 2023 has an annual-average temperature anomaly more than 1.5 °C/2.7 °F above the 1850-1900 average. This is a sharp increase from last month’s report, when only a 20% chance of a 1.5 °C anomaly was forecast. Prior to the start of 2023, the likelihood of a 1.5 °C annual average this year was estimated at <1%. The fact that this forecast has shifted so greatly serves to underscore the extraordinarily progression of the last few months, whose warmth has far exceeded expectations.
"
https://mailchi.mp/caa/global-warming-is-accelerating-why-will-we-fly-blind
"However, global temperature in the first few months of the El Nino is so extreme (Fig. 1) it is now almost certain that the 12-month running mean temperature will exceed 1.5°C by May 2024 or earlier."
@cash I think you should clarify what sources and how long it needs to be above 1.5C (temporarily?: for any month, or 12 months running average, or for a whole calendar year, etc). The Paris agreement 1.5C number is more about being above 1.5C for several years...
In a (similar?) market the creator found a source that say we already passed it during the summer:
@parhizj Monthly temperatures were already >1.5 degrees above baseline in e.g. February 2016. For annual temperatures, it will depend on the dataset, because different datasets have different estimates of preindustrial temperatures; 2023 is fairly likely to be >1.5 according to Berkeley Earth data, unlikely according to NOAA/NASA data. See https://www.theclimatebrink.com/p/will-2023-be-the-first-year-above for details.

@parhizj @StevenK Thanks all for the questions and links. Yes, I did not intend this question to resolve on the basis of a 12-month running mean between two separate calendar years. The focus of this question on "which year" was meant to mean the calendar year's temperature exceeded 1.5 C relative to pre-industrial average.
I am persuaded that clarity on a data source is necessary to resolve this question. I'm inclined towards using the least conservative (but still credible) data source that I can most easily verify, e.g. Berkeley. If the spirit of the question is "does this major-historic climate threshold get breached" and any credible data source saying yes seems like a big deal. I'm also inclined to specifically use Berkeley because puts out very clear press releases after each year reporting the average temperature anomaly (e.g. here's one for 2022, 2021).
Let me know if anyone suggests I proceed in another manner. Otherwise I'll update the description tomorrow using the above suggested resolution method.
Previous estimates expected to pass this threshold beyond 2030 (NYT), but more recent ones suggest it may be breached this decade (BBC/UK Met).
I think the former is referring to when the smoothed temperature graph passes 1.5 and the latter are referring to when the temperature exceeds 1.5 for a single year, so they don't necessarily disagree. It's also going to depend on finicky details about which temperature data set you choose.
Why do the graphs on Wikipedia seem to think we've already passed it?
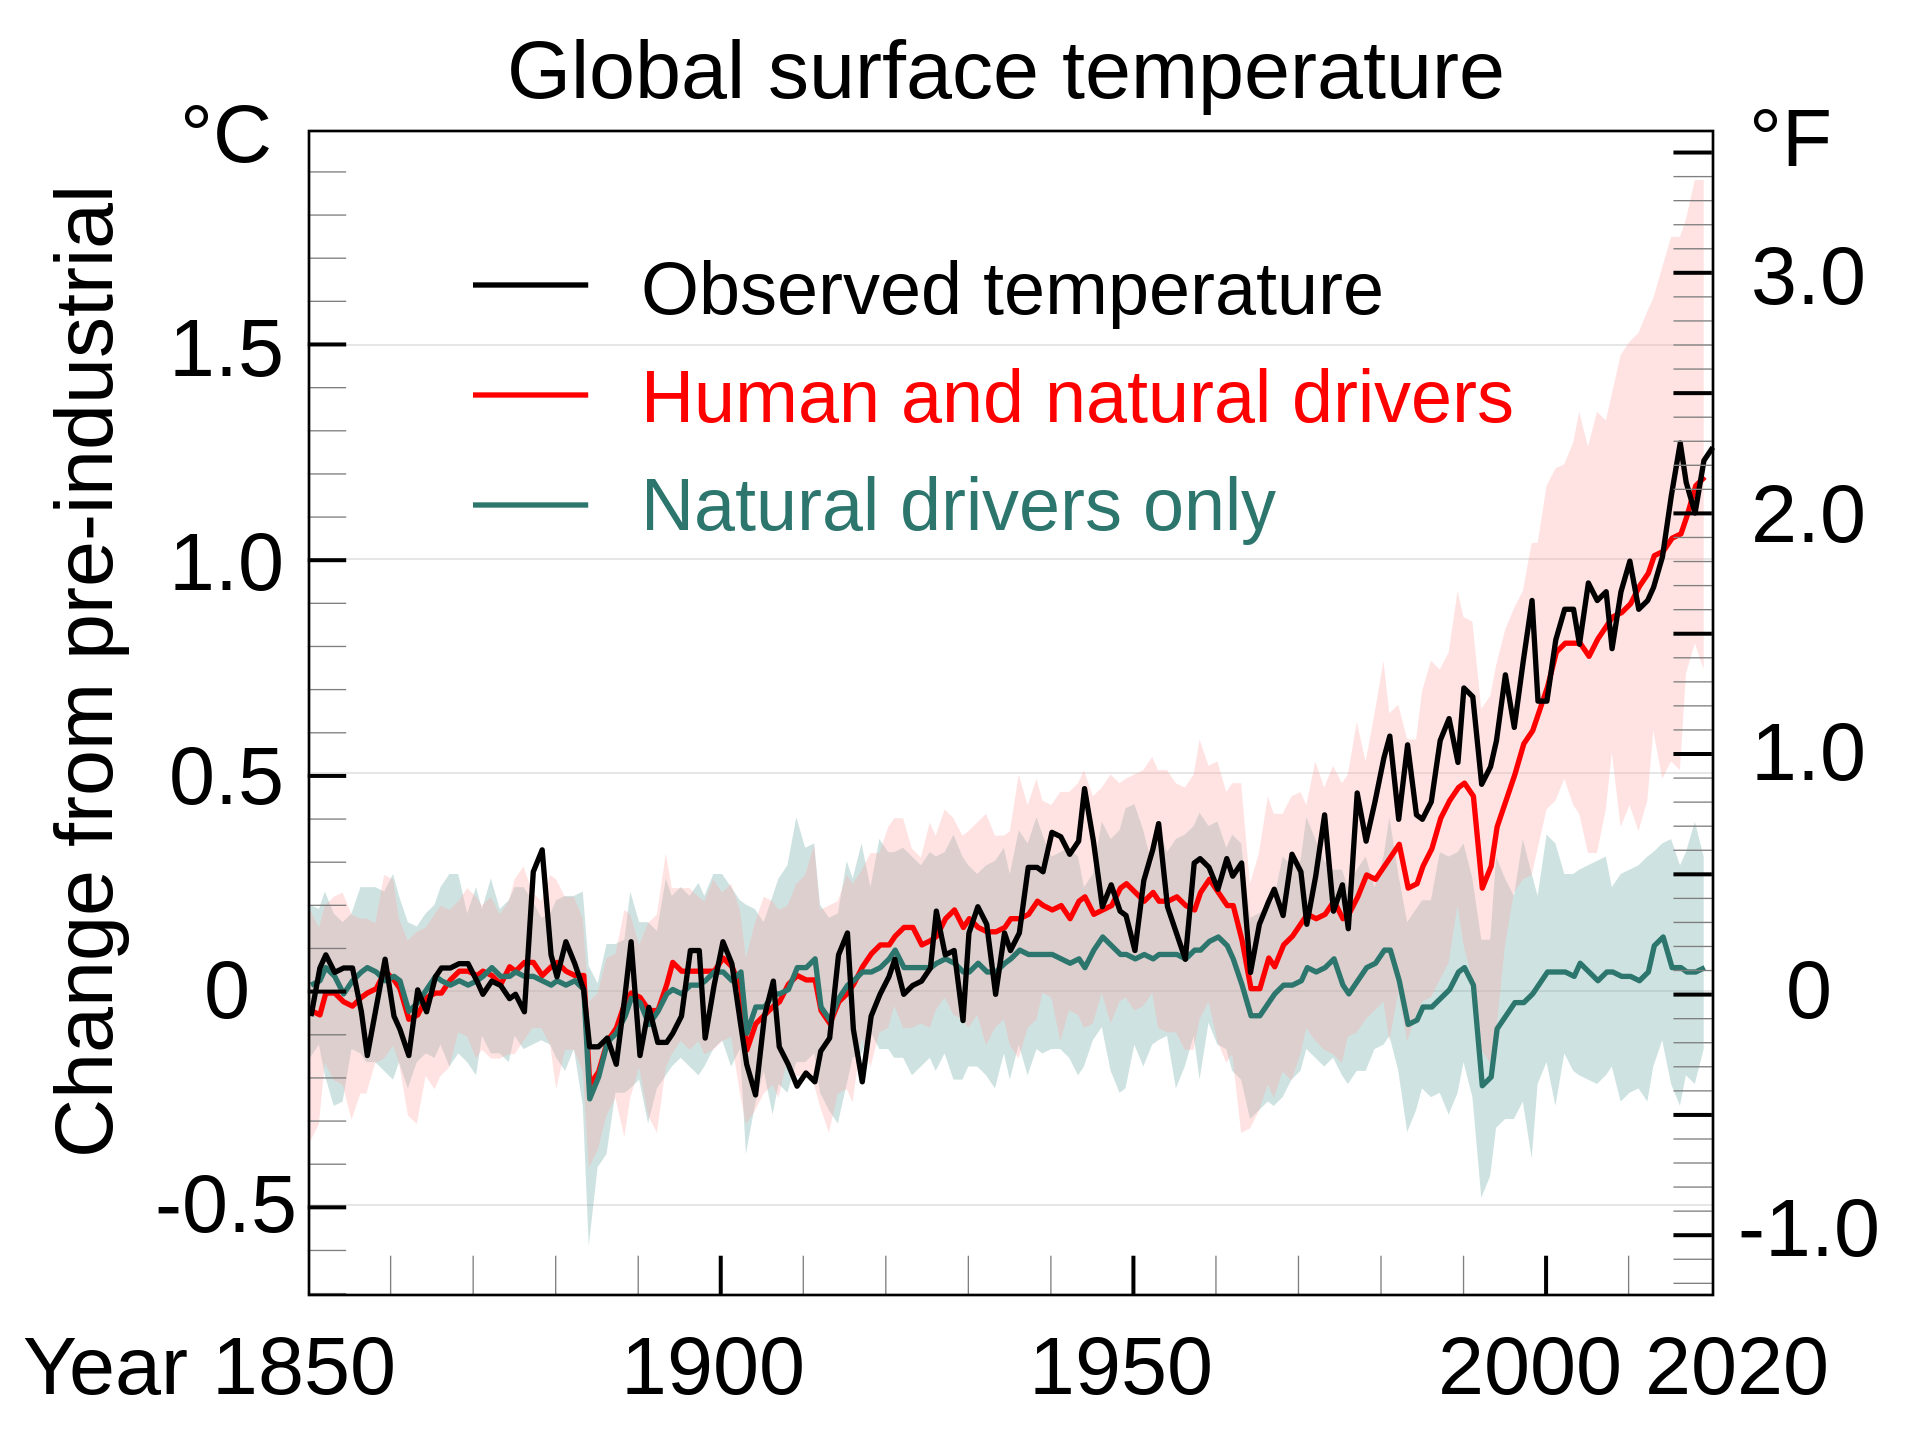
(The page itself says we're still at 1.2°C.)