
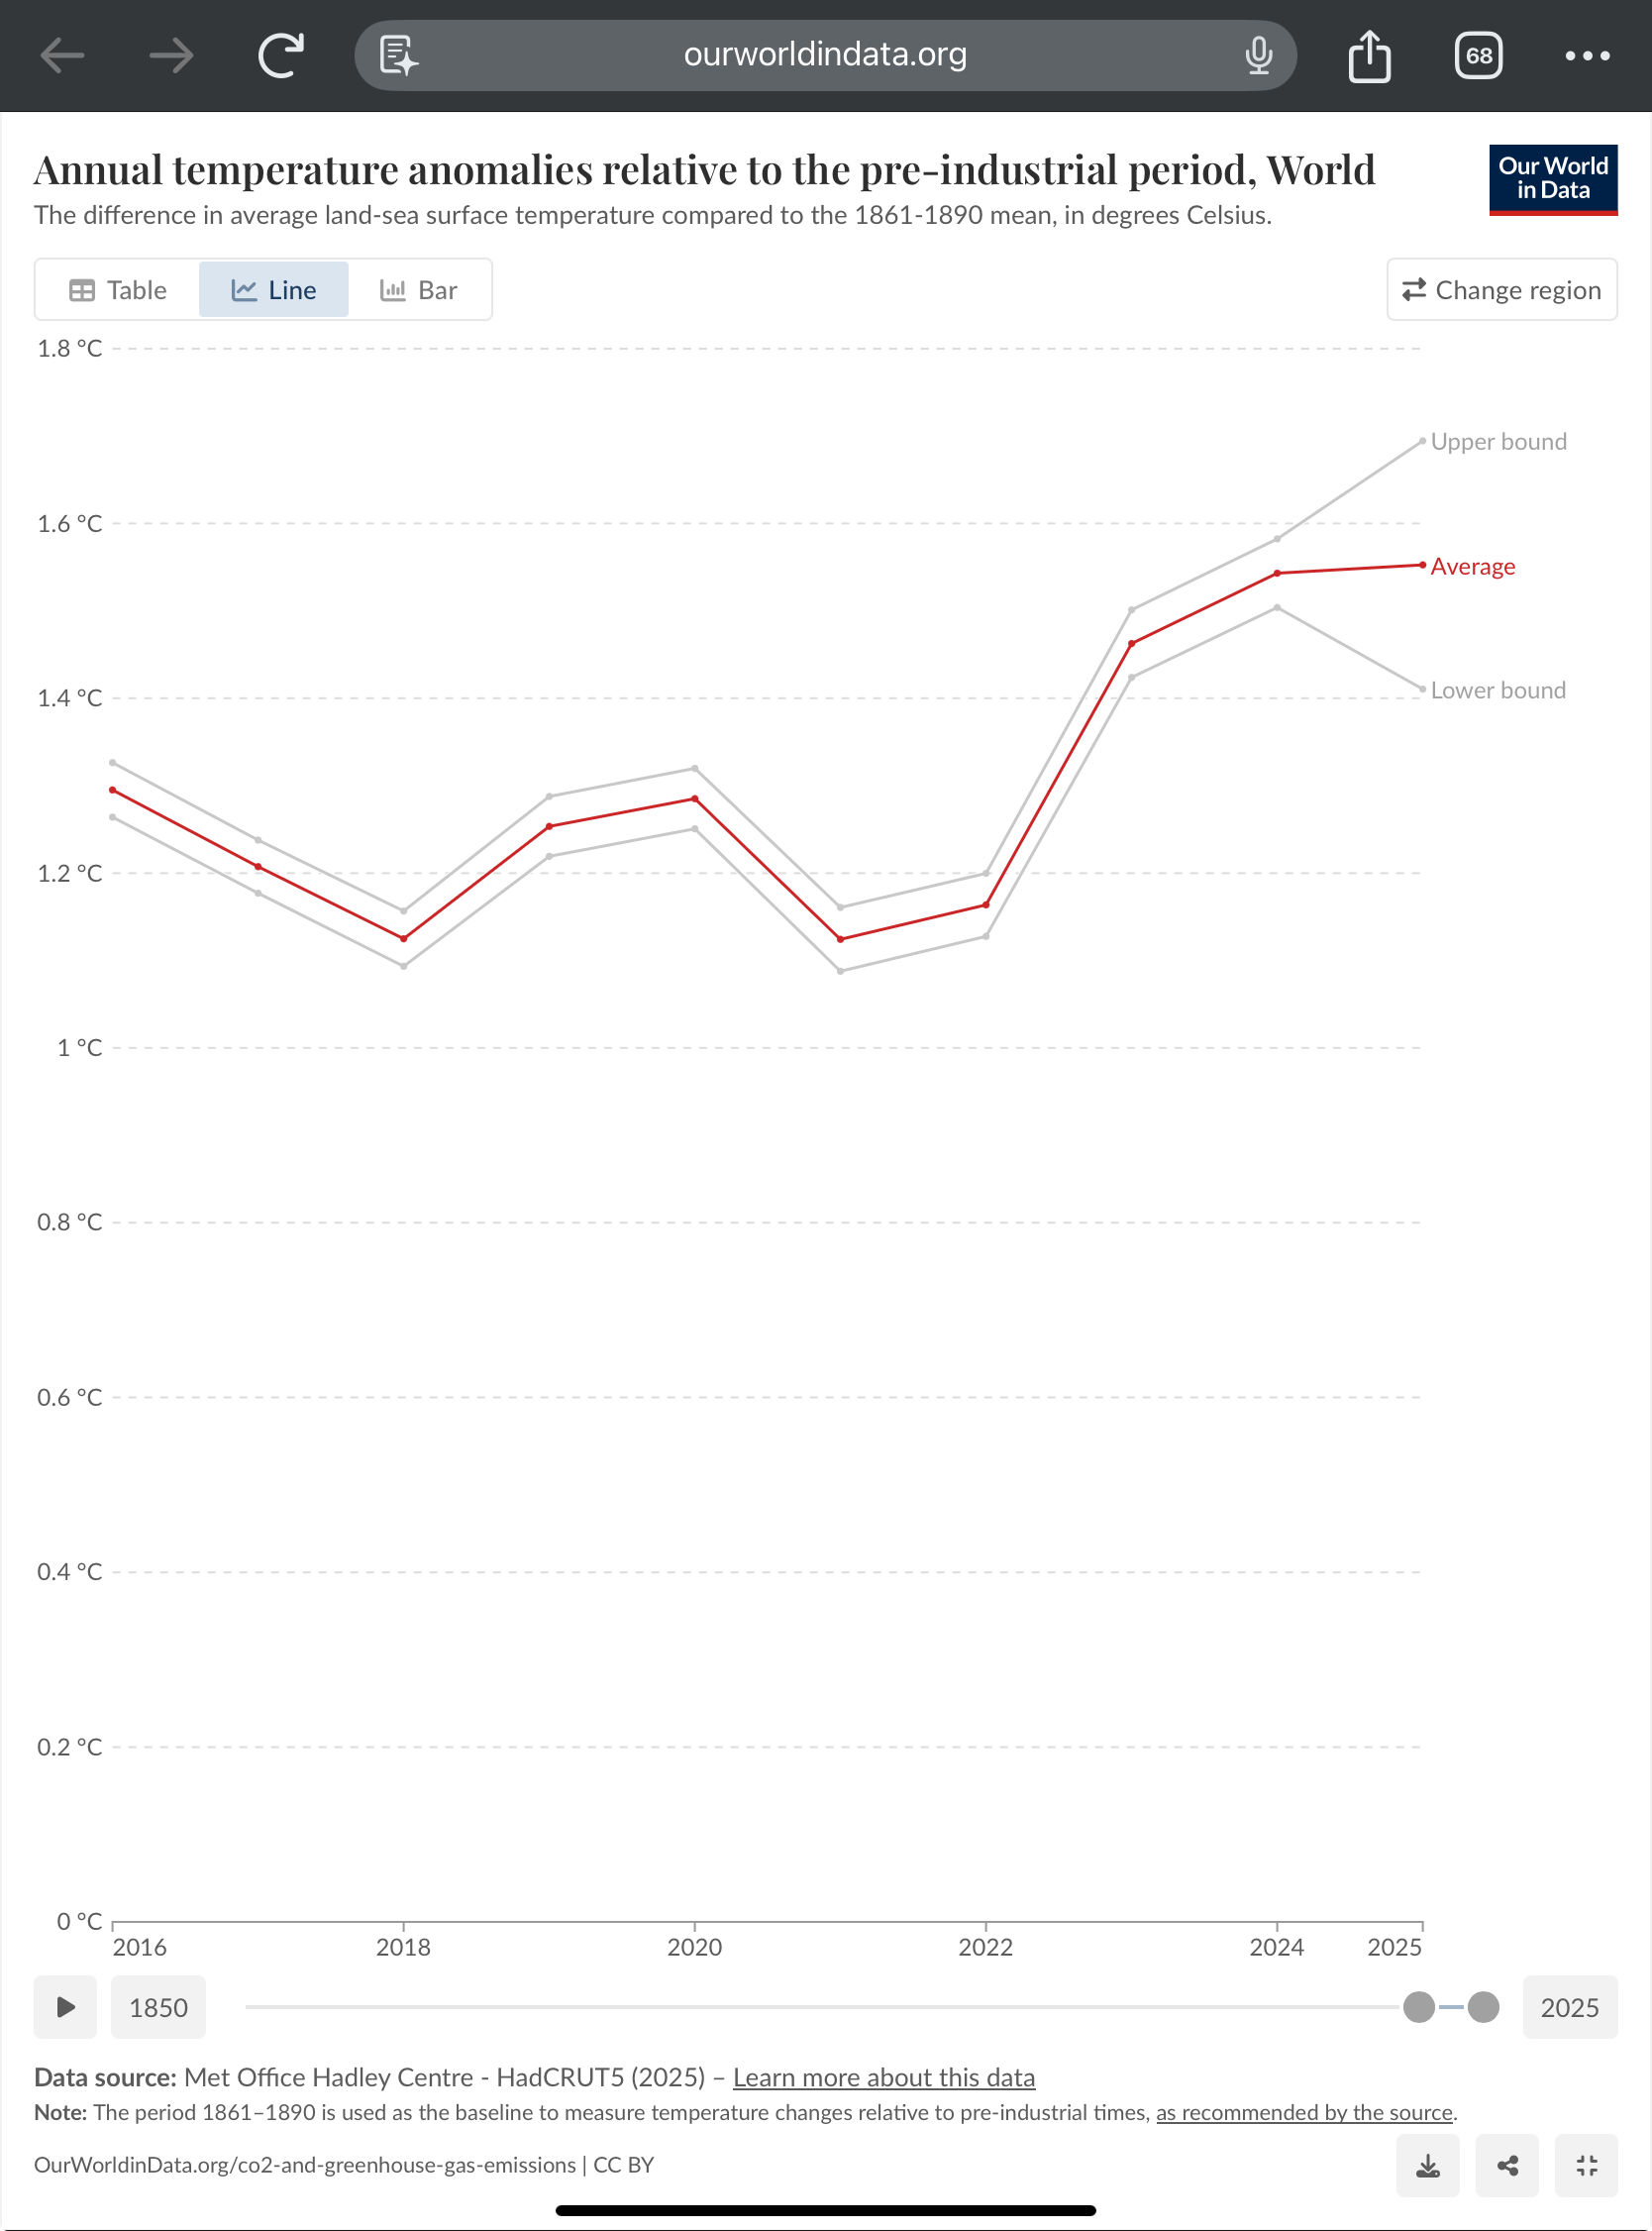
Resolve according to the "mean" average temperature reported in this webpage
https://ourworldindata.org/grapher/temperature-anomaly
resolves to 50% in terms of a tie.
 1,000
1,000🏅 Top traders
| # | Trader | Total profit |
|---|---|---|
| 1 | Ṁ2,203 | |
| 2 | Ṁ538 | |
| 3 | Ṁ414 | |
| 4 | Ṁ193 | |
| 5 | Ṁ192 |
People are also trading
@ChristopherRandles I would prefer if this just gets resolved NO at this point tbh, or I’d feel extra bad if you snipe the NO shares when this reopens after I bought in after you.
Our world in data resolution source has updated 2025 1.55 2023 1.46 so resolves yes.
A bit of a surprise given
https://climate.metoffice.cloud/formatted_data/gmt_HadCRUT5.csv
shows
2022,1.15
2023,1.46
2024,1.51
2025,1.40
@ChristopherRandles This makes no sense. its not even close ....
@StevenK IIRC the same 1.55 data point has been there in the graph for several months. I think OWID just hasn't updated yet.
@StevenK Ok I think I know what's going on, and its more serious than that. The data on our data for >2024 is just garbage since it relies on an incomplete dataset, namely that from an older version that only goes up to FEBRUARY 2025.
this is an older version of the dataset, that erroneously includes 2025 when it is an incomplete year... i.e. if you look at the monthly version for the last update ...
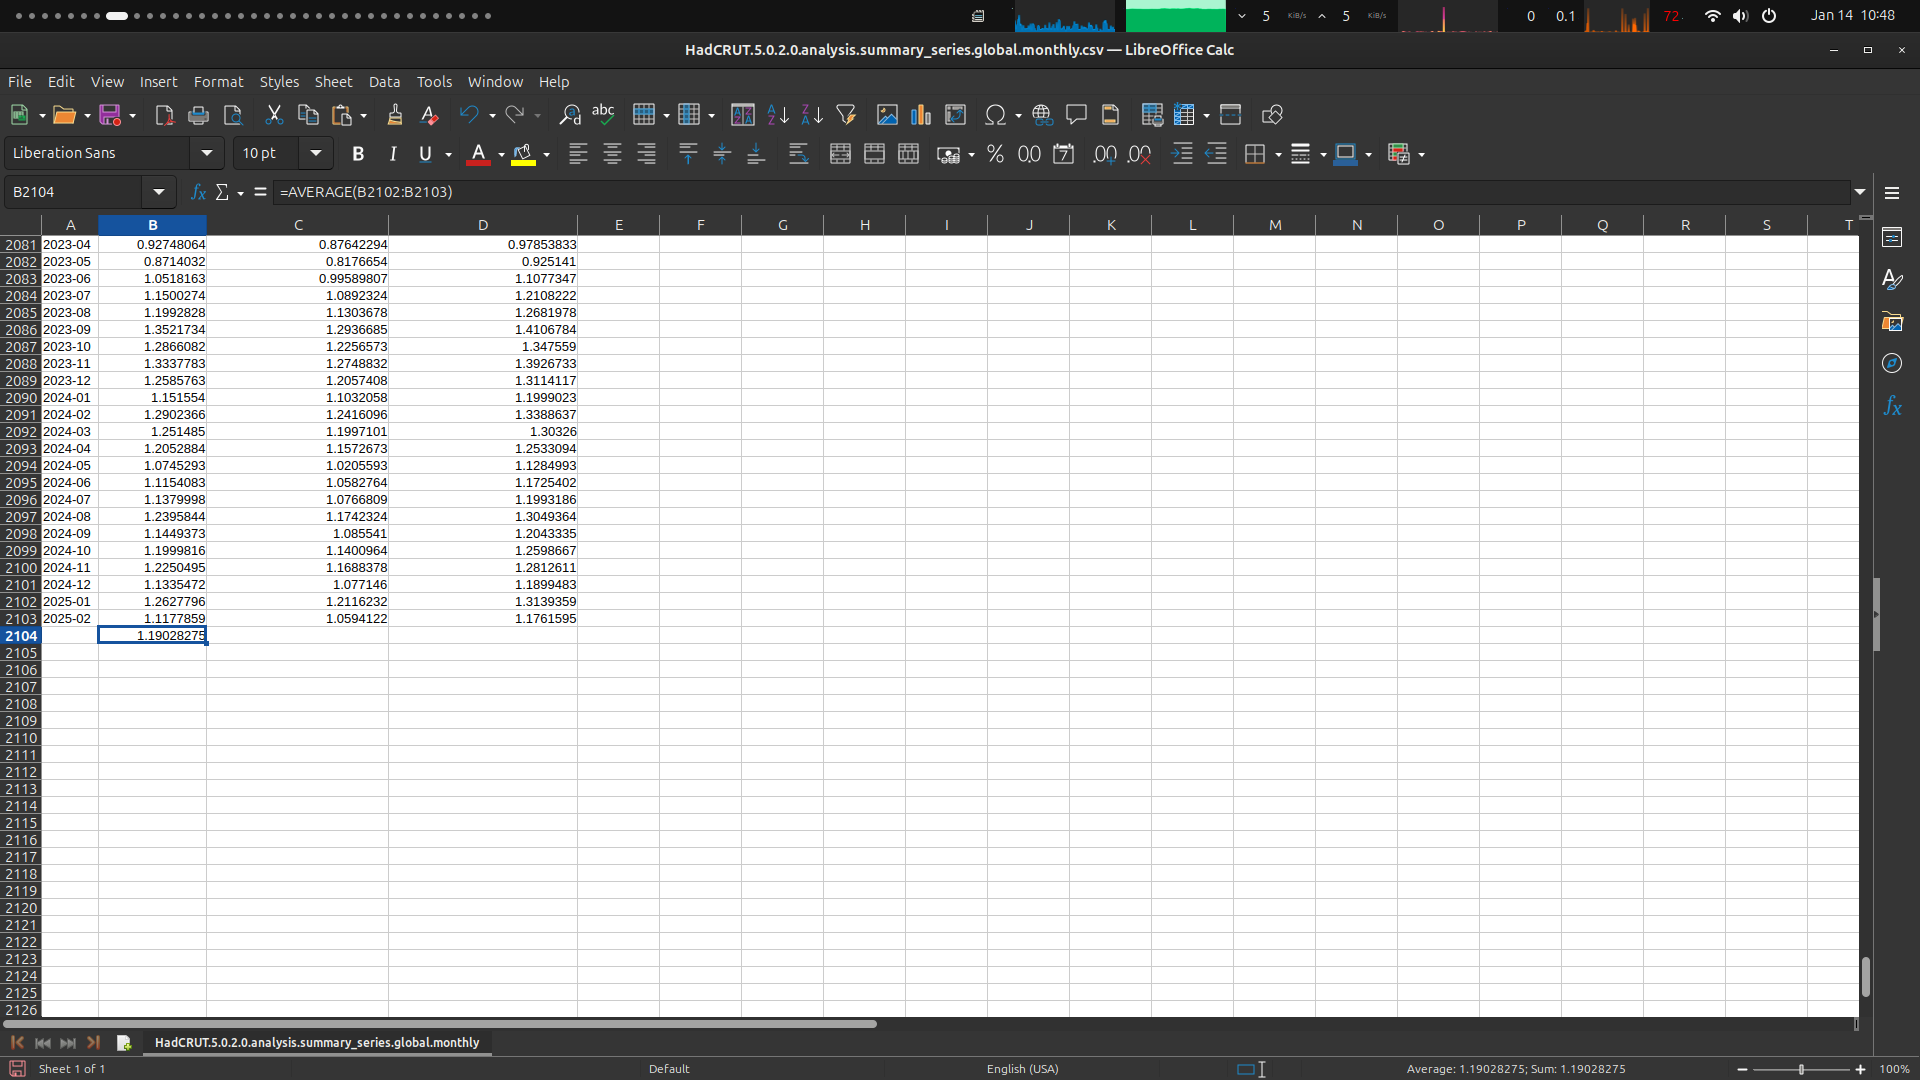
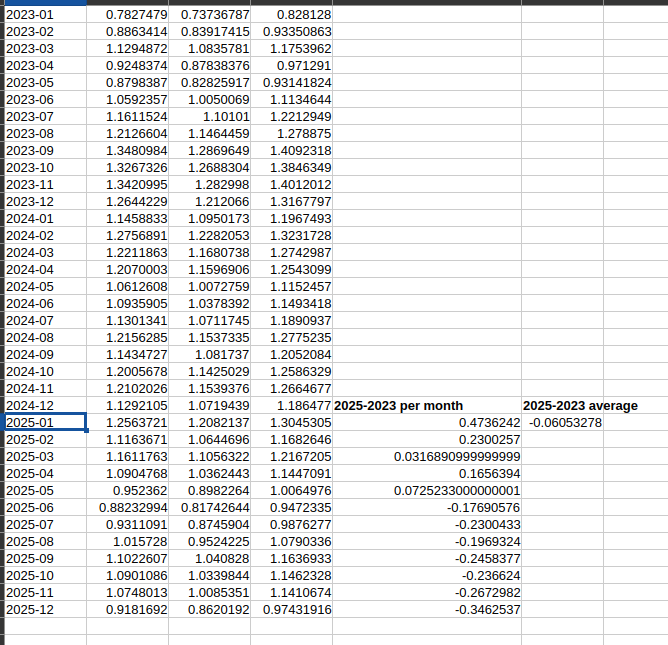
You see where it gets the 1.19 C for 2025 (which is just Mean of Jan and Feb) ( this is 1.54 after changing base line).
~
In conclusion, @AmmonLam I think this needs to be re-resolved either as N/A, or ideally wait until they fix it and it will re-resolve NO. As the resolution criteria doesn't satisfy the question title itself since the data is erroneous at the moment.
@parhizj They should be given at least until the original question close date to fix it, which I think was the end of the month.
@parhizj
Our world in data actually says
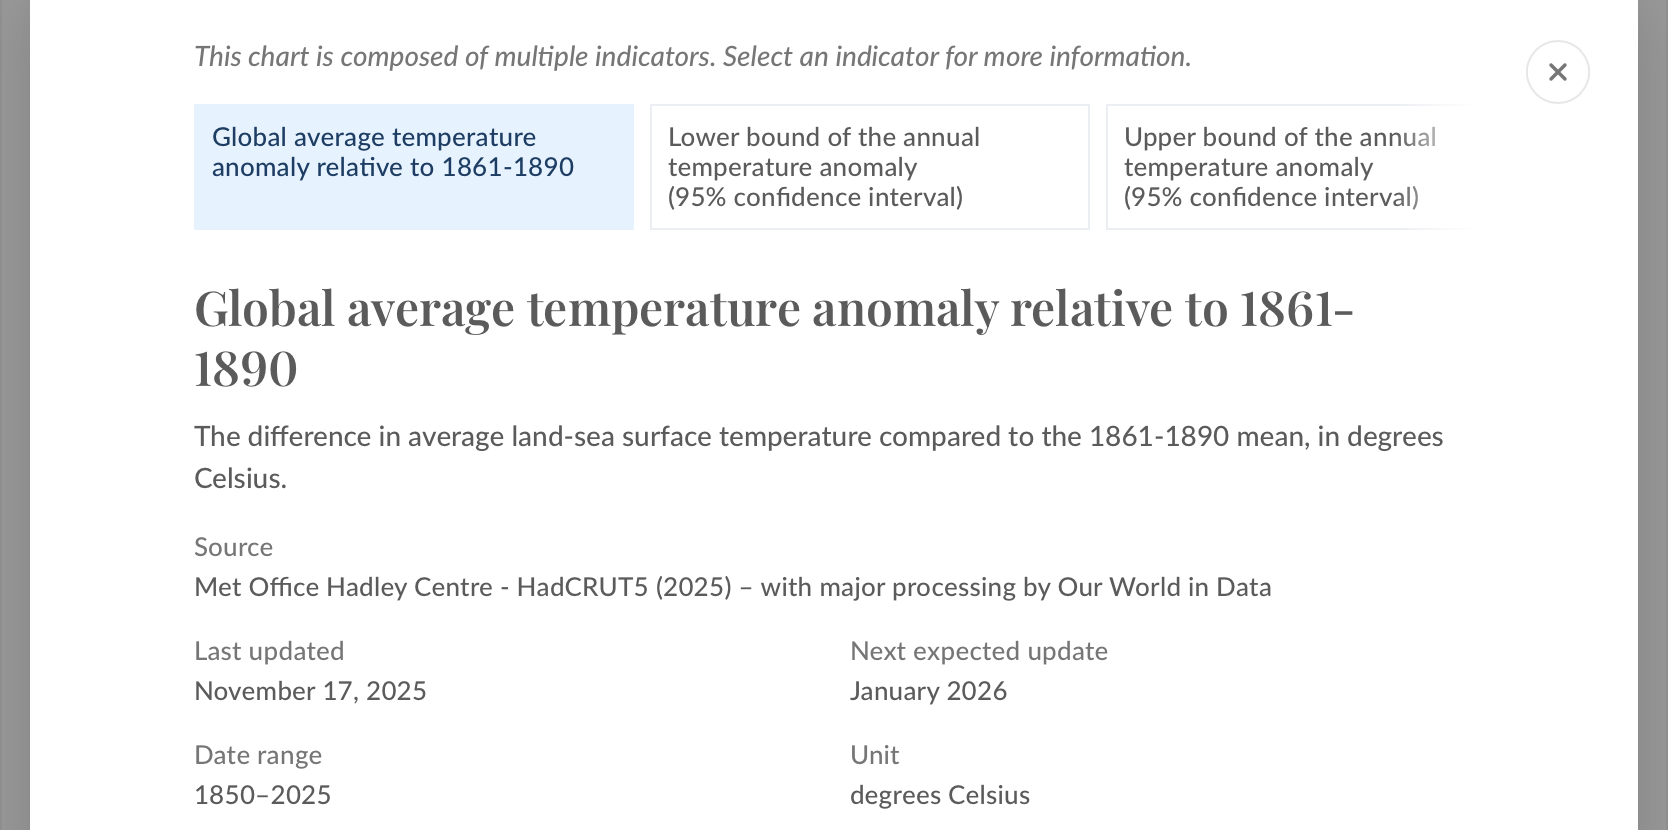
"Full citation
Met Office Hadley Centre - HadCRUT5 (2025) – with major processing by Our World in Data. “Global average temperature anomaly relative to 1861-1890” [dataset]. Met Office Hadley Centre, “HadCRUT5 HadCRUT.5.0.2.0” [original data]."So it does look like it is using that old dataset that ends Feb 2025. If they don't change that by the end of the month and the question says to use Our world in data which was clear about using HadCRUT5 HadCRUT.5.0.2.0 then should it resolve like that?
Ah, I was under the impression that it updated and bought in as resolution criteria was met. I’d prefer if we N/A it, or if we wait for site to officially update to resolve, at least don’t open the market for trading again because it just becomes a race to react and it’d be betting if the site corrects it. But if we just purely go by how there’s contradicting resolution sources I’d prefer if it’s just NA.
@Mochi Note that there's another market that depends on the same data: https://manifold.markets/AmmonLam/will-the-average-global-temperature-8ec95601c0fd
I put in a pull request to OWID's github to get them to update their chart, but IMO, I see no reason to wait for them to do so:
@AmmonLam , given that OWID only does some simple rebasing on HADCRUT5 (https://github.com/owid/etl/blob/c72e01e09a30a8e5736bec4edf9c27d291512b4d/etl/steps/data/garden/climate/2025-11-17/near_surface_temperature.py) (which is as you would expect), given the spirit of the market I think its probably safe to resolve this as NO, IMO.(https://www.metoffice.gov.uk/about-us/news-and-media/media-centre/weather-and-climate-news/2026/2025-continues-series-of-worlds-three-warmest-years if you wanted an authoritative news source that uses HADCRUT5, in addition to the actual data I mention above).

@parhizj Thank you for the detective work and fix.
In case it helps, here's a (hopefully unbiased, despite me having a stake) summary of the info that might be relevant to how to resolve this market and the other one linked above. Please let me know if I got anything wrong.
The question titles are about whether 2025 temperature was higher than 2023/2024 temperature.
Most sources seem to agree 2023 temperature was slightly higher than 2025 temperature, though NASA has 2025 slightly higher. All sources seem to agree 2025 temperature was lower than 2024 temperature.
The question descriptions specify a particular OWID graph as determining the resolution. (The descriptions refer to 'the "mean" average temperature reported' on that page. Strictly speaking, the numbers we're all looking at are labeled "average" and not "mean", but I don't think there was any confusion there.)
OWID set that graph up to show data from HadCRUT.5.0.2.0, and said so in the graph caption, presumably believing that data file would contain an annual temperature at the end of the year.
However, that data file was updated with an average for only Jan+Feb in early or mid 2025, and as a result, the graph has been showing a part-year number since then. The data file was never updated with an annual average for 2025.
The current HadCRUT data, HadCRUT.5.1.0.0, does have an annual average for 2025. It's below 2023 and 2024. This is (in my opinion) the data OWID meant to display, and (in my expectation) what they will display now that JRP submitted the fix.
As of today, OWID's graph was still showing the high Jan+Feb number from the old dataset. This caused some traders on this market to believe the graph had been updated. They believed the state of the graph justified a YES resolution, and they bet on YES, and the market was resolved to YES. This was before the market closing date, which was probably end of January based on the other market, but the market description didn't explicitly say when the graph would be consulted. As far as I know, nobody on the other (2024) market traded based on the same confusion.
@StevenK good summary, thanks for the effort! I did not notice the webpage itself having the version data (you have to click to see the meta data) until you said so, but it was noted by @ChristopherRandles … the chart has not been updated since November anyway (last updated in image).. so the resolution was premature (the “updates” after February have all been erroneous though as I mentioned earlier and as others noticed)
there were other somewhat glaring signs such as the confidence interval being wider for 2025 since the data is missing for most of it… but it’s hard to tell without careful attention
~
A couple minor clarifications to your above comment regarding NASA data:
(1) while the NASA (gistemp LOTI) data is slightly higher (roughly 0.01C) it is within the margin of error (“effectively tied”) per https://www.nasa.gov/news-release/nasa-releases-global-temperature-data/
(2) minor detail: the NASA data although fairly robust in terms of coverage (from what I would subjectively say) and is still considered “official”, it relies on ghcnm for its land data, which in turn has been affected by the ongoing NCEI upgrade so it has slightly? less stations for its data than say 2024 or 2023 (I have a program that looks at a different baseline, and excluding stations without enough records in the baseline, for the December 2025 I think it would be around 70-80% of stations compared to 2024 if I recall). The numbers are always revised in the future releases anyway but there is a decent chance I believe 2025 could drop further in the future given a comparable quantity of data once the upgrade is complete. This may seem beside the point, but I’m just saying the quality of the numbers is different, and this is important if you are comparing nearby years (2025 vs 2023,2024) while discounting the margin of error.
Edit: It's fairly close, but using GISTEMP and my best estimates at the moment for the remainder of December using medium range ensembles, 2025 looks slightly higher (with GISTEMP being merely 0.01 C higher).
Ok I actually worked on the hadcrut data today and using an ERA5 mapping (using the same super ensemble for rest of December debiased, similar to how I handle gistemp) I find that 2025-2023 ~= -0.06 C. Examining the residuals for the linear model used for the mapping, this is far too large to be accounted for by the difference in datasets. As I have fairly high confidence in December's value, the only thing that could cause this to resolve yes is an error in my calculations, or a substantial revision in the 2025/2023 data in next month's release.
Edit:
for future reference:
2025 (1861-1890) = 1.4062228962435286
2023 (1861-1890) = 1.4655657883722222
2025 - 2023 = -0.05934289212869359
@MachiNi yeah =\, obviously, I regret my lazy bet yesterday! Using another dataset as a proxy for these questions was far too sketchy...
@parhizj I just bet against based on
https://climate.metoffice.cloud/formatted_data/gmt_HadCRUT5.csv
2023,1.46
2024,1.51
2025,1.40
which I assumed was up to October for 2025 and Nov and Dec looked cooler. However, given you are pretty close to these figures perhaps it includes estimates for Nov and Dec?
@ChristopherRandles Since the chart says it uses hadcrut data I refer to
(from https://www.metoffice.gov.uk/hadobs/hadcrut5/data/HadCRUT.5.1.0.0/download.html) which includes up to november.
I fill in December 2025 using a method similar to what I use for GISTEMP from, the ERA5 data extended using the super ensemble after some adjustments for mean error, and then per month linear debiasing to map between the datasets. This yields a value of ~ 0.9215 C for December 2025 for the hadcrut5 dataset in their 1961-1990 baseline.