This market will be open for exactly one week, from 7:30 PT on Sunday, March 26 to 7:30 PT on Sunday, April 2. When it closes, I will calculate the average percentage that this market was at over the time period. I will use displayed percentages, which are typically rounded to the nearest integer. [Clarification: When the percentage is below 2 or above 98, it is rounded to the nearest tenth instead.]
Resolves YES if this average is greater than 50%, resolves NO if it's less than or equal to 50%. I may eyeball it if it's obvious who won, but I'll sift through timestamps or whatever's necessary in order to be sure I'm resolving correctly.
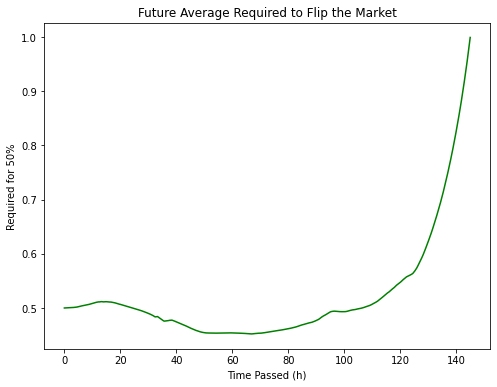
For most self-resolving markets, all that matters is the very end, so there's an incentive to act at the last moment, especially if it's close. For this one, every minute you're winning counts!
General policy for my markets: In the rare event of a conflict between my resolution criteria and the agreed-upon common-sense spirit of the market, I may resolve it according to the market's spirit or N/A, probably after discussion.
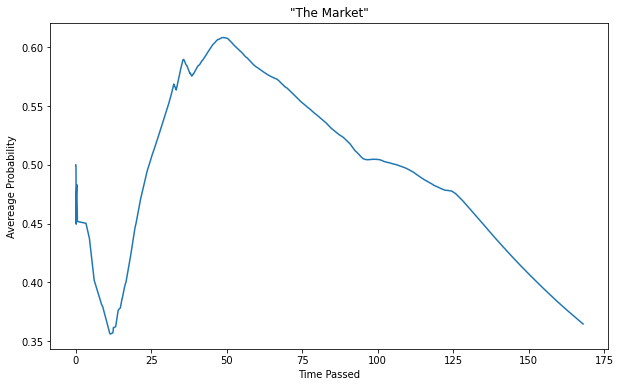
Mar 29, 7:40pm: Will the average percentage of this market be above 50%? → Will the average percentage of this market be above 50%? ("The Market")
 1,000
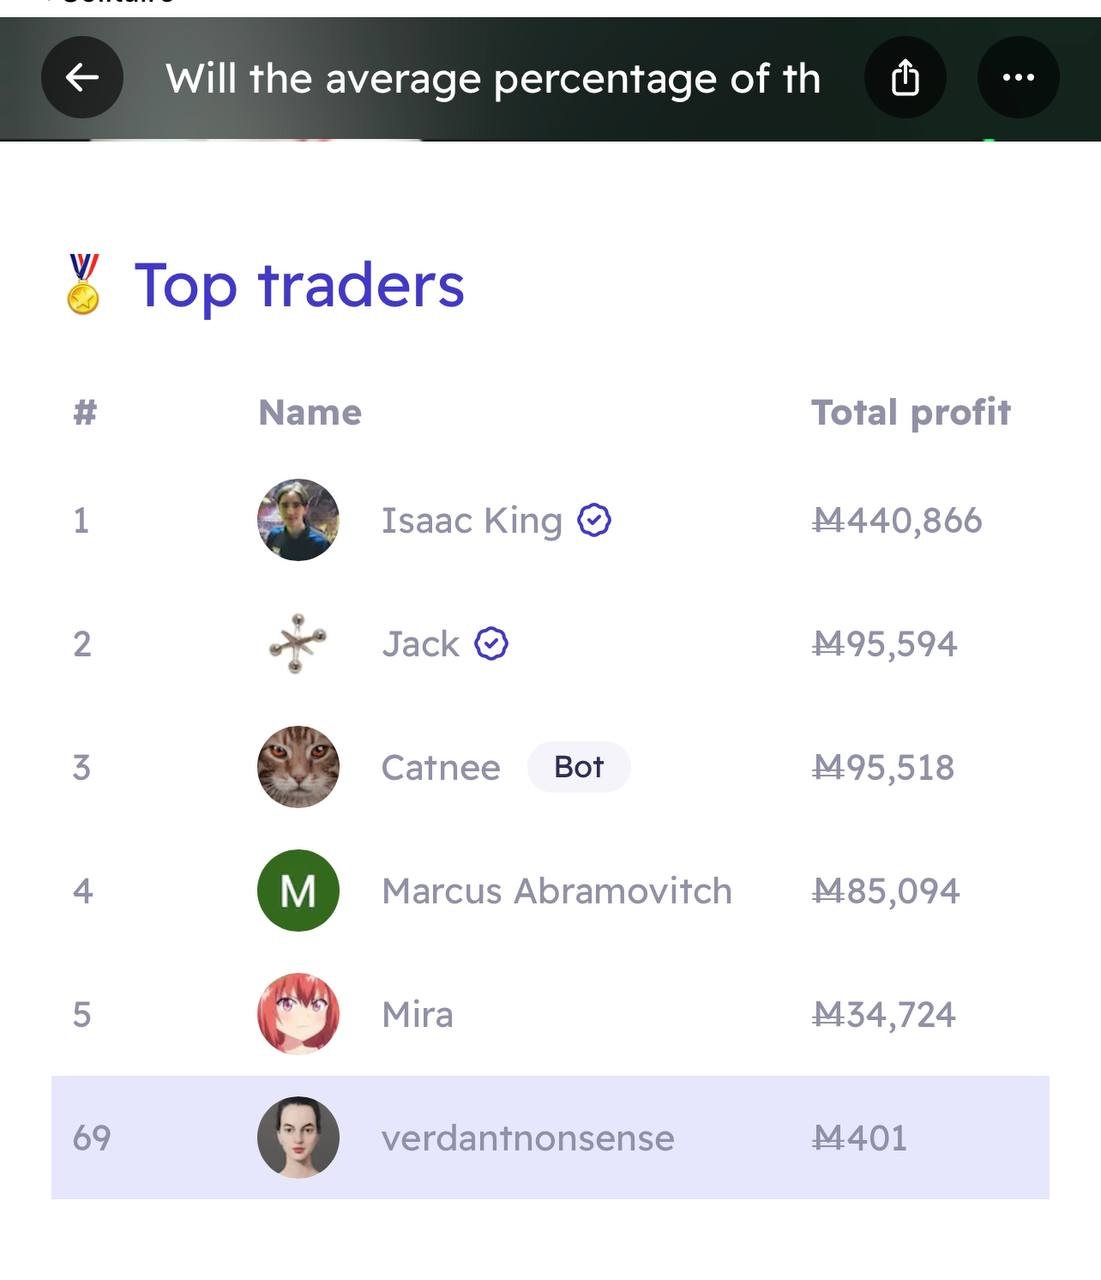
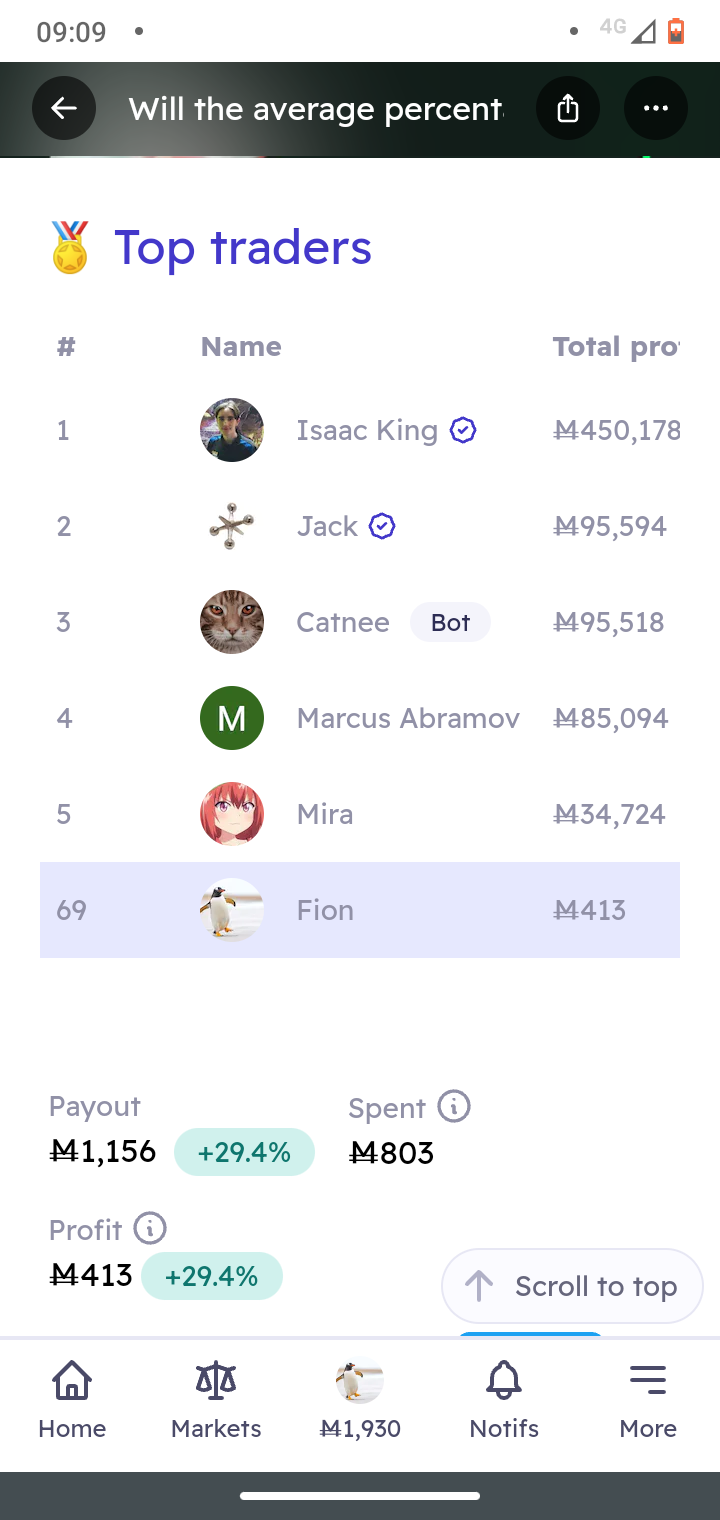
1,000🏅 Top traders
| # | Trader | Total profit |
|---|---|---|
| 1 | Ṁ450,178 | |
| 2 | Ṁ95,594 | |
| 3 | Ṁ95,518 | |
| 4 | Ṁ85,094 | |
| 5 | Ṁ34,724 |
@JosephNoonan That April Fool's joke was from @Conflux himself
https://manifold.markets/Conflux/will-the-average-probability-of-thi#Unaa4hS4nL6jPxKnsAK2
I am back from slumber and the spreadsheet has been finalized.
Final average: 36.457 %
A note on differences:
I have calculated the exact same average as @Mason which makes me confident, that it is not completely wrong.
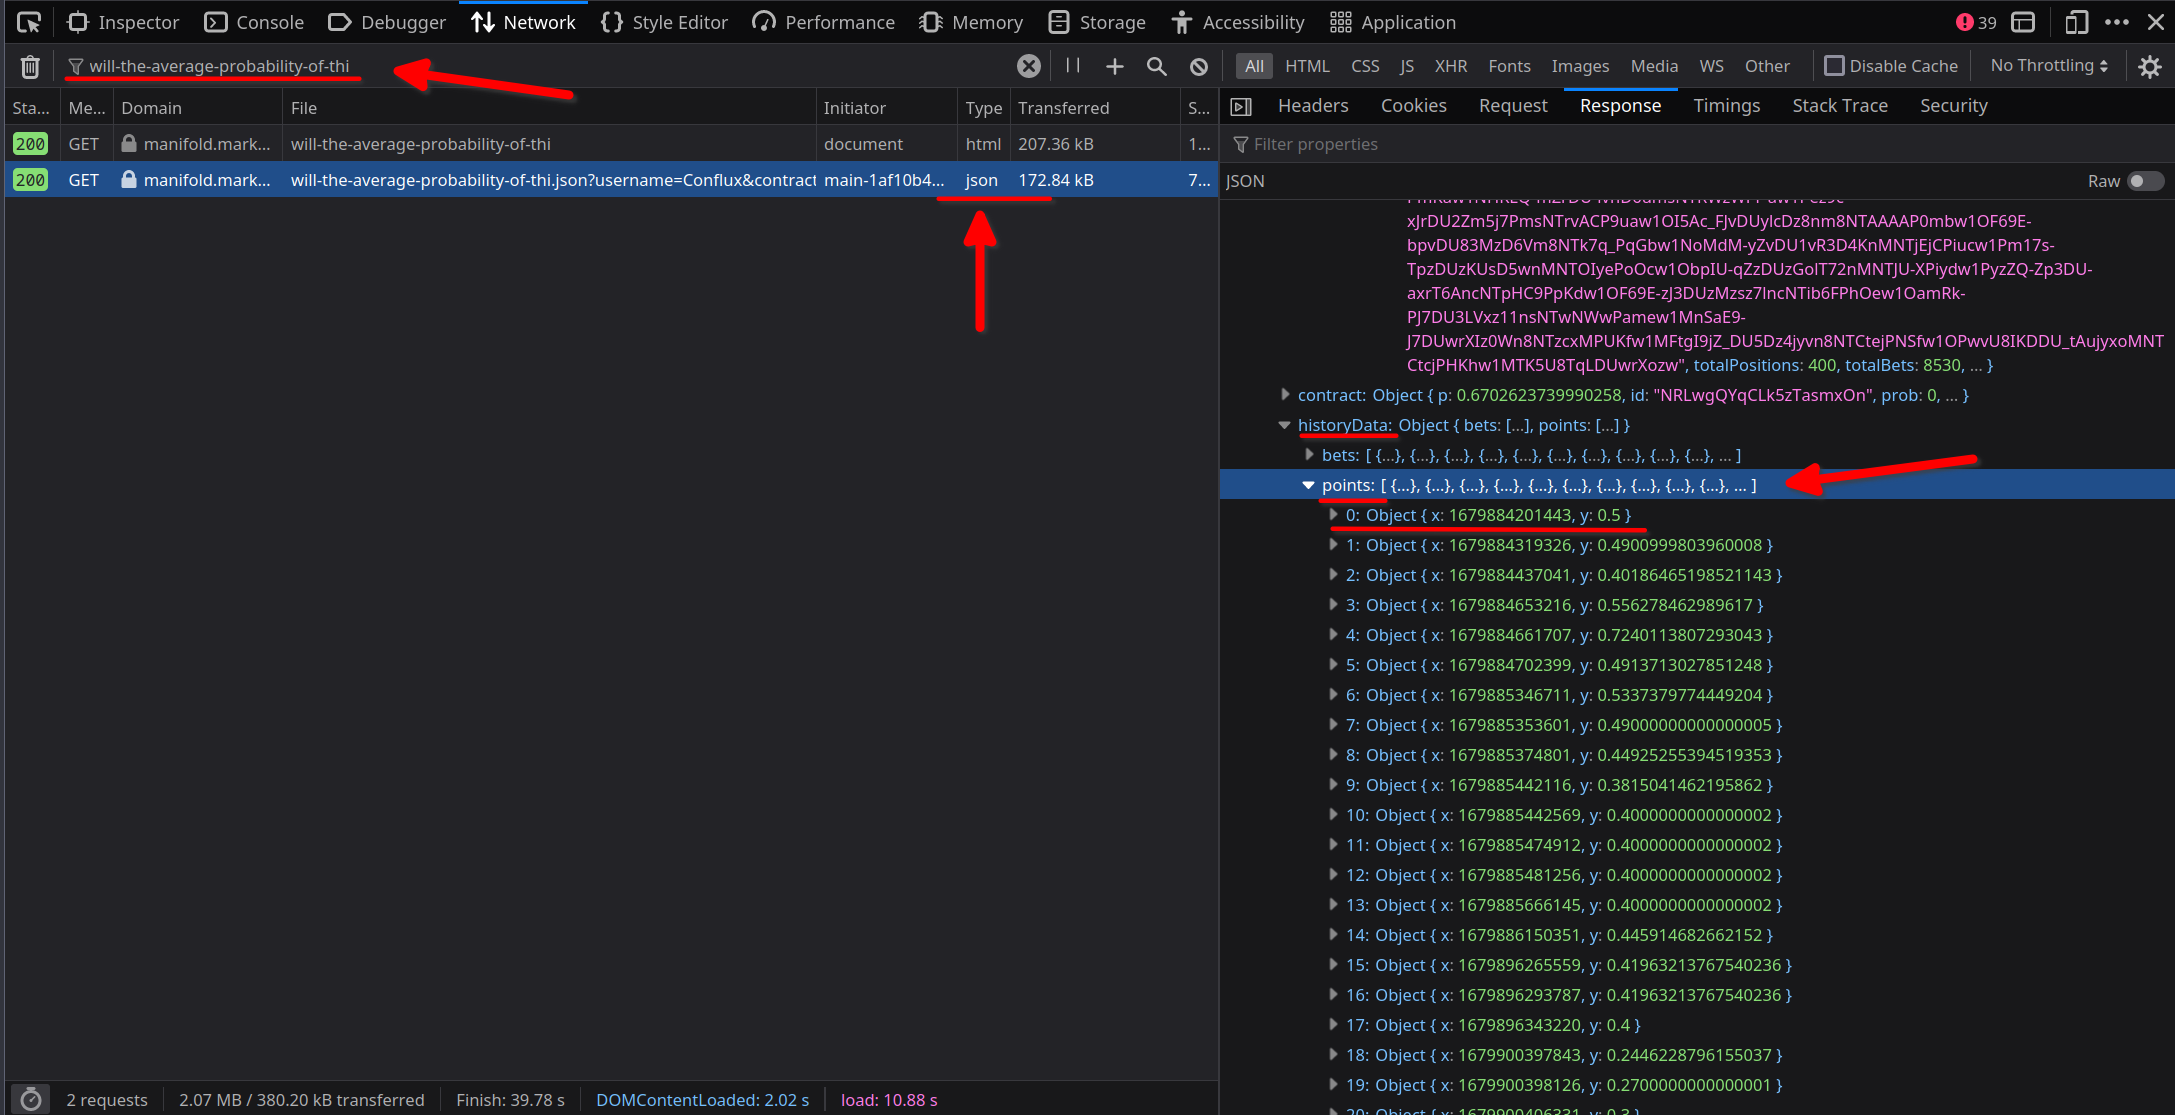
The data in the spreadsheet is the data manifold.markets sends to my browser periodically. My educated guess it that this data is used to update the graph we see on this site. The naming of the variables supports my guess. The data is called "points.x" and "points.y", which is a common way of naming plot axis. But I have not (yet?) reverse engineered the site nor have I looked closely at the JS code.
I have also not looked at the official manifold API (why do that if the data is already there?).
The data from the API could be different, why I do not not know. Only manifold will be able to tell us.
In my opinion, using the data that us used to generate the graph, and not the data from the API, is consistent with the initial resolution criteria by @Conflux "...I will use displayed percentages...".
Have a nice day everyone.
@AlexbGoode Thanks for all the hard work. I’m sure the API data includes lots of duplicated records for transactions, like same-trader YES+NO share redemptions, limit order fills, and who knows what else, so a simple, blind script adding up every single (time-weighted) probAfter instance would likely end up a bit higher since limit fills (and thus double and perhaps triple counting of those) seemed to me obviously biased towards the buy YES side.
Anyway, glad this clears it up, and hope someone from the manifold team can confirm and further clarify such differences.
@AlexbGoode I also get 36.457 with my own script and data scraped from the browser console. Whereas I get 36.553 using the Manifold API.
I agree the data in the browser is what was meant by the resolution criteria, and in the case of disagreement it should be used. But I didn't expect a discrepancy between the two data sources. I don't find @deagol's speculation about duplicated records convincing, since it should all come out in the wash as long as the probAfter value of each bet, is correct as of the timestamp of each bet, duplicate or not. Whatever is happening it remains a mystery to me, and I think it's not obvious which direction it would bias the result compared to the data that gets sent to the browser.
@deagol the discrepancy has been resolved and was about redemptions. I don't know what they are, exactly, or why the API data doesn't have a meaningful probAfter for them that refers to the probability of the actual market. But it is apparent that they are not supposed to be displayed in the bet history in the browser, and so they are not relevant to the average probability of this market.
When removing them, calculating the average probability with the API agrees with calculations from the browser-scraped data.
@AlexbGoode This seems legit! If anyone wants an official average, I think it’s 36.457%.
@AlexbGoode for context, we send the x and the y of the chart via the next.js staticProps, meaning that they are pre-computed and cached the server. You can see the calculations in contracts.ts, and basically the x's are the time and the y's are just the probAfter.
The reason we do this is so you don't have to wait for the graph to load when you visit a market.
Wow, I did not expect The Market to get this big. 458 traders! Front-page April Fools Day feature! M$2 million volume! Lots of lag! The biggest spike in Manifold revenue ever! (Seriously, check out the revenue graph on manifold.markets/stats.) King (Isaac) has become king (of the all-time Manifold profit leaderboard). Traunches have been laid down, and whales and common bettors alike have won and lost.
In Which The Creator, Who Got Filthy Rich On Bettor Bonuses, Laments His Market
I have mixed feelings about my biggest market ever being a self-resolving market (as I keep finding myself saying, bet on gambles and your profits are in shambles), and I plan to keep most of my markets about real events, political, personal, and everything in between. Nevertheless, many people seem to have found this fun, and that makes me happy! Just always remember never to bet mana you'd feel rotten losing. Also remember that it's just a fake-money betting platform. (Unless you're @galen and you've lost thousands of dollars worth of mana, in which case...well, he said he was trying to make an indirect charitable donation, and it seems like a lot of NO bettors are donating to charity, so...)
If anyone feels a desire to quit Manifold over their losses, I'd love to talk you out of it. (So would @Mira, according to her comments.) Honestly, I'm surprised by how many free-mana opportunities there still are, if you know where to look. The other day I made M$903 by simply checking whether the resolution criteria of a market had been met and finding that it had been for two months. And if you bet on real markets, you're improving the accuracy of my favorite website ever for finding probabilities of real-world events. I hope you help contribute to the Manifold project! Certainly I'd love it if you bet on some of my (obscurer) markets.
Back to The Market
As for The Market: Official calculations are still being vetted, but it seems like the final average percentage ended up around 36 or 37%. The rounding was weird but seems to have made almost no difference. Hopefully a consensus will emerge about what the correct answer is, but not quite yet — see this market. The latest data still has to be added to @AlexbGoode's spreadsheet, but it's been a great resource. It seems like a NO victory became foreordained about 24 hours before the market closed, and that the geometric mean (lol) ended up at 0, since The Market briefly hit 0.0%.
To conclude, I will leave you with this immortal wisdom: Ack a jock iit.

@MP No, not even close. Nobody cared to subsidize this market, so it just has the unique trader subsidies, which total a piddling M$2000. Some markets have had upwards of M$20,000 liquidity.
@IsaacKing I think Liquidity is not measured by Liquidity subsidy but by order book depth and how much I need to lose to exit a position
Right now I can exit a $M7,000 position moving the market just by 0.7%. I don't recall many markets like this
@MP Liquidity and limit orders are differently things. Liquidity is how much mana can be won from the market itself, without betting against any other user. Limit orders are winning mana from other traders.
It's difficult to move the market upwards due to limit orders, yes, but those limit orders could have been placed at any probability and are not evenly spread across the options, so I don't think there's a meaningful single number to describe how far the market will move. (If I recall correctly the "elasticity" number in the market details is trying to do that, but it's buggy and largely useless right now.)
@IsaacKing there is no single number to measure Liquidity. But in financial markets, a given market is said to be liquid based on how fast you can enter or exit a position while not moving much the market. If you go to buy $10M AAPL tomorrow, the market won't feel that.
Even without limit orders or Liquidity subsidy, if I sell a bit, soon a trader will come and push the price down. If I do that fo4 a while, I can exit a position that is usually high for most markets without losing much.
@IsaacKing I consider limit orders and speed-of-pushback from the market if I move the percentage to be forms of liquidity. Subsidies are liquidity as provided by the AMM, but there is also liquidity as provided by other traders. The AMM is just another trader.
Otherwise Microsoft stock has 0 liquidity because exchanges rely more on limit orders... but in real life being paid in Microsoft stock is as good as cash because you can reliably sell it.
yeah, that which we call 'liquidity' in the amm code is a misleading term for the reasons that Mira and MP gave. Perhaps we ought to call it something else in the "more" panel.
I'm still not sure what the best way to convey slippage / depth / accuracy to users is, both in terminology and in UI