This market predicts the month in which the 30-year global warming trend will first reach 1.37°C — or higher — above pre-industrial levels. The 30-year trend refers to the average global temperature increase calculated over a rolling 30-year period, compared to baseline temperatures recorded before industrialization (1850–1900).
The market will resolve based on data provided by Copernicus, the European Union’s Earth Observation Programme. The relevant data can be found on the website of the Copernicus Climate Change Service, specifically in the Global Warming chart located between the "News" and "Case Studies" sections. At the time of creation the latest data on the chart displayed 1.36°C for October 2024.
The resolution date is set to align with the next answer scheduled for resolution (currently November 2024). It will adjust dynamically to always reflect the next scheduled answer.
Update 2025-03-09 (PST) (AI summary of creator comment): Important Data Source Update:
The resolution data is now sourced from the Application tab on the Copernicus website.
The main website (previously referenced between News and Case Studies) is not updated.
All resolution decisions will continue to be based on data from the Copernicus Climate Change Service.
 1,000
1,000🏅 Top traders
| # | Name | Total profit |
|---|---|---|
| 1 | Ṁ155 | |
| 2 | Ṁ50 | |
| 3 | Ṁ41 | |
| 4 | Ṁ40 | |
| 5 | Ṁ38 |
People are also trading
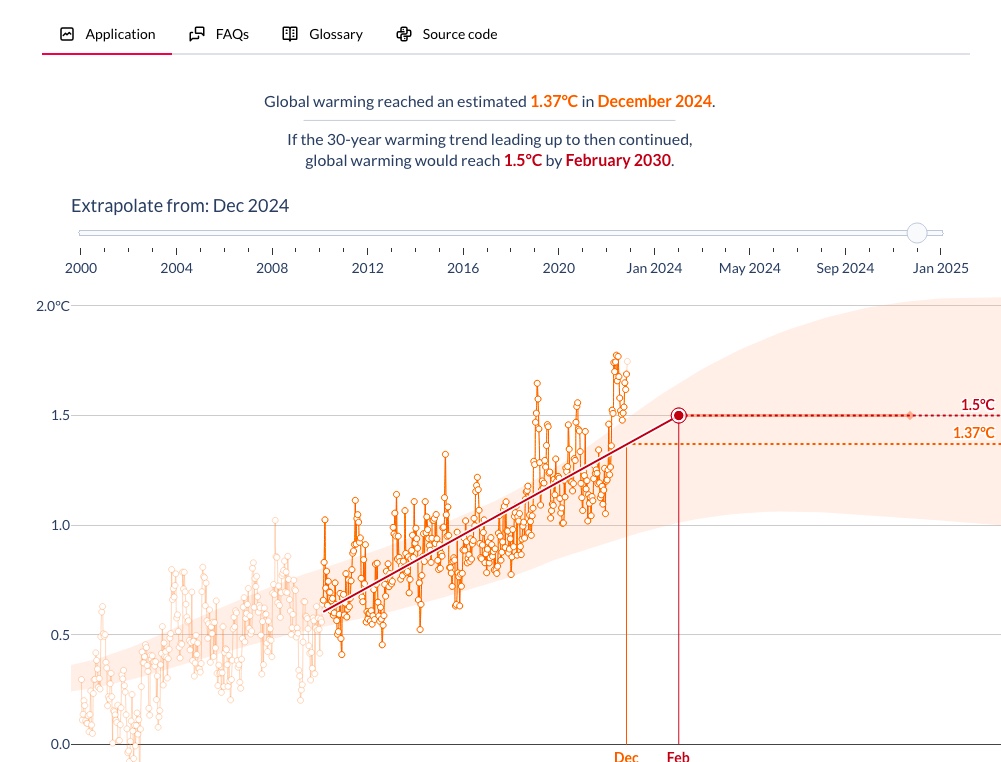
The main website is not updated, but I have now learned that the data for resolution can be found here, clicking on ‘Application’:
https://apps.climate.copernicus.eu/global-temperature-trend-monitor/?tab=plot
Thank you, @parhizj for your comment.
Code for this is very well documented but there maybe a problem with the resolution source for this question.
https://apps.climate.copernicus.eu/global-temperature-trend-monitor/?tab=source-code
I’m hesitant to do any more work than this preliminary research for a bet in this market since according to the FAQ it should have been updated for January 2025 temps already:
https://apps.climate.copernicus.eu/global-temperature-trend-monitor/?tab=methodology
“
The global temperature trend monitor is typically updated on the fifth of each month with the previous month's data. This is in-line with the availability of the ERA5 monthly averaged data on single levels from 1940 to present dataset in the Climate Data Store.
“
I checked the data set referenced and January data is available but the applet hasn’t been updated on the main webpage since August 2024 (5 months ago). @ConservationForecasts , pinging you in case you are unaware.
@parhizj >hasn’t been updated on the main webpage since August 2024 (5 months ago)
I see October 2024 data on the chart. So Nov Dec and Jan missing. Is August 2024 update correct and it should update monthly but something broke after October update? Or are we seeing different things or ...
@ChristopherRandles Might have been a interactive thing (clicked on datapoint?) or some weird glitch on my tablet.
On my computer I do see October, so you are right it is just missing Nov-Jan.
@parhizj There is a bar at top so you can go back to previous months. An accidental click there seems a likely explanation. This feature may be useful if it updates several months at a time we can then get to see what is says for data to Nov 2024, for data to Dec 2024 ...