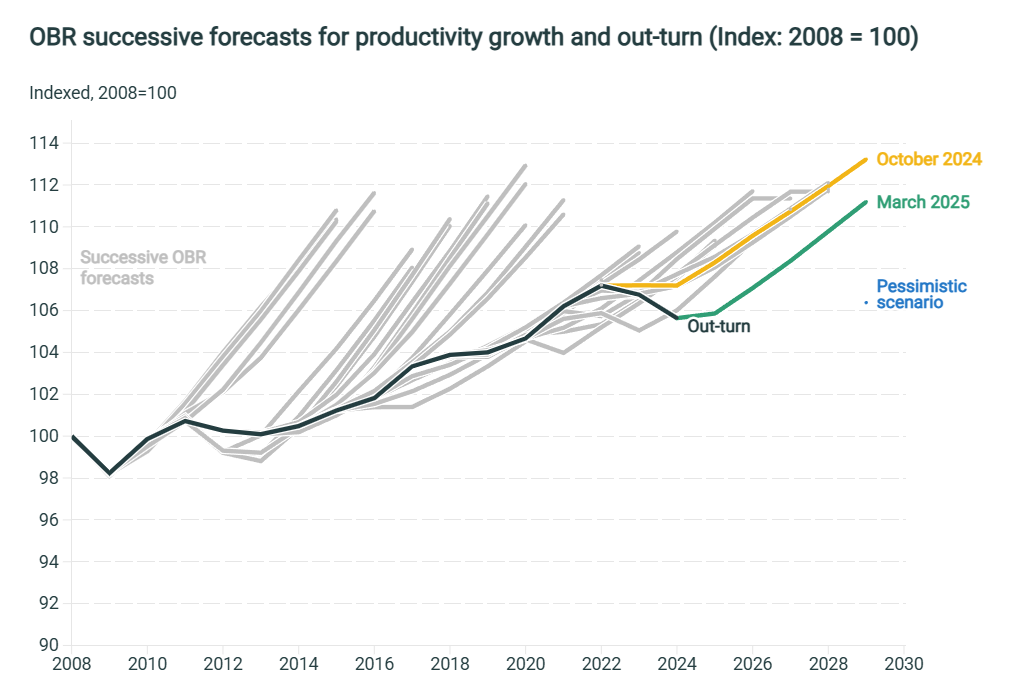
OBR has been consistently overestimating UK productivity growth, although there's some signs it's been getting closer in recent years:
What will the OBR out-turn figures be for 2029? Have they got the forecast roughly right this time?
For resolution, my dream scenario is that the IFS produces an updated version of the plot I linked, in which case I'll take the "2029 out-turn" figure from that. If that data isn't produced, I'll do my best to find it from OBR publications directly. If they don't provide a 2008 index, I'll calculate it myself. If resolution turns out to be at all complicated or controversial, I'll be open to discussion with traders, invite criticism of my approach, and ensure I don't have a stake in the outcome, selling shares if necessary. I'll try very hard not to NA. If it looks like it's going to be complicated for some reason (IFS/OBR stop existing, significant changes in how productivity is defined...) please try not to build up a big position hoping to win on a technicality. It might not go your way.
In the interval notation, square brackets mean the end of the interval is included and normal brackets mean it's not. I appreciate that productivity probably can't go negative, but you can't be too careful!
I expect the data sometime in March 2030, so I'll close the market at the end of February.
I will trade in this market.
 1,000
1,000