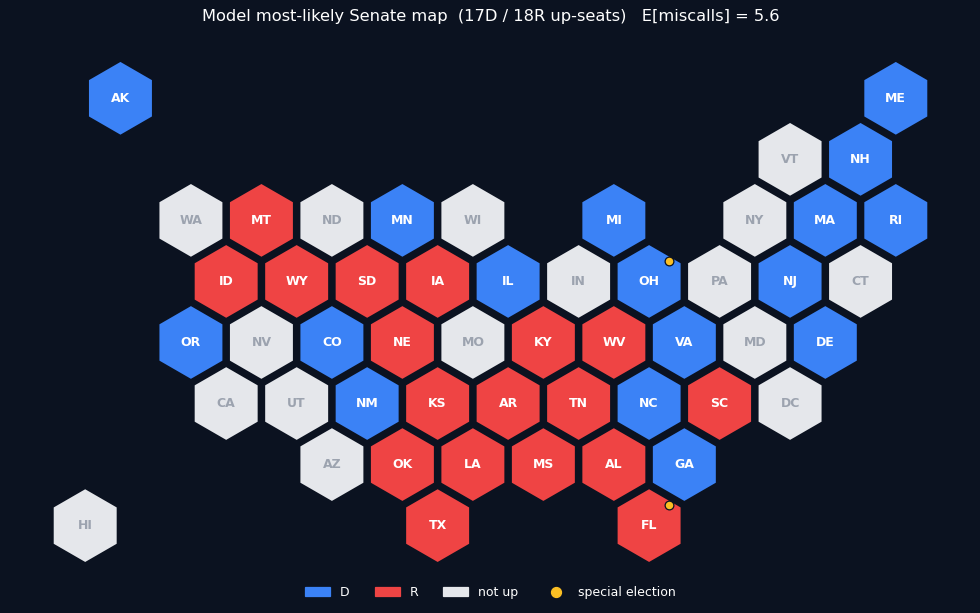
This market scores our statistical model's current most-likely U.S. Senate map — the modal projected winner of each of the 35 seats up in 2026. Each outcome is the exact number of those 35 seats the map gets wrong once the election resolves (0 through 10, plus "11 or more").
It is the self-calibration counterpart to the two third-party map markets:
The model expects ~5.6 of its own best-guess calls to be wrong — the election is genuinely uncertain, and even the most-likely map has real exposure to a correlated national swing (a fat "11 or more" tail).
The map (model run 20260622_224458):
Called Democratic (17): AK, CO, DE, GA, IL, MA, ME, MI, MN, NC, NH, NJ, NM, OH (special), OR, RI, VA
Called Republican (18): AL, AR, FL (special), IA, ID, KS, KY, LA, MS, MT, NE, OK, SC, SD, TN, TX, WV, WY
Resolution. After the November 2026 general election, count the seats among the 35 above where the winning party differs from this map's call. That count is the winning outcome. The map is fixed at market creation and does not change. (Seats are scored by party; the two special elections — OH and FL — are included.)
Seeded to the model's current distribution; will be repeated as the model's most-likely map changes.
 1,000
1,000The model in question can be viewed here: