I’m writing an undergraduate thesis comparing real and play money prediction markets at the moment, for which Polymarket and Manifold are my data sources respectively. Their relative accuracy is one of a few questions I plan to investigate.
The data: paired price time series of markets with identical resolution criteria. Polymarket’s price is the mid of the best bid and ask, Manifold’s the AMM price. Topics span sports futures, politics, econ, crypto prices, awards, and whatever other pairs I could find. Shooting for a sample size of at least 150.
I’ll probably use the prices one week before resolution, at least to resolve this market. I’ll bound Polymarket’s prices between 0.01 and 0.99 for a fair test. I’ll restrict the analysis to a-priori plausibly independent markets (which throws out a lot of politics markets). There’s a fairly big range of liquidity/number of traders in the markets.
The test: permutation test on difference in log scores. This means each market’s forecast is given the score ln(p) if it happened, ln(1-p) if it didn’t. Here, higher log score = more accurate. Then I’ll take the sum of differences in log scores across Polymarket-Manifold pairs. This is the test statistic.
If there were no systematic difference in accuracy, then the sign of each difference in log-scores should be random. This lets us generate a distribution of test statistics if Polymarket and Manifold were equally accurate - assign a random sign to the empirical log-score differences, compute the test statistic, then repeat (say) 10,000 times. If the true test statistic is greater than 95% of these values, we can reject the hypothesis of equal accuracy at 0.05 significance.
This market resolves YES iff this procedure shows Polymarket is more accurate than Manifold at p<0.05.
I anticipate I’ll have done this test some time in the next 1-3 months. But could be next week, whenever I get around to it given my other courses etc. I won’t trade in this market.
Update 2025-04-16 (PST) (AI summary of creator comment): Update from creator
Exclusion of Manipulated Markets: Any market with clearly manipulated resolutions (e.g. the Ukraine market or the Bitcoin reserve event) will be excluded from the analysis.
Purpose: This update ensures that only markets with genuine, independently determined resolutions are considered in assessing accuracy.
Update 2025-11-03 (PST) (AI summary of creator comment): Timeline Update: Creator will complete the analysis and resolve this market by the end of November (after exams next week). The creator is still gathering data to reach sufficient sample size for the analysis.
 1,000
1,000🏅 Top traders
| # | Trader | Total profit |
|---|---|---|
| 1 | Ṁ625 | |
| 2 | Ṁ492 | |
| 3 | Ṁ359 | |
| 4 | Ṁ321 | |
| 5 | Ṁ305 |
People are also trading
@traders Results are in! I’ve uploaded the data to Github here. Ended up with 147 pairs, or 127 that lasted a week or more. To give a sense of the data, here’s a random sample of 9 markets:
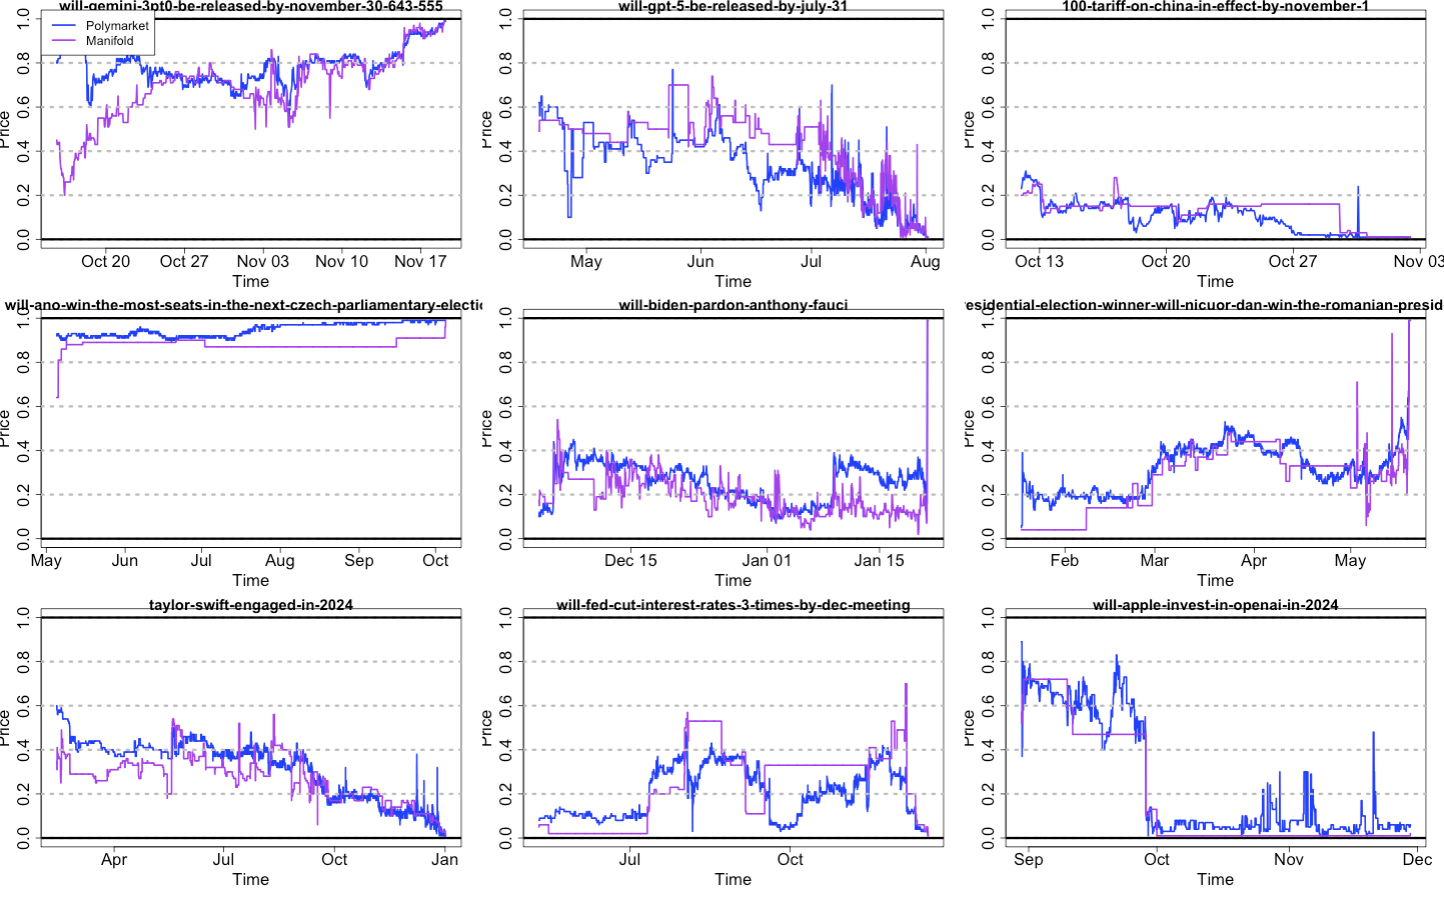
There was a decent skew towards recent markets, and most were pretty liquid. Average of 718 trades per Manifold market or 9408 per Polymarket, median 162 and 3680 respectively.
I viewed all of these markets as more-or-less independent. Topics are mainly AI, politics, sports, and war. There are multiple fed and AI leaderboard markets, but for different months, and I’m filtering down to probabilities given one week to expiry (expiry = whenever first of the pair closed), so seems like little reason those errors would be correlated. I bounded all prices between 0.01 and 0.99 to match Manifold’s bounds on purchases in binary markets, then rounded prices to 2 decimal points to match Polymarket’s $0.01 tick size. Manifold’s price was the AMM price, Polymarket’s was the price of the last transaction (not mid market).
Manifold and Polymarket correlated strongly but not perfectly:
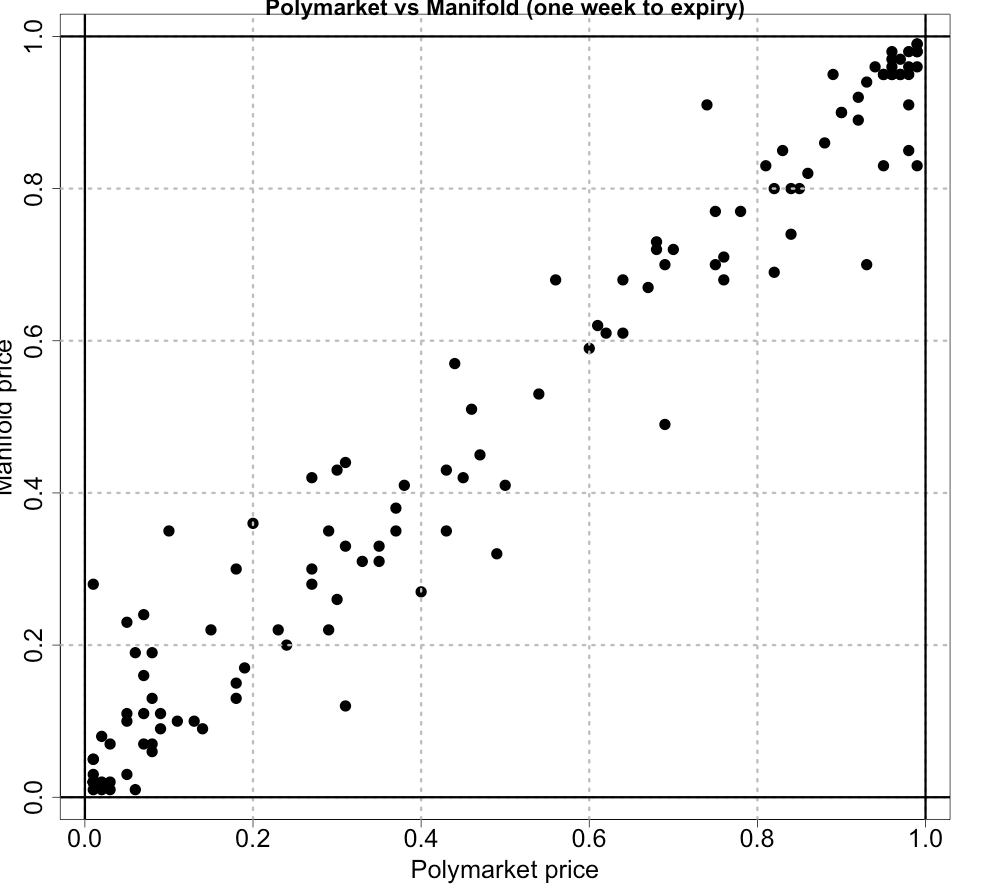
5.1 percentage points was the average absolute deviation at one week to expiry.
Polymarket’s average log score (higher = better) across the 127 markets was -0.5804, and Manifold’s was… -0.5796.
Was this average log score difference of 0.0008 significantly different from zero? I ran the permutation test with 100k samples and shockingly:
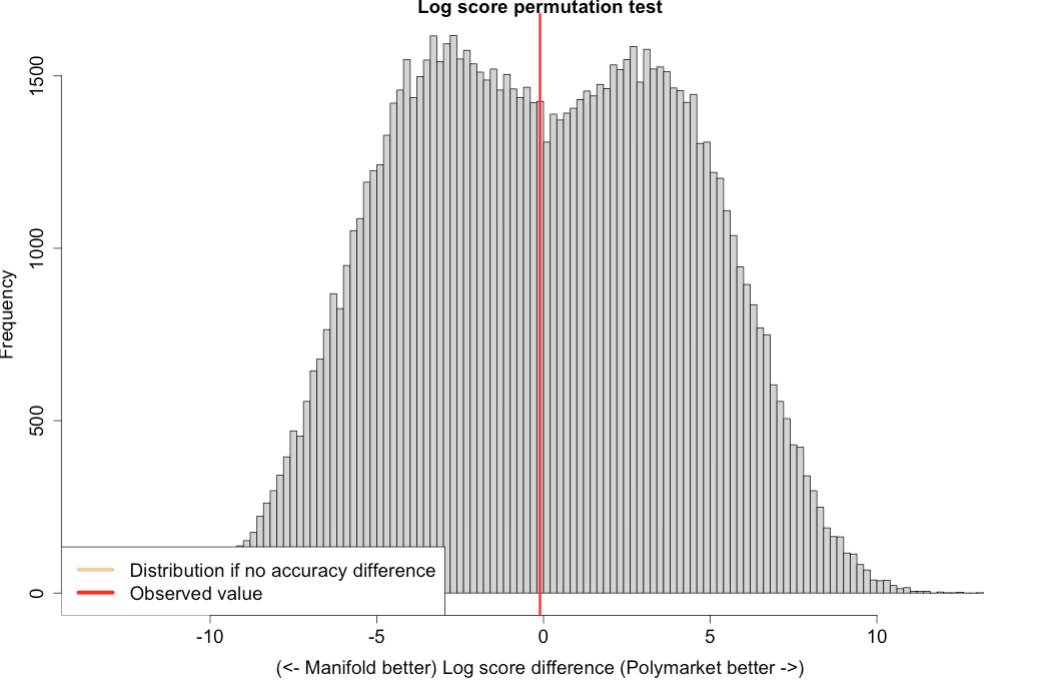
No. p=0.492.
(note the test statistic is the sum of log score differences, not the average, hence the large x-axis here)
Curiously Polymarket outperformed Manifold in 56% of cases, and they gave equal forecasts in 12.6% of cases. But Manifold’s relative wins were bigger, the biggest of which was the Greenland parliamentary election, where Polymarket managed to assign a 1% chance to the winner a week before expiry while Manifold was at 28%.
Polymarket’s biggest relative win was giving Anish Giri a 3% chance to win the FIDE Grand Swiss, while Manifold gave a 1% chance.
This extreme punishment for extreme forecasts is a characteristic of the log score, since ln(0)= -infinity. So I tried the same permutation test with the Brier score, which is bounded between 0 and 1 for each forecast. But:
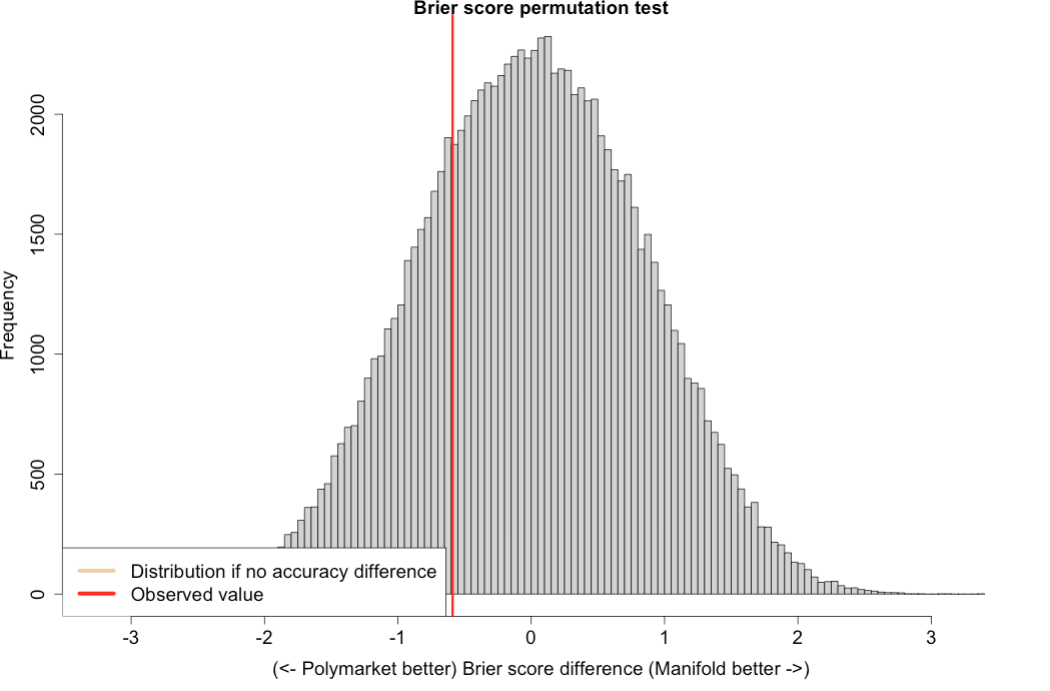
While better for Polymarket, still not significant, p=0.25.
In fact, there was no significant difference at p<0.05 in log scores at any time horizon from 1 to 20 days either (and you’d expect one by random chance!). So I don’t think there’s any way to slice it where Polymarket wins here. Or Manifold.
This is somewhat surprising, but actually consistent with the biggest academic paper comparing real-money and play-money prediction markets, from 2004. They compared 208 markets pairs on ‘NewsFutures’ and ‘TradeSports’. Very similar to this, and they also find no difference in accuracy. They argue it’s due to stronger reputation effects with play money, but I think there’s a couple other things going on here:
First, there’s a lot of work in experimental economics on how many participants in a market are needed to get theoretically predicted prices. The answer is generally ‘not that many’, like, less than ten, or just two people with a ‘handful’ of repeated transactions. If you average the opinions of 100 real-money traders, maybe you get a better estimate than the opinions of 10 play money traders, but it actually won’t be that much better, and you’d need a huge sample to detect a difference.
Second, Manifold traders can observe Polymarket prices! Also the converse. But if anyone thinks one is more accurate than the other, they can make either dollars or mana in expectation when markets disagree, and the process of doing this brings the markets together. It’s not exactly arbitrage, but if I see 35% on Polymarket and 15% on Manifold, I’m probably going to trade on at least one of those markets. Again, the mean absolute difference between the markets was 5ppt.
There may be some effects with time preference, but it’s not clear to me which direction it would go in. Some Manifold whales have very low discount rates but I think most people on Manifold are here for fun and waiting 6 months for a payoff is not fun. Anyway, there you go. Feel free to download the data and have a poke around.
Hey all sorry for the delayed resolution here! Ended up pivoting topics for the thesis to focus on time value of money, and comparing Kalshi to Polymarket was more useful for that. I posted my results of that in the discord in #links if you’re interested.
I will still do the analysis for this Polymarket vs Manifold question. I have some data but my sample size isn’t big enough - will take a day or two to get more data and resolve this market by the end of the month after my exams next week. Incentivise me here:
@SDO yeah there are some cases, like whether jesus will come back in 2025, where manifold doesn't have the interest rate distortion as much bc people have more mana than they know how to spend. but manifold is much less efficient beyond that, so yeah probably cancels out partly but polymarket ends up on top anyway
@shankypanky thanks for the ping! @brod feel free to reach out if you want assistance on this. I haven't run the exact test you mention here but I do have log scores for a few hundred matched markets which should help.
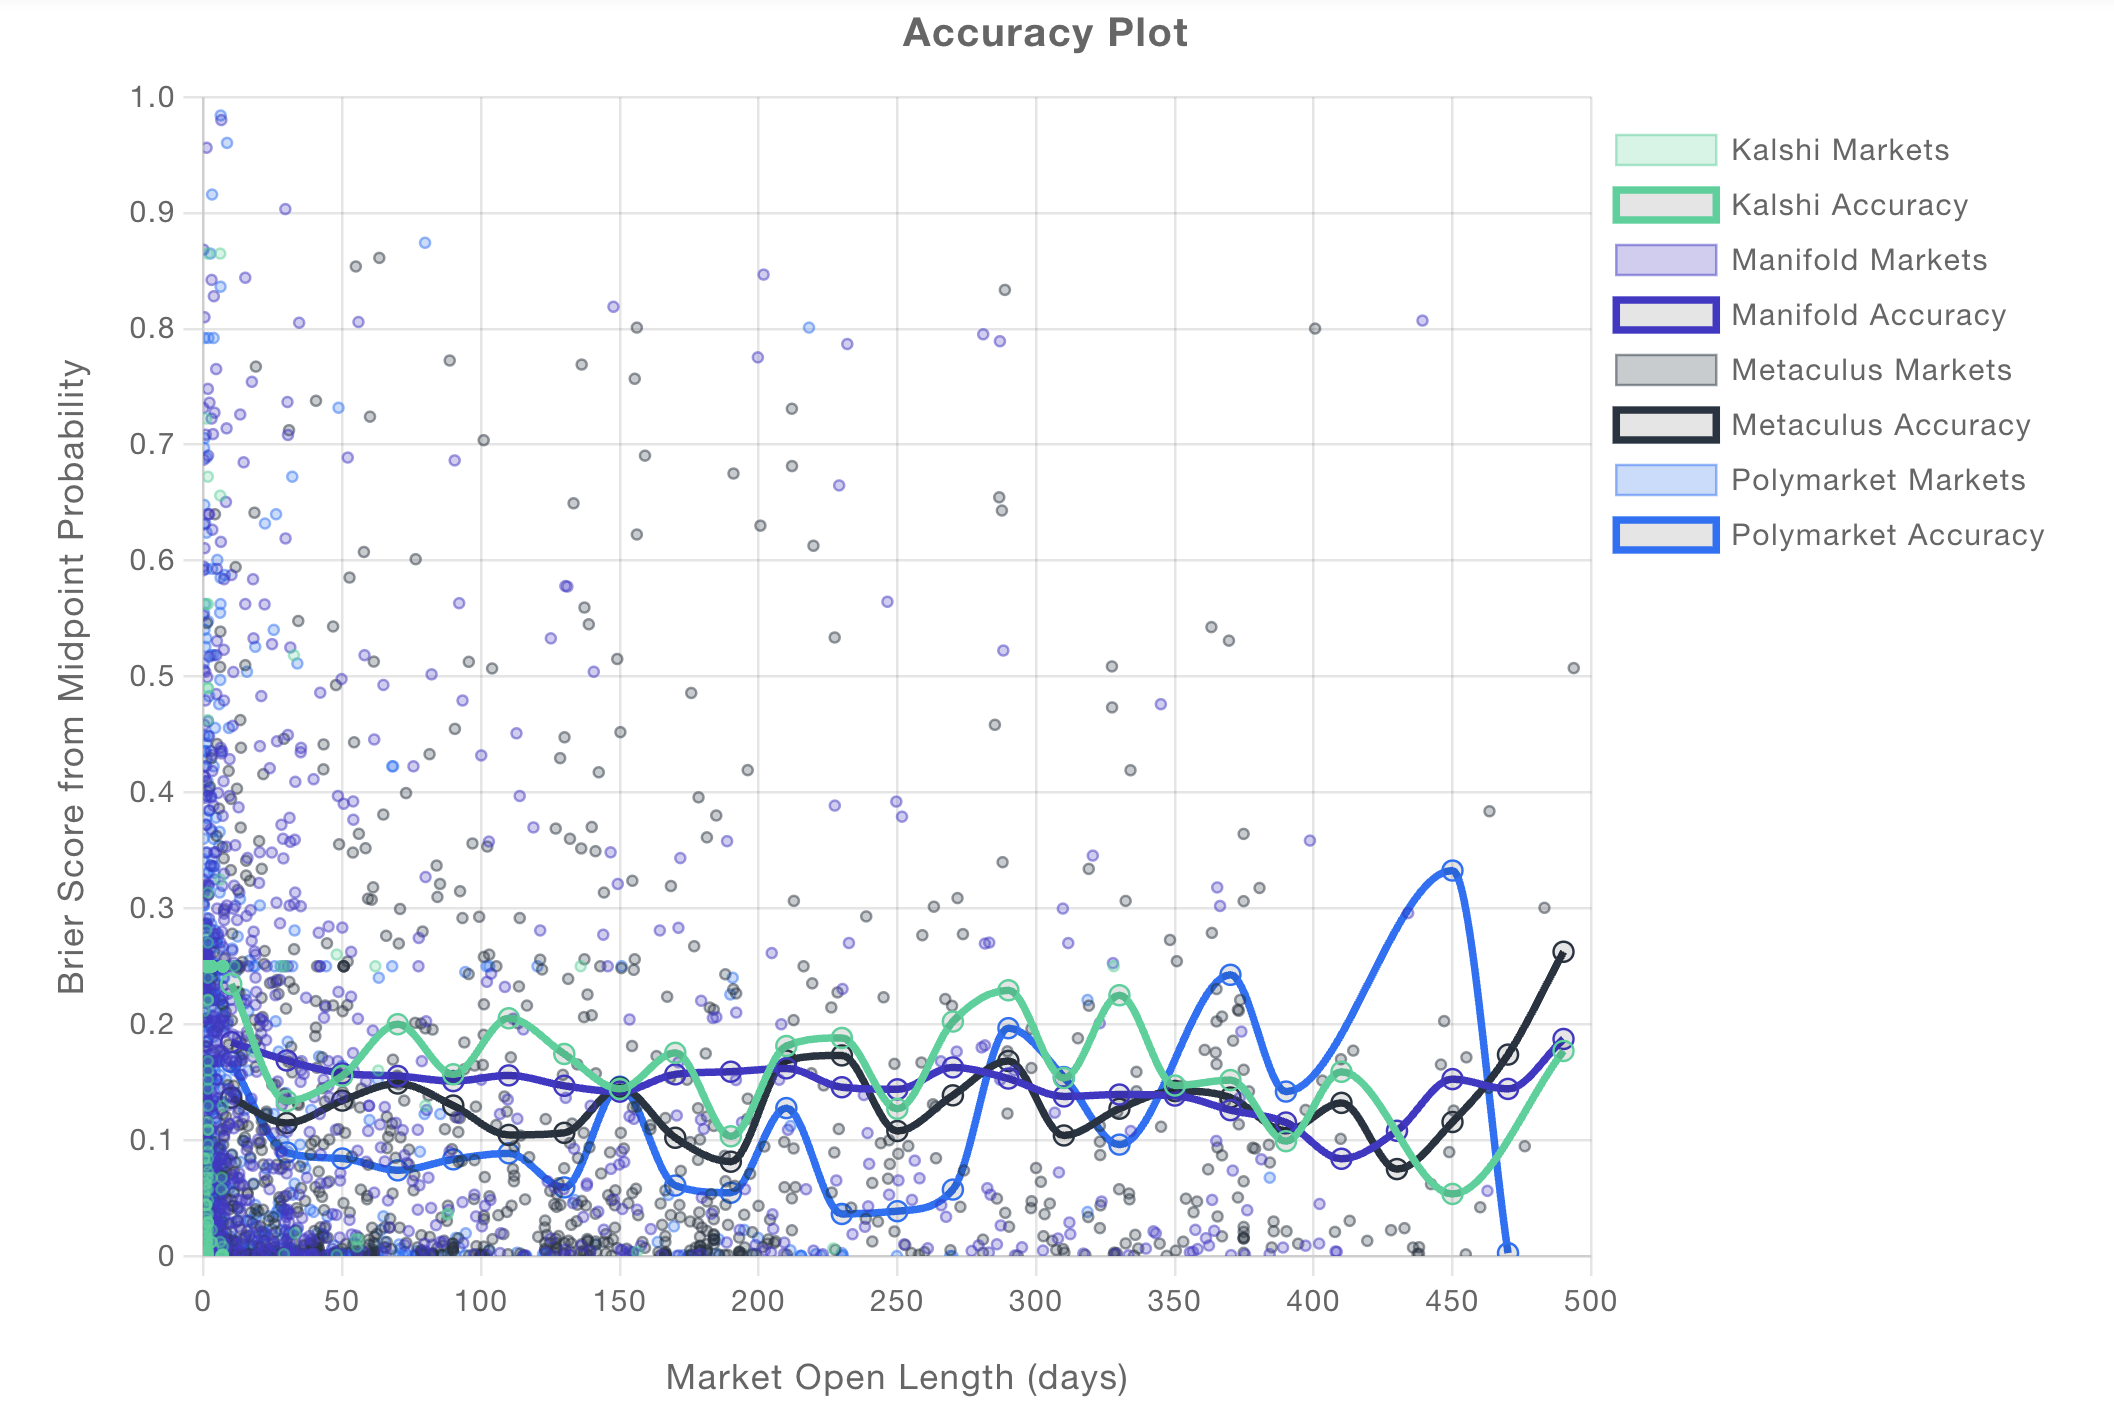
In case it is useful, you can compare prediction platforms here (https://calibration.city/accuracy), see for example the attached plot. Note that it is comparing across potentially different questions, and that Brier scores are less sensitive to extreme outliers than log scores. In either case, Polymarket seems to be doing better than Manifold as far as I can tell?
@bens could the question then be "at some values x where num of traders is > x, is polymarket more accurate than manifold where p<0.05?" No reason this can't be exploratory, it would be interesting to know if there is such an x or if there are multiple, and then test predictions off of that x.
@Kingfisher plausible! my intuition is a >150 markets would be enough, but the test i’m using is non-parametric, so it does have less statistical power compared to eg a T-test
also worth noting log scores tend to reward/penalise probabilities near 0 or 1 a lot, so i suspect a lot of the result hinges on how well each market prices 90-100% or 0-10% events
@brod It depends on the type of market. Manifold>Polymarket on most 2024 election markets. On others IDK, that would be interesting.
@HillaryClinton Agreed, excited to see results.
@Brad do you have a plan to handle Polymarket markets with clearly-manipulated resolutions? For example, Polymarket's "Will Trump create Bitcoin reserve in first 100 days" is at 10%, due to coordinated manipulation of the consensus mechanism (see comments), while the Manifold consensus is that this has already resolved YES. (Arguably, the Manifold one is correct.)
- Polymarket: https://polymarket.com/event/will-trump-create-a-national-bitcoin-reserve-in-his-first-100-days
- Manifold: https://manifold.markets/AaronSimansky/what-will-happen-within-donald-trum ->
"Trump create a national Bitcoin reserve" sub-question

@brod Are the probability pairs generally pretty close to each other? Should be easier to detect a difference when the forecasts disagree a lot.
@Kingfisher will avoid any markets with manipulated resolutions like the ukraine one a few weeks ago - didn’t know about the bitcoin reserve one!
@travis Still cleaning data but here’s the Manifold price as a function of Polymarket’s price over about 100 markets (prices sampled daily)
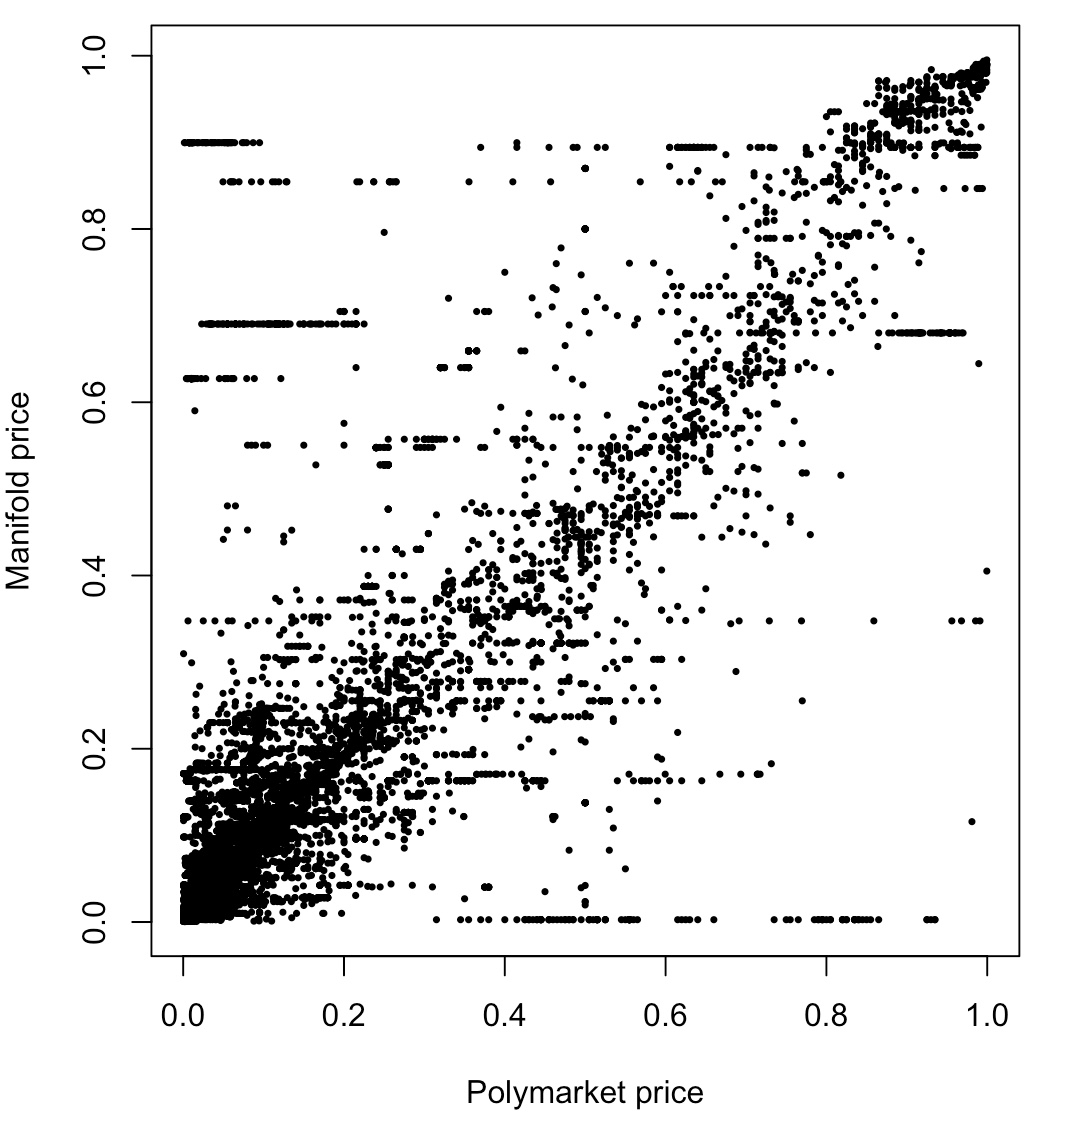
@brod What are the probabilities with the horizontal “manifold lines” in that chart? Eg looks like maybe 90%, 85%, etc? And what’s up with all the manifold markets near 0% with high polymarket probabilities? Mind sharing an example?
(After you’re done, would love to see the dataset uploaded, but totally understand if you’d rather not until the project is complete!)
@Ziddletwix @travis took a closer look - a few illiquid markets and a few fuck ups in pairing on my part, whoops! corrected version:
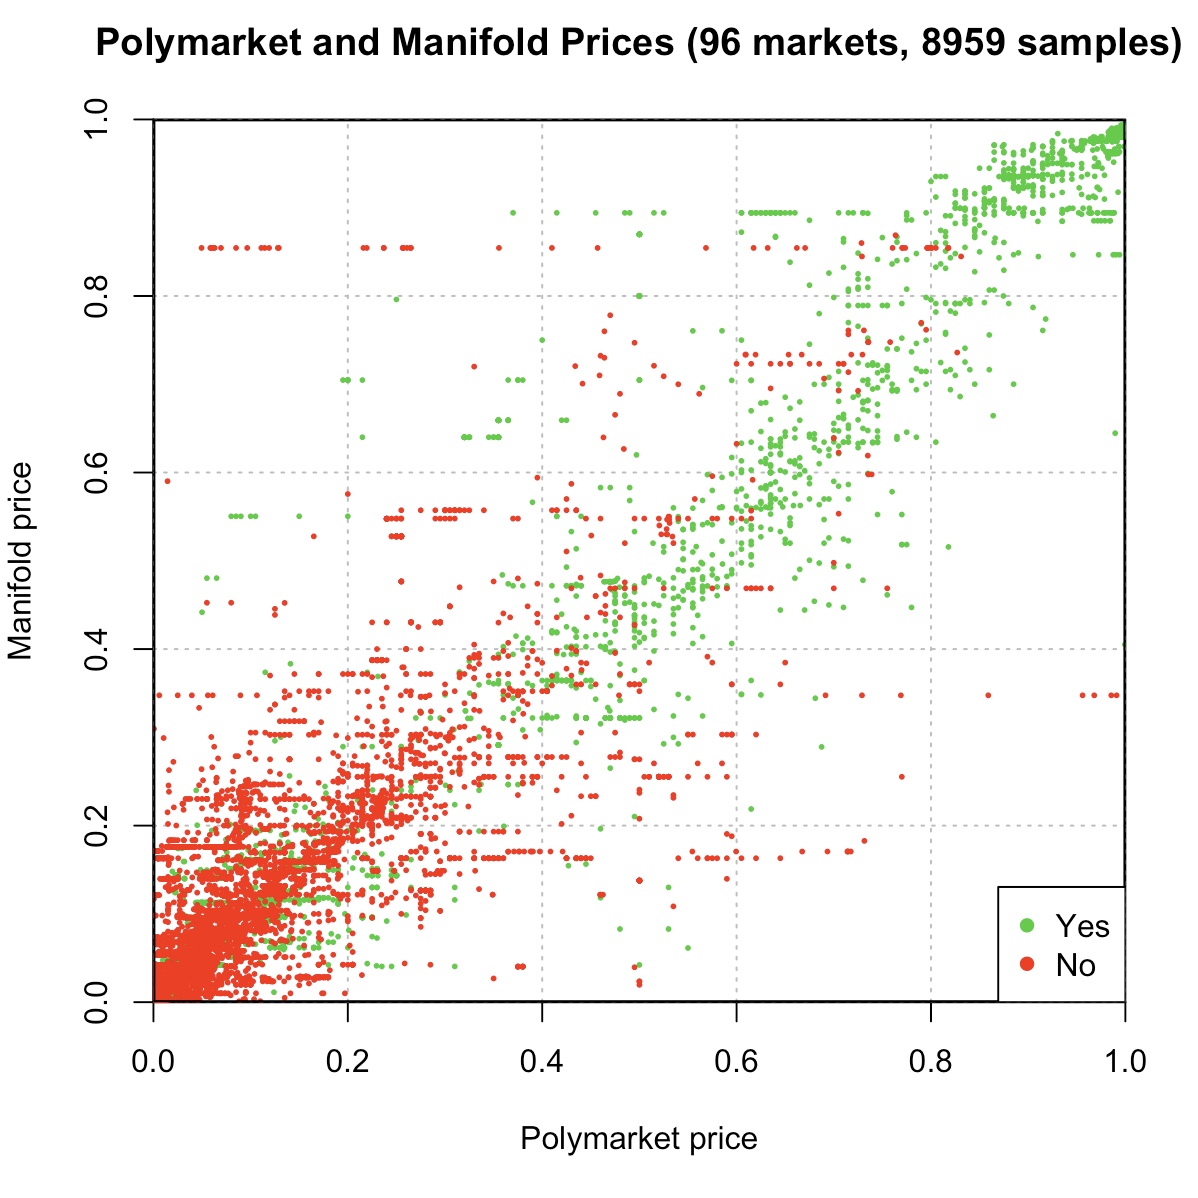
the remaining lines (see around (0.1, 0.85) and (0.6, 0.2) and (0.95, 0.35)) are markets that didn’t get much attention on manifold and stayed mispriced for a while in particular:
How many SpaceX Starship launches reach space in 2024?
$PNUT listed on Coinbase in 2024?
my main fuck up was accidentally pairing a market on the november 2024 FOMC decision to one on the november 2023 decision - that was the weird set of points at the bottom on the previous chart, my bad!
@brod ah got it, so this plot includes multiple points per market (at different times). For the final test, will it just be a single probability per market (IIuc from description, ~1 wk before resolution), or will it also be a multiple data points?
Cool to see the details!
@Ziddletwix yep that’s right - final analysis will just be the one data point per market (to avoid issues from correlated data points). will also need to get more markets for the final analysis
@brod makes sense!
If the true test statistic is greater than 95% of these values, we can reject the hypothesis of equal accuracy at 0.05 significance.
This market resolves YES iff this procedure shows Polymarket is more accurate than Manifold at p<0.05
so to confirm, this is 95% one-sided? (i.e. just for polymarket more accurate than manifold)
@Kingfisher fwiw i don't think p=0.05 is such a high bar to clear here, since the pairing helps a fair bit (compared to a difference in means).
rough intuition: assume 150 questions, there's some true prob of the event occurring (i went in a uniform sequence), & simulate outcomes. assume manifold & poly always diverge by some delta in the log odds (+/- delta/2 compared to that true prob in log odds). but poly is better, so 60% of the time, that delta points in the right direction, & 40% it points in the wrong direction.
with delta=0.2 (so if true prob = 0.5, you'd have manifold/poly with like a ~5pp gap), & poly is "right" 60% of the time. that should be detected ~most of the time (60%+) @ 95% confidence. "poly is only right 60% of the time, and the markets never disagree by more than 5pp" isn't a super high bar imo—paired tests are fairly strong (for the narrow thing they claim to test).
(that being said, not sure how relevant that naive sim will be bc i'd expect the results will mostly be dominated by their performance on those occasional cases of extreme divergence. my guess is that poly will fare better on those—fewer markets, more users, higher stakes, etc, so fewer blindspots/forgotten markets—in which case it couldn't be too hard to detect the difference if brad can get to 150+ markets. but i understand taking the NO side given that it covers all cases lacking statistical power in addition to other odd surprises. tbh my prediction would hinge quite a bit on seeing a simple scatterplot like the one above but with one data point per market + the final list of all markets included—a lot of this may come down to data cleaning/filters).
@Ziddletwix I tried a simulation like that. I used a random direction for the error, but a larger average error for manifold than polymarket. It was hitting <0.05 about a third of the time, but after I saw Brad's plot, I increased the error to try to match it (just eyeballing) and it's getting <0.05 about half the time. I tried adding big outliers, but surprisingly it didn't make much difference, I guess because it increases the variance of the test statistic and makes <0.05 harder to achieve.
@Ziddletwix yep, one sided test
(also appreciate your & everyone’s comments here, good to get feedback on design and super cool people have taken an interest)
@travis yup. also, in log score, variation tends to be less punished than correctness (obviously that's a simplification, depends on the exact #s & scale you use, but i think it's the general intuition). e.g. for two events that both happen, if polymarket had [0.5, 0.5], versus manifold's [0.4, 0.6] (i.e. same EV forecast but manifold has more variation), poly has a better log score, as expected. but if instead polymarket is [0.52, 0.52] and manifold is [0.5, 0.5] (i.e. poly is just a little bit more correct), poly's log score is ~2x better than in the first case. my sim assumed poly's forecast EV was more correct than manifold's, not just that it had more variation.
@brod
I'm surprised there still seem to be horizontal clusters in both polymarket and Manifold. I'd expected patterns like that too be mirrored along the axis which should result in vertical clusters on Manifold and horizontal ones on polymarket. But then I'm not clear what's causing these clusters in the first place
@AlexanderTheGreater there are multiple data points per market in this plot. So if a
Market on manifold
Is forgotten about and tbe price doesnt change for weeks, but the polymarket price is shifting, you’ll get a horizontal line
@AlexanderTheGreater haha yep ziddletwix is right. also the polymarket price is the middle of the bid/ask, so the price can move if people place/remove orders even if no transactions take place, unlike manifold