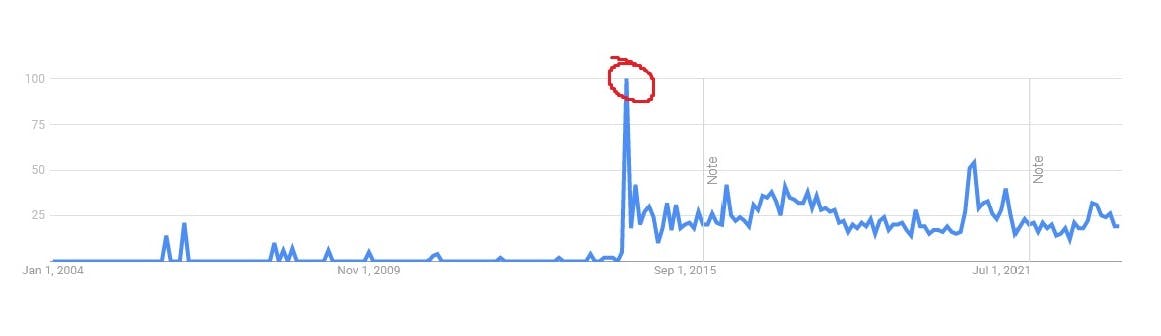
According to Google Trends interest in Nick Bostrom's book "Superintelligence: Paths, Dangers, Strategies" peaked in August 2014.

Will "Superintelligence: Paths, Dangers, Strategies" exceed this popularity peak before 2028?
[Edit: To be more explicit, the question is: will the blue line on the Google Trends graph for given parameters go above the 2014 peak before 2028]
[Edit 2: This question is about the graph displayed by the Google Trends in a web browser on PC - Google Trends displays different graph on mobile devices]
 1,000
1,000People are also trading
@MrLuke255 The question is: will the blue line on the graph go above the 2014 peak (the point marked in the red circle) before 2028.

@MrLuke255 The graph is normalized for the new highest value - the new highest point assumes value of 100, therefore the 2014 peak will have lower value if book becomes more popular than at its peak in 2014.