
November 13th to 19th is the previous peak.
To resolve I will look at https://trends.google.com/trends/explore?geo=US&q=Effective%20Altruism&hl=en and check if the line after Nov 19 ever seems to hit or surpass 50.
ETA 19 Nov 2023: I will actually change the time horizon of the linked chart to include the Nov 2022 peak.
Graph on Mar 10:

Mar 10, 1:07pm: Will 'Effective Altruism' reach 50% of previous Google Trends peak in 2023? → Will 'Effective Altruism' reach 50% of previous US Google Trends peak in 2023?
 1,000
1,000🏅 Top traders
| # | Trader | Total profit |
|---|---|---|
| 1 | Ṁ3,381 | |
| 2 | Ṁ372 | |
| 3 | Ṁ243 | |
| 4 | Ṁ93 | |
| 5 | Ṁ82 |
People are also trading
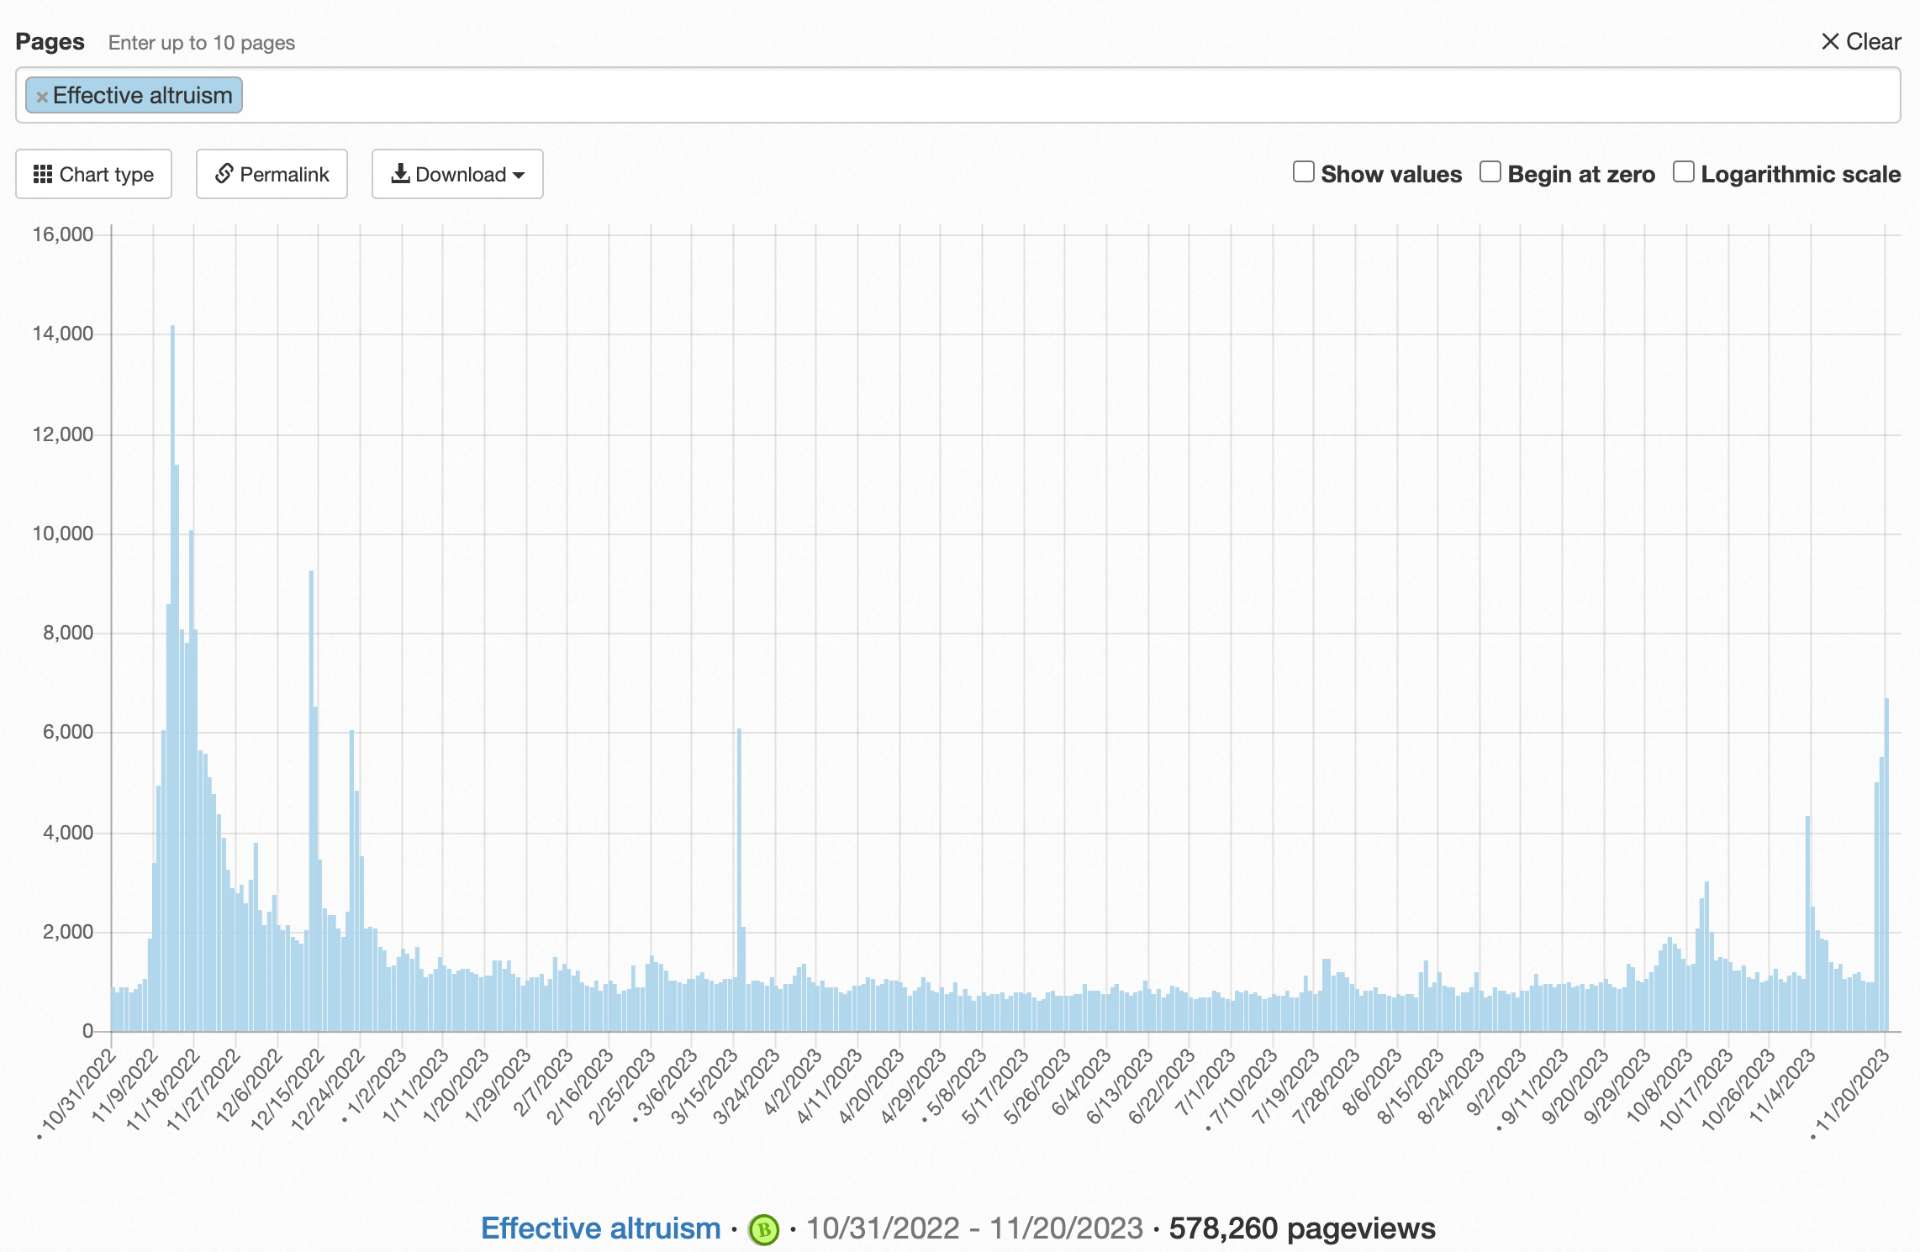
very close to 50% of prev peak on wikipedia pageviews
My simple math: Pre-Sama-drama, interest was at about 11/100 compared to the peak. From the weekly CSV file it seems that average interest went up about 6.5x since the firing. Current interest should therefore be around 70/100. So good chance it shows as >=50 once its finalized.
Does anybody have a different estimate?
[deleted[
@KatjaGrace [no longer endorse] I bet on the original resolution criteria. Might have been better to start a new market with new resolution criteria?
@TobiasH as in you foresaw that the start date would be out of range and the graph would recalibrate so that '50' didn't correspond to 50% of the previous peak (per the title) and then you bet on that? Surely you didn't think that's what I intended, or I would have titled it differently?
@KatjaGrace Yeah, I was confused and interpreted the title as "previous peak in 2023". My mistake, sorry!