Data is currently at
https://data.giss.nasa.gov/gistemp/tabledata_v4/GLB.Ts+dSST.csv
or
https://data.giss.nasa.gov/gistemp/tabledata_v4/GLB.Ts+dSST.txt
(or such updated location for this Gistemp v4 LOTI data)
January 2024 might show as 124 in hundredths of a degree C, this is +1.24C above the 1951-1980 base period. If it shows as 1.22 then it is in degrees i.e. 1.22C. Same logic/interpretation as this will be applied.
If the version or base period changes then I will consult with traders over what is best way for any such change to have least effect on betting positions or consider N/A if it is unclear what the sensible least effect resolution should be.
Numbers expected to be displayed to hundredth of a degree. The extra digit used here is to ensure understanding that +1.20C resolves to an exceed 1.195C option.
Resolves per first update seen by me or posted as long, as there is no reason to think data shown is in error. If there is reason to think there may be an error then resolution will be delayed at least 24 hours. Minor later update should not cause a need to re-resolve.
Update 2025-10-09 (PST) (AI summary of creator comment): Market close date extended to October 20th due to expected delays in data publication from government shutdown.
While awaiting official NASA GISTEMP data, the creator notes Copernicus has reported September 2025 at 0.66°C above 1991-2020 average (which may suggest ~1.16°C for GISTEMP relative to 1951-1980 baseline, though this is preliminary context only). Market will still resolve based on official NASA GISTEMP v4 LOTI data per original criteria.
 1,000
1,000🏅 Top traders
| # | Name | Total profit |
|---|---|---|
| 1 | Ṁ644 | |
| 2 | Ṁ452 | |
| 3 | Ṁ325 | |
| 4 | Ṁ273 | |
| 5 | Ṁ236 |
People are also trading
I feel bad two bots beat me and one is top trader ...
~ a follow up.. to note how things could have gone wrong for my last couple predictions this market given that the latest ghcnm (ghcnm.v4.0.1.20251114) has dropped Septemer to 119.96, quite a bit out of my expectations...
~
Relative to the run yesterday, the latest gistemp has dropped Sep by ~0.02 C degree down to 119.96 almost entirely due to an update to the South Africa data, somewhat alarmingly only by the dropping only 1 warm station in SA and two newly added cooler stations closer to the south east coast (SF000288380 and SF000068858 - George Airport and East London)
comparisons from ghcnm.v4.0.1.20251114 (recall here the anom here is for the reference period of 2024 ie. 2024 - 2025, a so cold box means a hotter 2025 relative to 2024)
and ghcnm.v4.0.1.20251113
I can say this homogenization by ghcnm looks overdone to bring the temps down in that box so much, given it looks like by the nature of the actual anomaly from what I recall examining the Berg wind last month where it was mostly effecting the southwestern parts of SA.... i.e.
i.e. in the SW part, Calvinia (SF001344780)
SF001344780 -31.4670 19.7670 975.0 CALVINIA
for instance got revised (homogenized) downwards 6 deg. C
from in ghcnm.v4.0.1.20251113:
SF0013447802025TAVG 2310 P 2395 P 2310 P 1835 P-9999 QP 970 P 900 P 1055 P 1480 P 2310 P-9999 -9999
to ghcnm.v4.0.1.20251114:
SF0013447802025TAVG 2310 P 2395 P 2310 P 1835 P-9999 QP 970 P 900 P 1055 P 1480 P 1710 P-9999 -9999
~
ghcnm from 14th
and 13th again
I do note also that Marion Island (off the SE coast) got added that might have cooled its own box, but this to my interpretation didn't have anywhere near the contribution of the southwest part of SA... Kigali also got added in the central part of Africa but from subjectively looking at the box before/after I don't suspect it changed the temps much either.
~
In summary, either the homogenization looks over done and/or it's too brittle when there is sparser coverage, and so retrospectively perhaps I was too overconfident in failing to hedge enough (i.e. for the scenario where if they had released data later on like Tuesday and/or even more stations happened to come in to cool i further, it might have dropped a bit further to go into the lower bin); at the very least I did not expect it could drop so much again showing I am not too skilled at predicting these minor revisions effect on the final global temp....
@parhizj Very interesting, even if no current markets are affected. Goes to show there is considerable variance these days.
Extended close date to 20th due to shutdown likely delaying data.
Both NOAA and Gistemp likely to be delayed but Copernicus has reported. 0.07C cooler than last year would suggest just 1.16 for gistemp but the data JRP reports is much more likely to be reliable I think.
https://climate.copernicus.eu/surface-air-temperature-september-2025
According to the ERA5 dataset, globally September 2025 was:
0.66°C warmer than the 1991-2020 average for September, with an absolute surface air temperature of 16.11°C.
the third-warmest September on record, a ranking similar to the previous three months (June to August), 0.27°C cooler than the record September of 2023 and only 0.07°C cooler than i September 2024.
1.47°C warmer than an estimate of the pre-industrial September average for 1850-1900.
TLDR; update for September 2025 below: besides one (Mexico) station that looks anomalous, removing it didn't change the result much for September..
~
Reviewed the GHCNm stations with my usual tools and COLIMA (MMIA) looks perhaps a bit anomalous but I could not confirm this as the ghcnd station data is incomplete as a result of the migration and the ghcnh period of record csv (.psv) is empty for it..
At the very least the internal databasees are not corresponding to what is publicly available per GHNCd/GHCNh if they are using either for GHCNm, so I have no way of verifying for sure if there is a problem with the data.
For ghcnm.v4.0.1.20251028 I reran it twice today without and with it added to the strange file.. i.e.
MXM00076658 COLIMA lat,lon 19.3 -103.6 omit: 2025/09
Looking at its nearest neighbor it is significantly warmer
it resulted in negliglble change for Sept. 2025:
using ghcnm.v4.0.1.20251028:
123.97343786784192 (with COLIMA in the dataset, i.e. without filtering it)
123.96196092872445 ( with COLIMA in the Ts.strange.v4.list.IN_full, ie. filtering it for only Sep 2025)
This is what you would expect after its already been homogenized as such by ghcnm but perhaps the original data from ghcnh is really bad but we dont know..
Thus I increased my bet for Sept.
We still haven't gotten much more stations... (see below)
~
inventory notes from the above ghcnm before the change..
Colima might be anomalous (METAR ID: MMIA)
aka ghcnm station id: MXM00076658
aka ghcnh station: MXI0000MMIA
in GHCNM inventory:
MXM00076658 19.2770 -103.5770 751.9 COLIMA 0
its neighbor for Sept 2025:
MXM00076656 19.7170 -103.4670 1515.0 CIUDAD_GUZMANJAL 30
~
Station: MXM00076658, LAT/LON: 19.28/-103.58, Value: 29.299999237060547, Anomaly: 4.23, Last30yrs -> mean: 25.90, min: 24.11, max: 27.27, std: 0.79 EXCEEDS 30-yr RANGE BY +2.03°C
Station: MXM00076656, LAT/LON: 19.72/-103.47, Value: 23.799999237060547, Anomaly: 0.44, Last30yrs -> mean: 22.07, min: 21.10, max: 24.05, std: 0.78
^^^^
closest neighbor is half mile up but 6.5 C cooler
significantly further away.. about 3 deg cooler but also at a higher altitude.....................
MXM00076556 21.4190 -104.8430 920.5 TEPIC 8
Station: MXM00076556, LAT/LON: 21.42/-104.84, Value: 26.049999237060547, Anomaly: 1.51, Last30yrs -> mean: 25.41, min: 24.48, max: 26.65, std: 0.50
ghcnm.v4.0.1.20251002:
110.803
~
@gonnarekt I lost the race, doh.
I usually have it run earlier automatically but it got killed by the kernel since I have too many other projects running and it took this long for me to manually re-run it..
~
Due to the shutdown, I don't know if we should expect any work to be continued to be done on the NCEI upgrade in progress. A week later since the last time I ran, there is still data missing from August (it is only about 5% by landbox area that is missing).
~
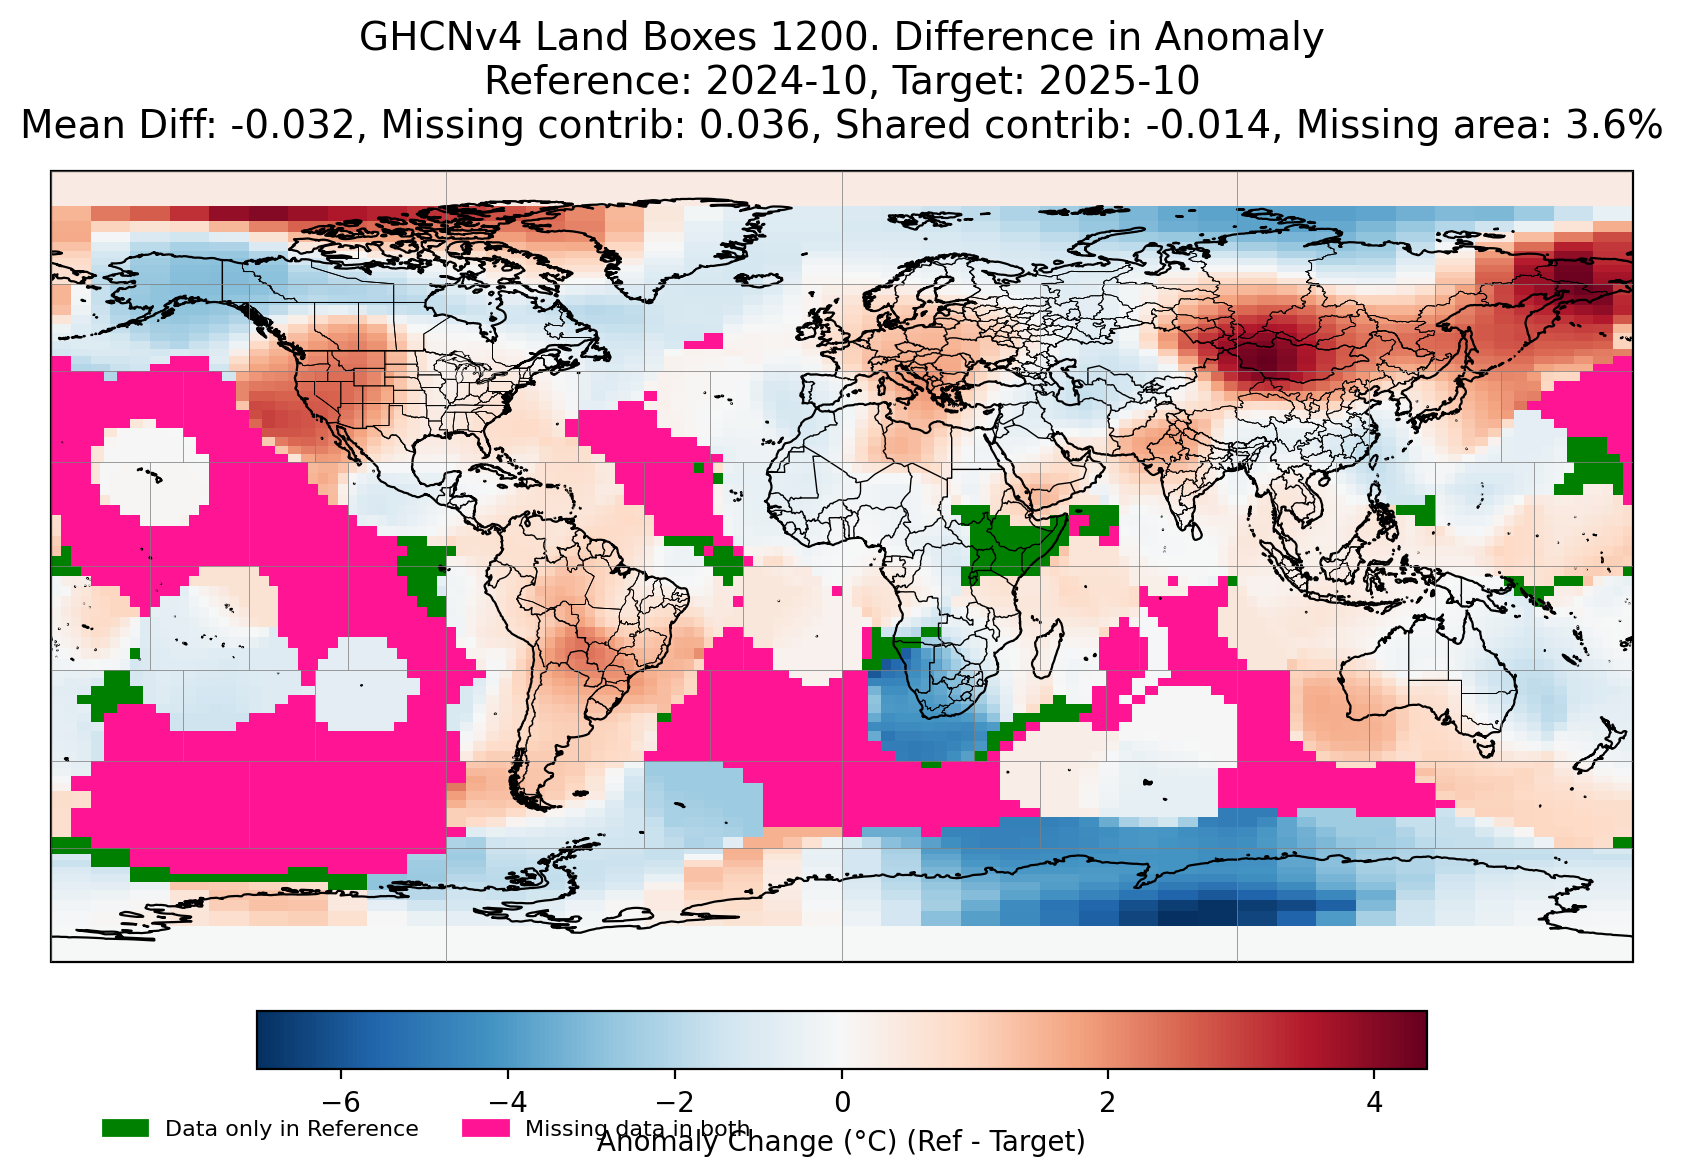
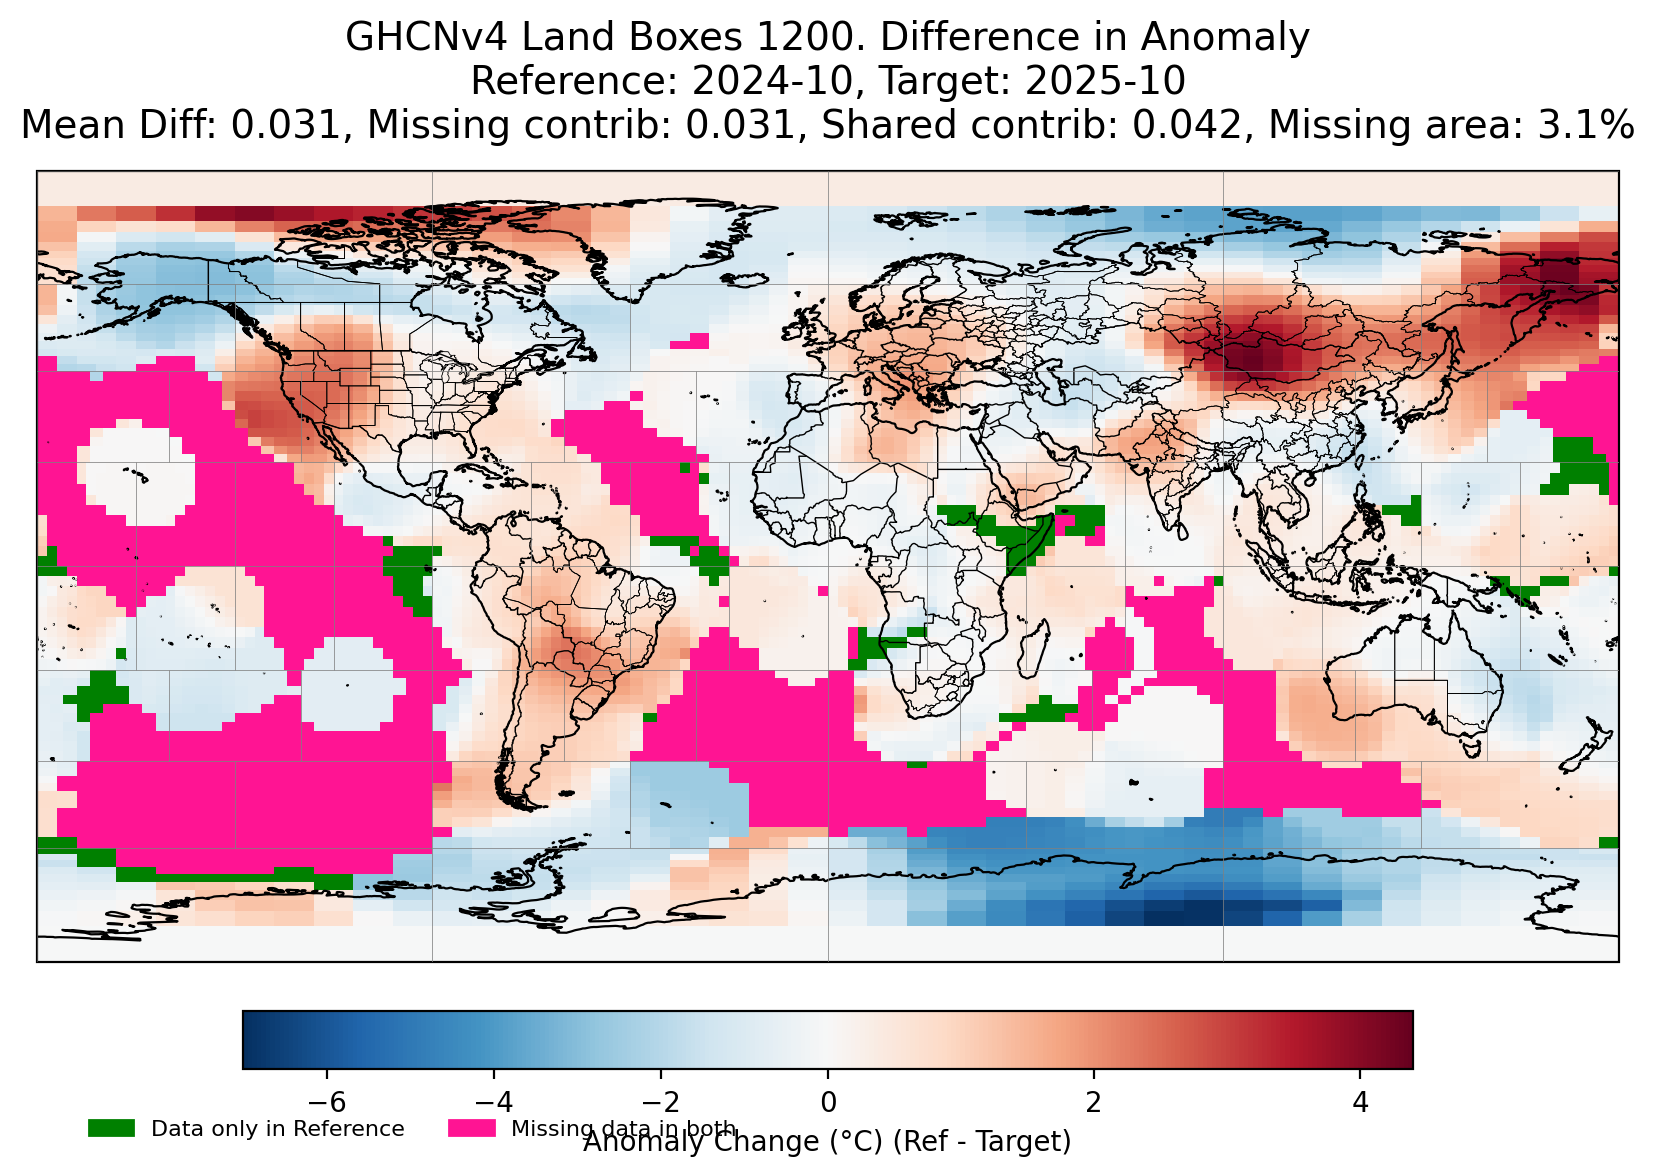
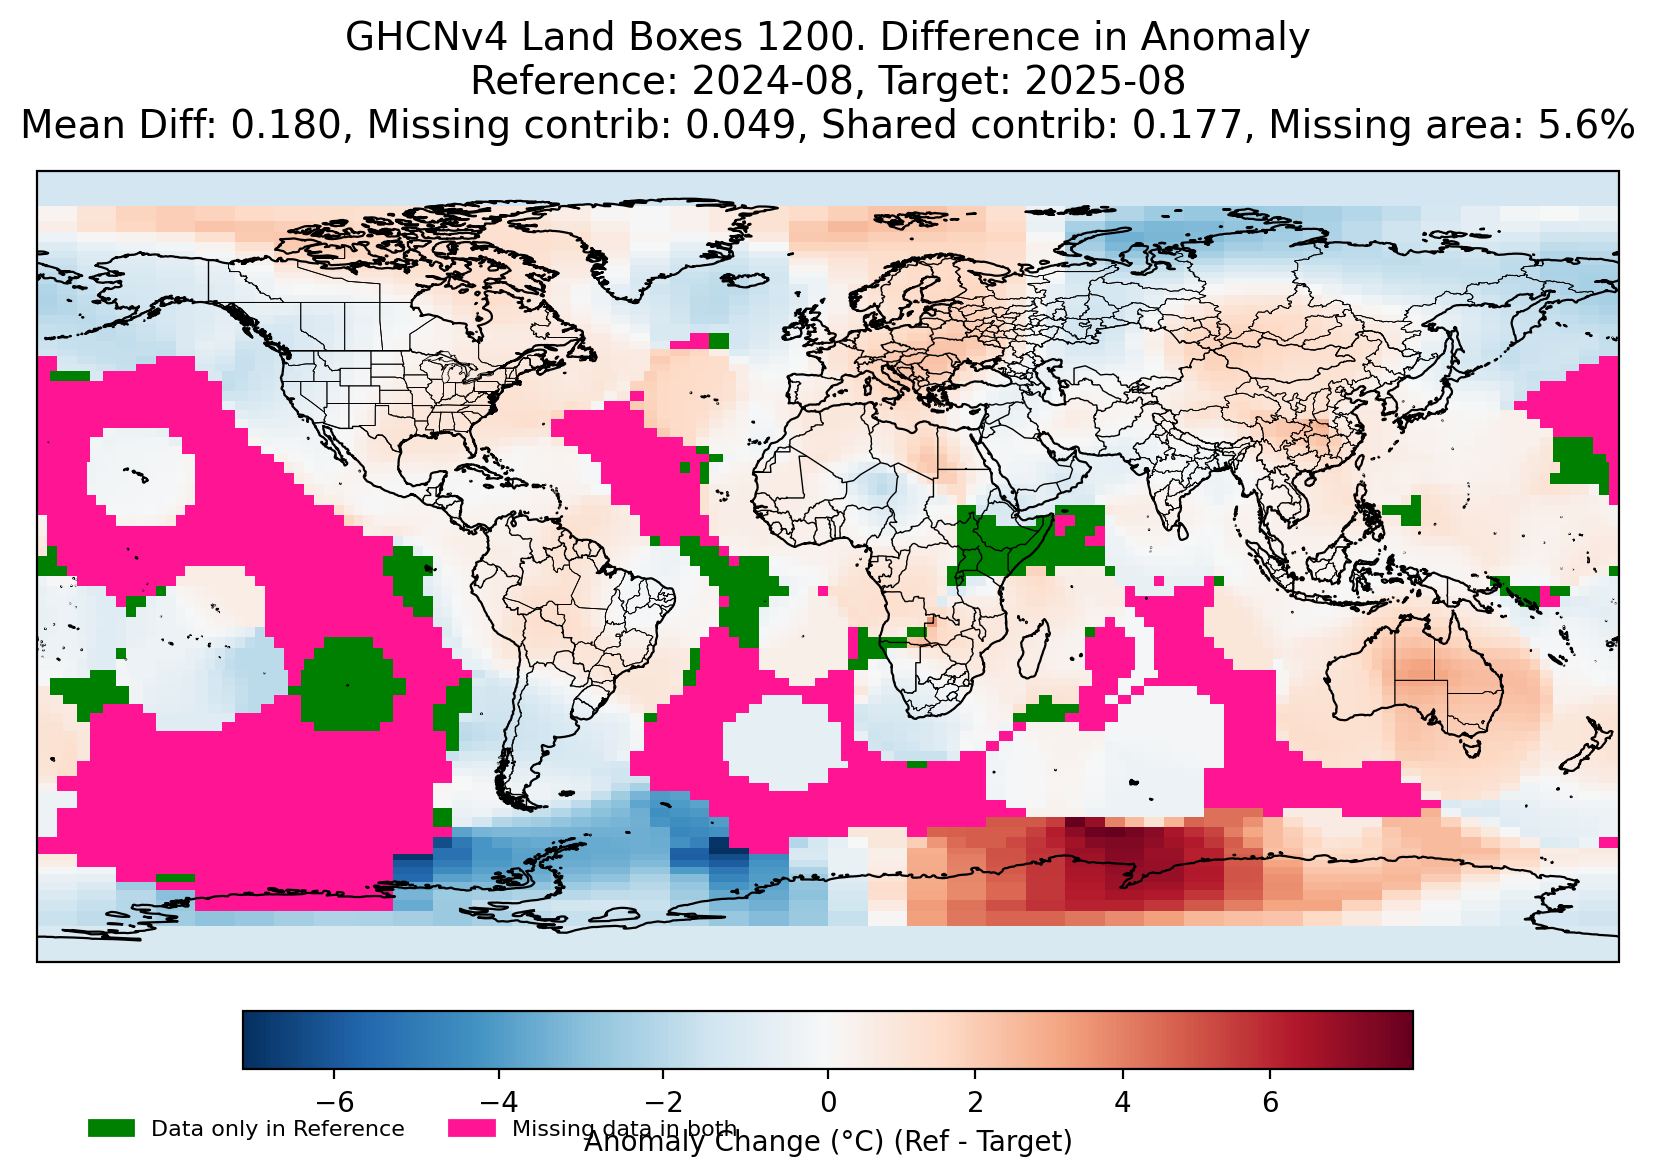
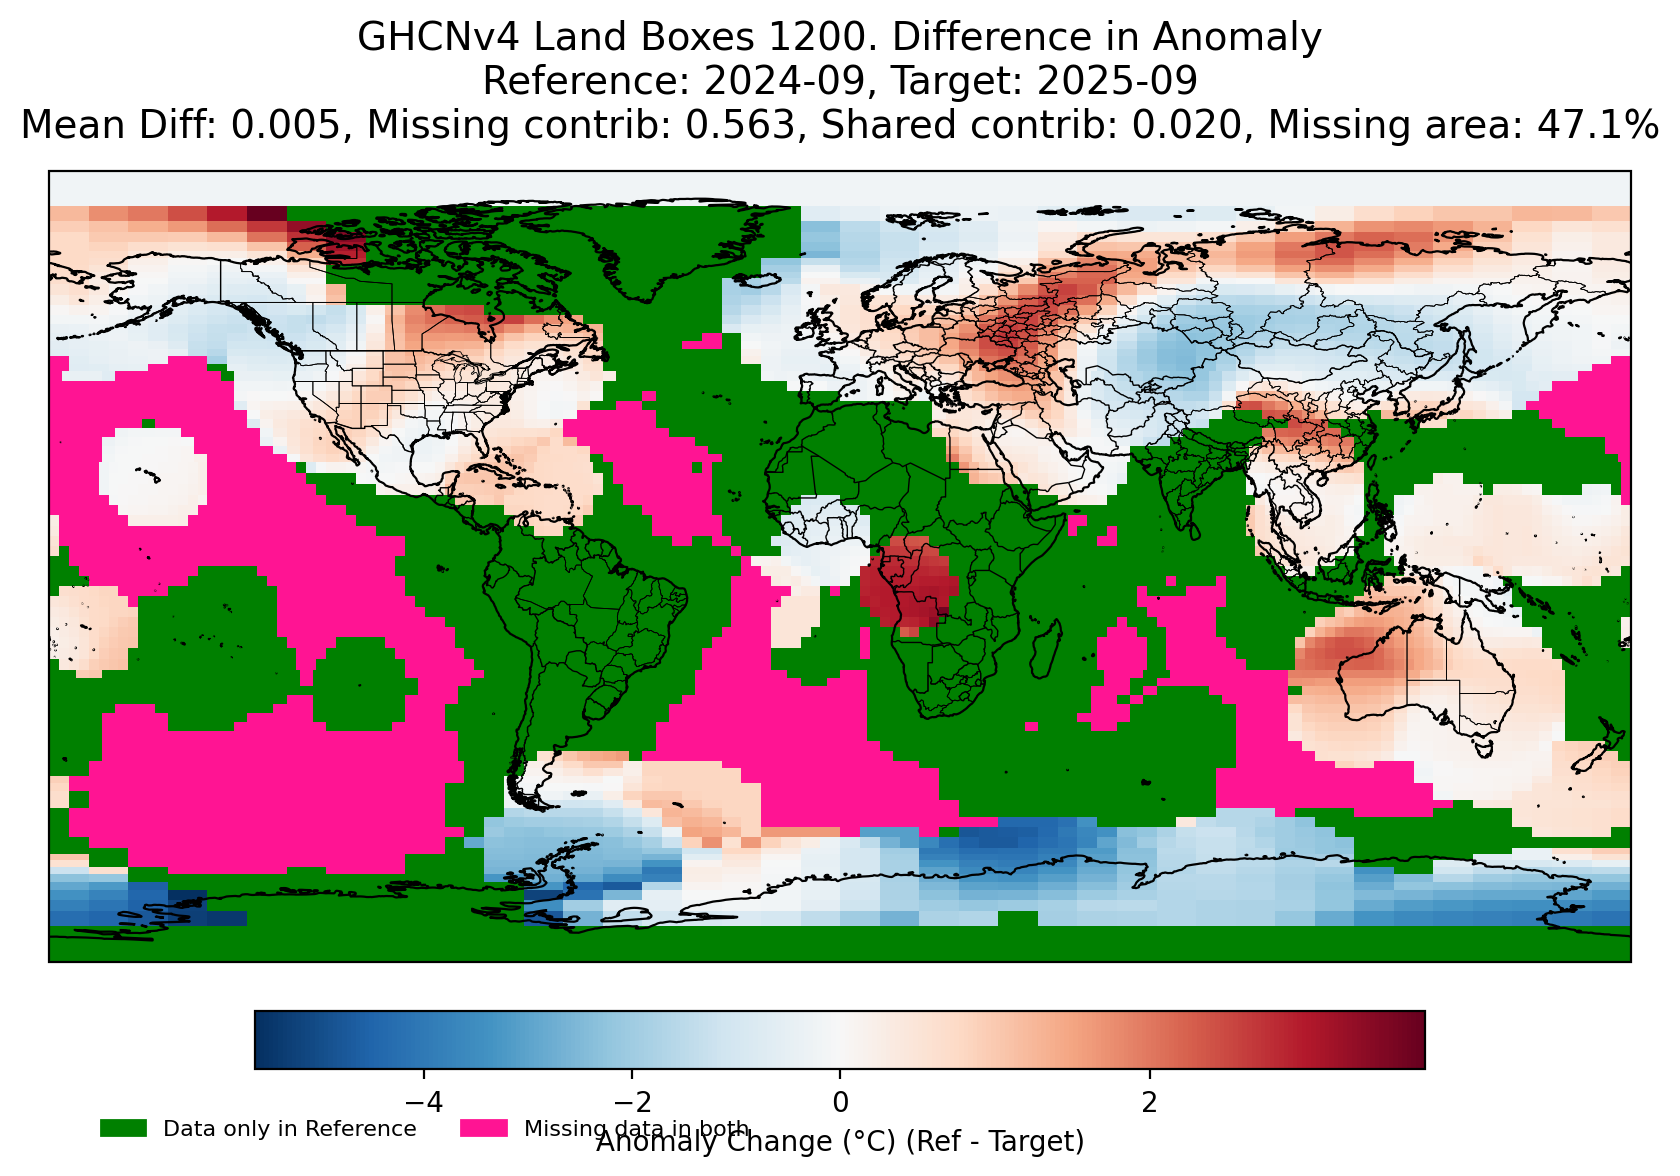
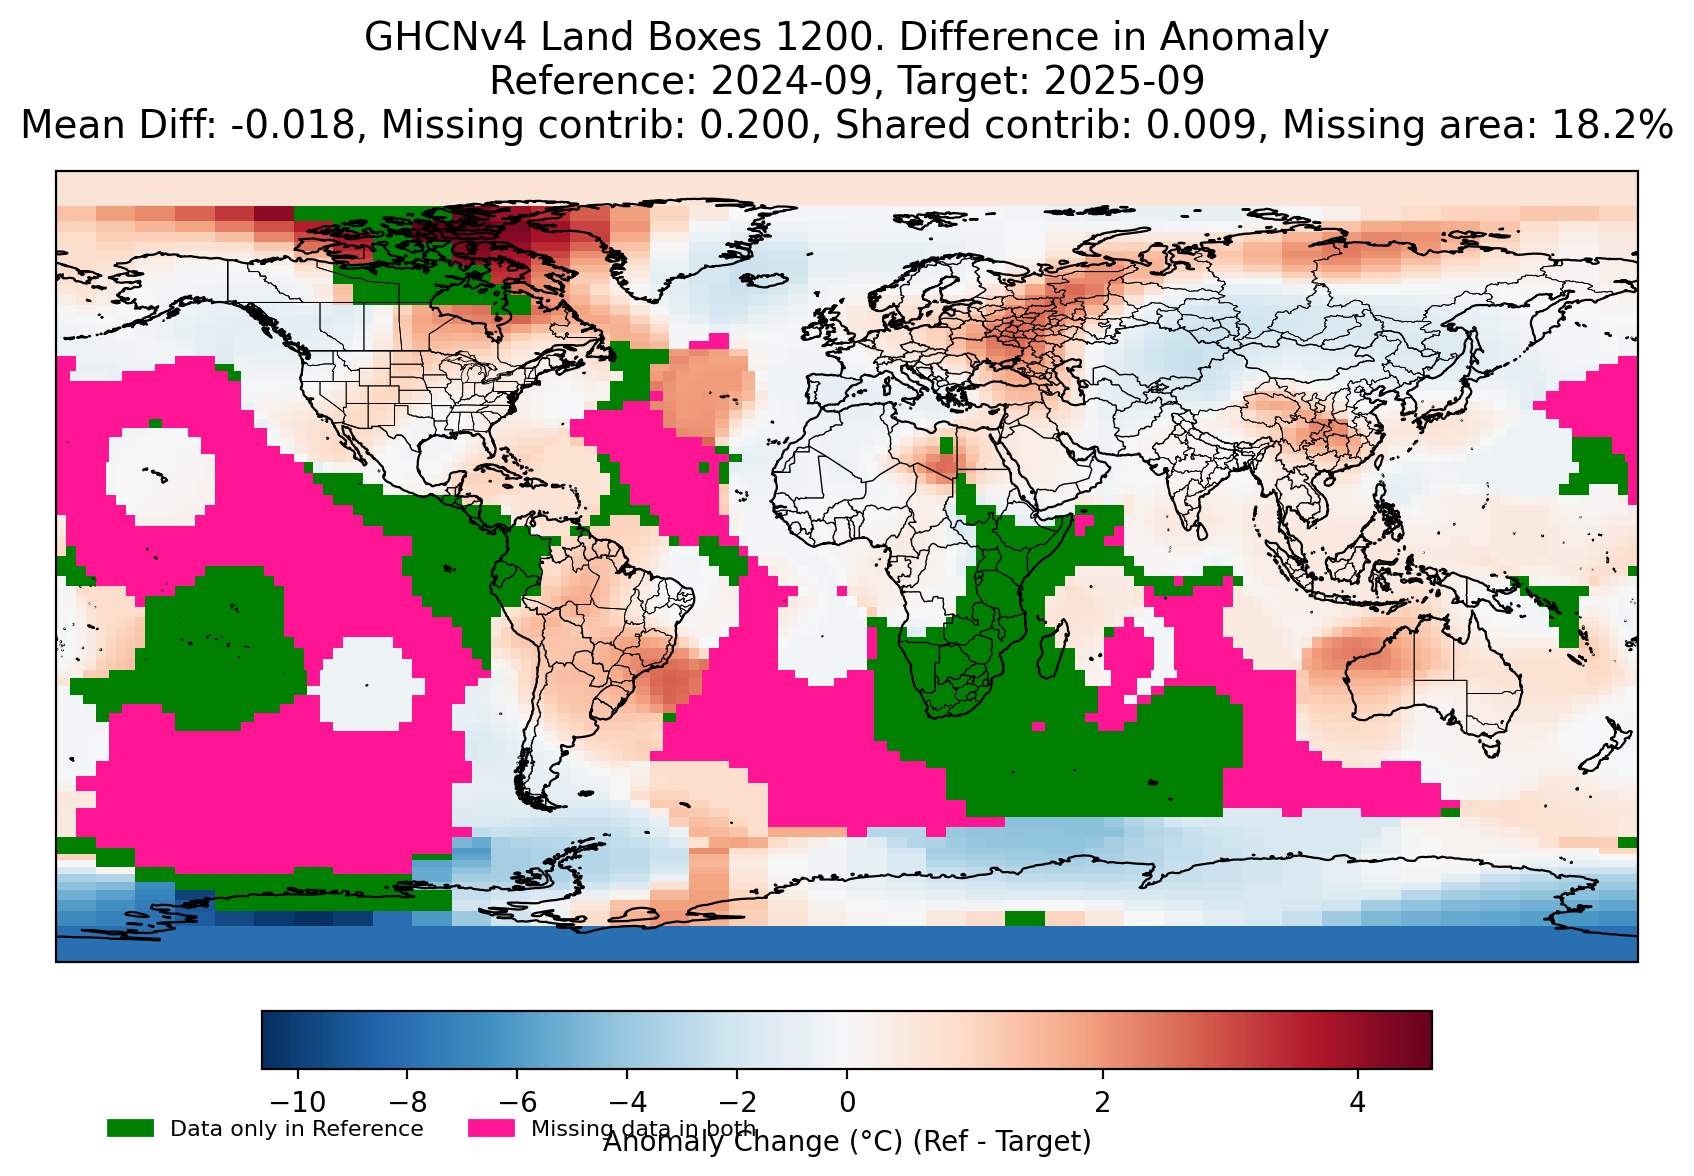
I modified the program so I could compare last year and this year for a single ghcnm dataset rather than across ghcnm runs (this gives an idea of the relative amount of data still outstanding):
So for data outstanding in the following charts, we should only pay attention to the GREEN area in charts below (which is the data only in the reference month of prior year).
And note that the anomaly is ref - target (so a cool anomaly here now in these charts means something slightly different than the previous charts, so that the Antarctic for September 2024 was colder than September 2025 -- this matches what you would expect from looking at https://climatereanalyzer.org/clim/t2_daily/?dm_id=antarctic)
Using ghcnm.v4.0.1.20251002:
110.803
August:
September:
~
Looking at climate reanalyzer charts by region, most of the anomaly in comparison to 2024 is coming from the southern hemisphere...
On one hand we might expect that all the data that came in last month will trickle in on schedule this month rather than being too delayed, but on the other hand depending on when the government shutdown ends it seems probable we will end up with a preliminary version again but with the same regions missing like last time (namely East Africa).
So, if we expect a nearly complete preliminary version, its hard to say how much warmer it will become based on past experience (when the cooling from the infilling effect from the ocean over the missing landboxes gets reduced).
The northern hemisphere is cooler also than 2024 but there is more data missing in the southern hemisphere so I still expect the temps to go up, but my updates for bets are mostly guesswork at this point while keeping in mind my ERA5 prediction until more data comes in...
~
For ERA5 final data that is now complete, from my ERA5->gistemp linear model hasn't changed:
1.183 after adjusting for own past forecast errors (1.173 without).
This looks like its going to be a bit high this month, whereas last month it was far too low.
ghcnm.v4.0.1.20251005:
118.831
~
Based on what data is left (though there may still be further revisions upward/downward with more stations coming in covering the same areas), it is hard to tell if it it will go up more (and if so how much), as though some of the Antarctica data that should push the temp up more is missing, a comparable amount of area of Canada is missing also that might push the temps down (I checked several of the stations for the cold anomaly relative to last year over nothern Canada -- it does look like it is there are several stations there still missing so it could be revised significantly (either way) if more station data comes in); given the pattern elsewhere for the data for the southern Hemisphere like over the remaining parts of Africa that we should expect data, I don't guess we should expect the temps to increase given the nearby anomalies, and if anything we should expect their contribution to decrease the temps, but its difficult to tell. I also did check some stations over northern Russia that show a cold anomaly this year but they seem legitimate given the number of stations that agree with each other.
So, all considered, if there is a increase in the next ghcnm I am guessing it will be moderate, and if anything it could decrease (but this is a speculation) -- It is close though to the next bin.
It is now very close to my ERA5->Gistemp prediction...
~ 18% of landboxes are still missing (August had about 5.6% missing).
~
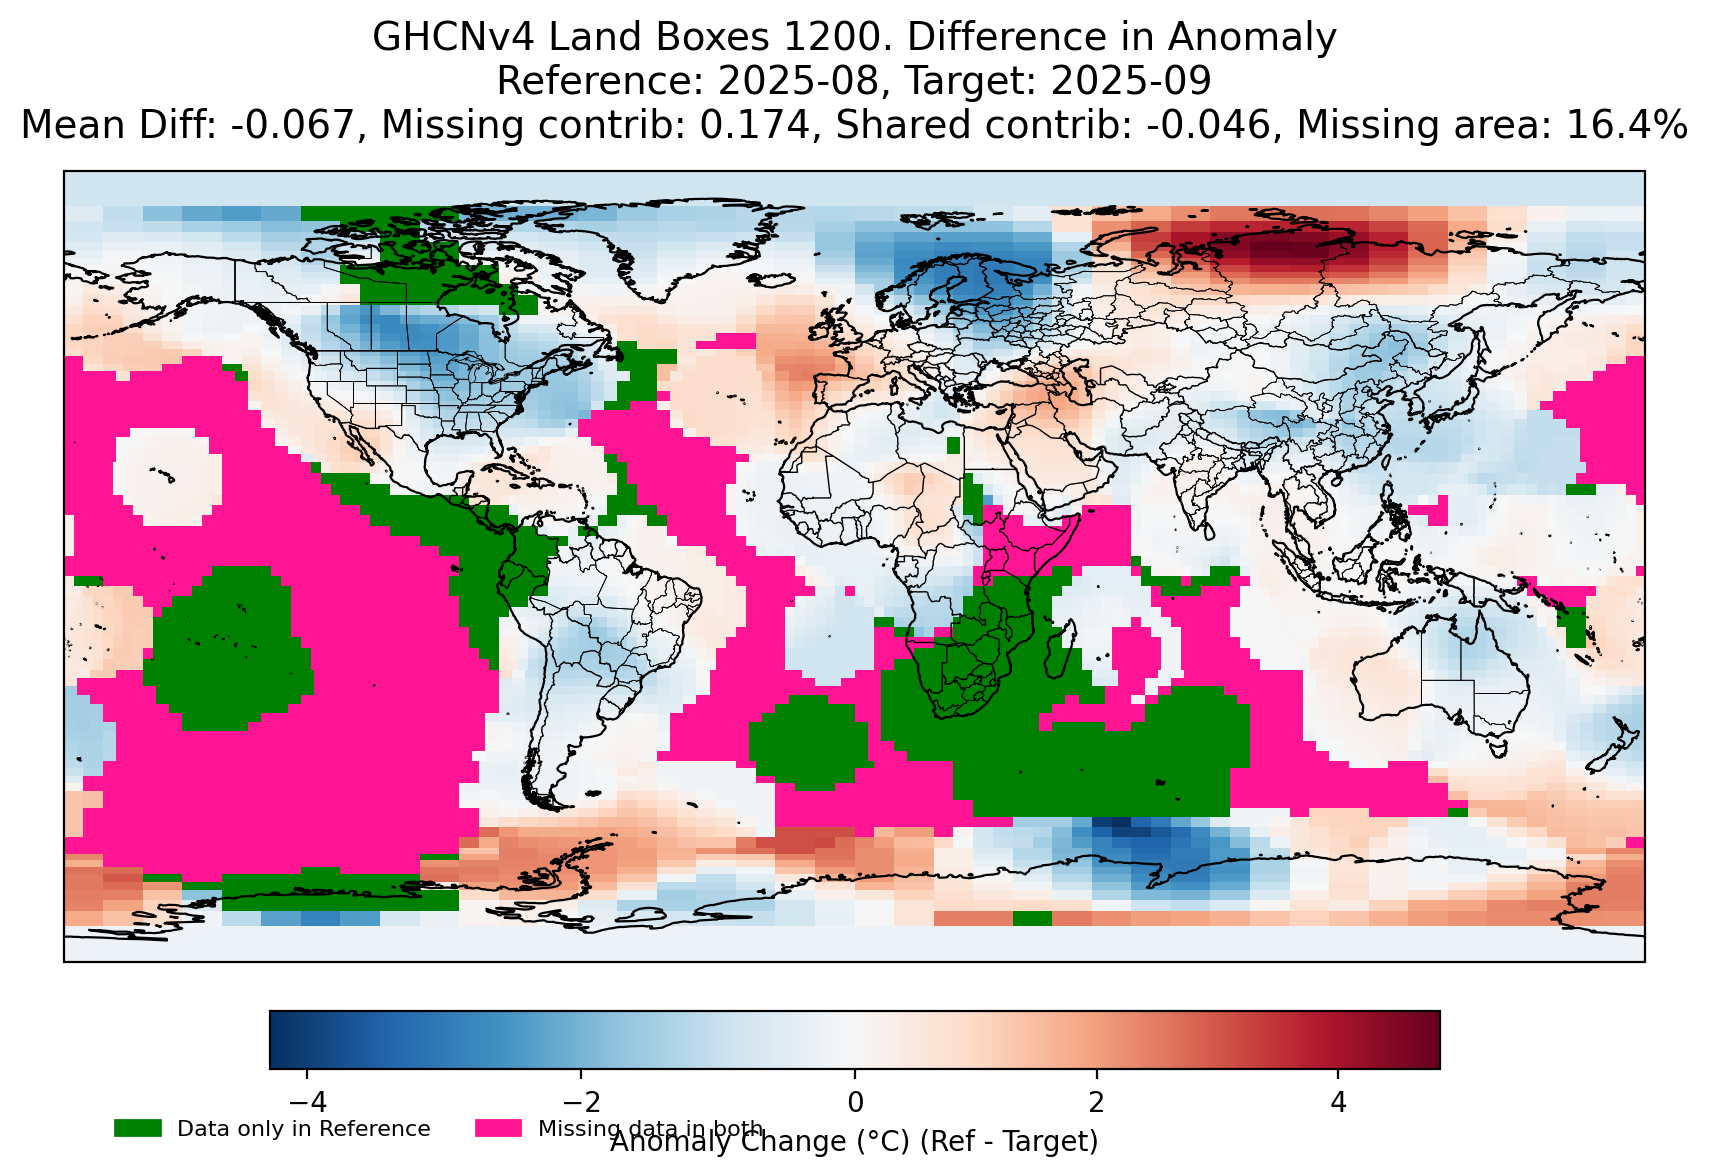
I did also compare this month and last month's anomaly (to see what areas got unusually cold -- northern Russia stands out but looks legitimate)
ghcnm.v4.0.1.20251006:
124.293
~
I was way off in my predictions, so went back to the new data this morning ...
We got data from South Africa now for September (but still not August? with the latest ghcnm update); they had a record breaking heatwave apparently, so gistemp increased, alot...
The ANOM below is just the temps for 2025 - 2024 August (value is the TAVG for August; last 30-years excludes 2025):
Top 20 HOT anomalous stations:
AYM00089332: LAT=-82.62, LON=-137.08, ANOM=11.20, VALUE=-25.20, Last30yrs -> mean: -32.51, min: -39.00, max: -23.00, std: 3.86
SF002146700: LAT=-29.67, LON=17.90, ANOM=9.30, VALUE=23.35, Last30yrs -> mean: 15.16, min: 12.08, max: 19.59, std: 1.97 EXCEEDS 30-yr RANGE BY +3.76°C
AYM00089065: LAT=-71.32, LON=-68.28, ANOM=8.75, VALUE=-8.05, Last30yrs -> mean: -13.38, min: -19.30, max: -7.65, std: 3.69
SFM00068538: LAT=-30.67, LON=24.02, ANOM=8.55, VALUE=23.90, Last30yrs -> mean: 15.37, min: 12.70, max: 18.00, std: 1.50 EXCEEDS 30-yr RANGE BY +5.90°C
AYM00089873: LAT=-83.13, LON=174.17, ANOM=7.75, VALUE=-24.75, Last30yrs -> mean: -30.68, min: -43.83, max: -20.25, std: 5.41
AYM00089868: LAT=-79.90, LON=169.98, ANOM=7.70, VALUE=-30.50, Last30yrs -> mean: -34.50, min: -44.50, max: -26.30, std: 4.09
AYM00089769: LAT=-78.47, LON=168.38, ANOM=6.45, VALUE=-26.80, Last30yrs -> mean: -29.77, min: -35.42, max: -23.45, std: 3.36
AYM00089055: LAT=-64.23, LON=-56.72, ANOM=5.80, VALUE=-9.30, Last30yrs -> mean: -10.70, min: -16.60, max: -1.90, std: 3.64
SFM00068461: LAT=-28.25, LON=28.34, ANOM=5.75, VALUE=19.45, Last30yrs -> mean: 13.94, min: 11.90, max: 16.10, std: 1.09 EXCEEDS 30-yr RANGE BY +3.35°C
AYM00088963: LAT=-63.40, LON=-56.98, ANOM=4.70, VALUE=-5.10, Last30yrs -> mean: -6.76, min: -11.25, max: 0.03, std: 3.01
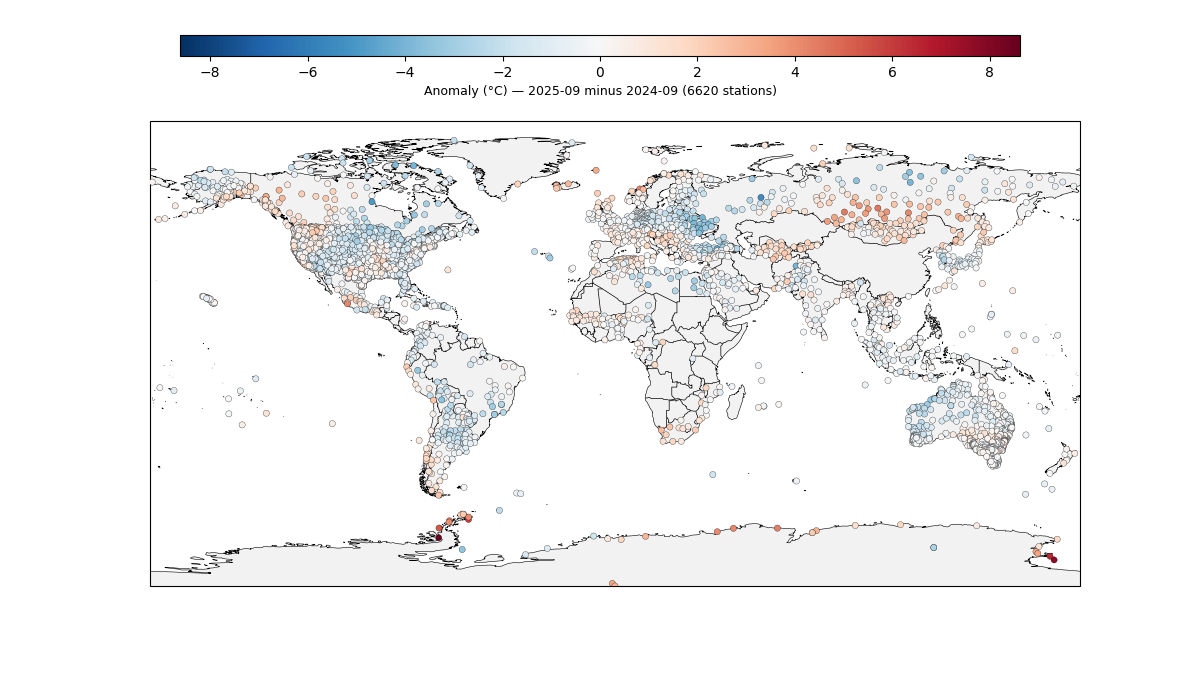
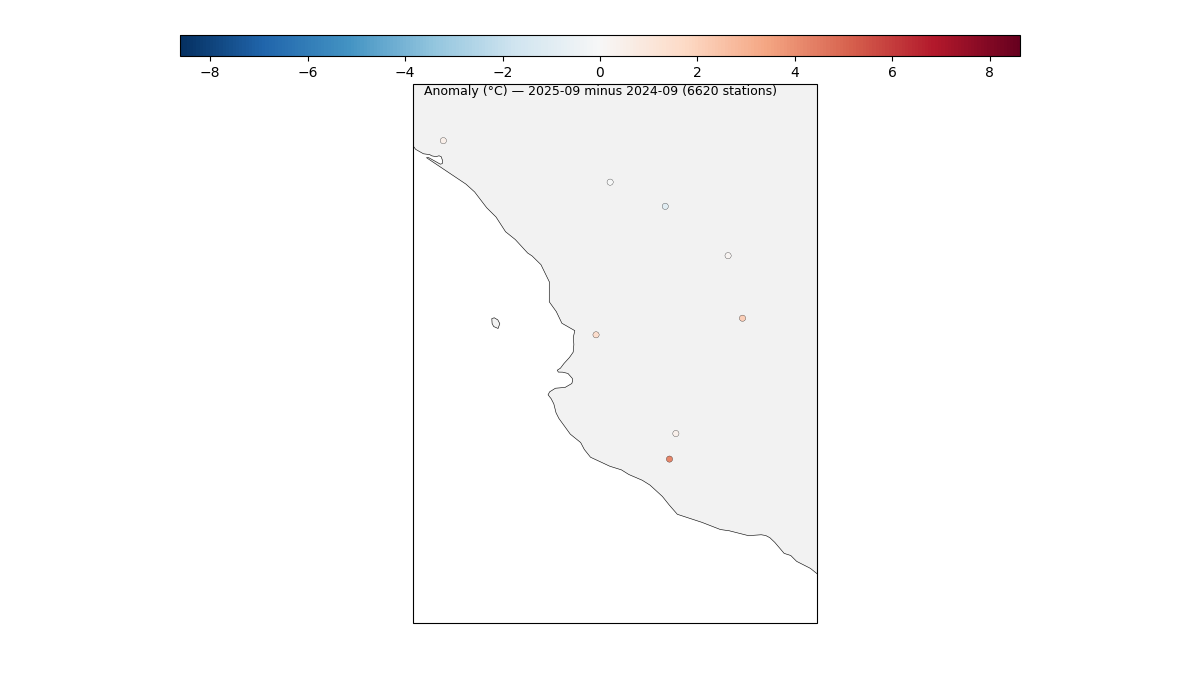
Plot of 2025-2024 for August...
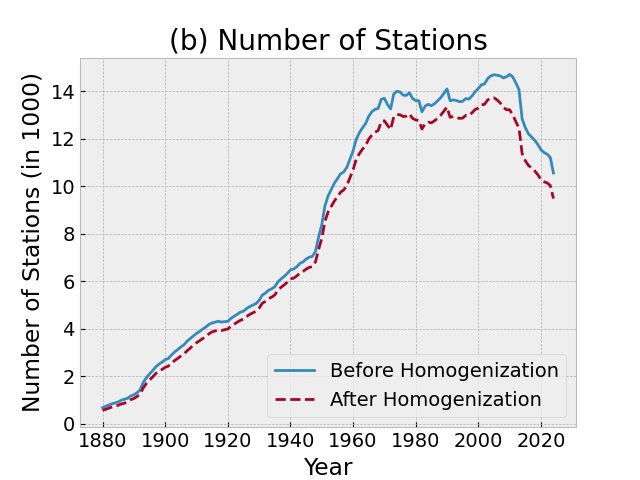
We are also still missing nearly ~ 2700+ stations (9000+ were available for July):
From (https://data.giss.nasa.gov/gistemp/station_data_v4_globe/) :
ghcnm.v4.0.1.20251007:
124.605
~
~ couple hundred more stations added since yesterday (about 94% coverage for landboxes compared to last year)
@parhizj south africa data is anomalous and will get excluded, same as last month. just nobody at hq to do the manual qcf.
@yo22 Can you be a bit more specific about which stations (there are more than one or two ghcnm stations with high temps, although not many in all), and how you came to that conclusion?
I did spend some time when I learned about the heatwave -- there is more than one station setting a record in south africa (De Aar seems the most anomalous one), so it seems unlikely that there was no heat wave...
I also looked at daily station data on weather underground for a few random stations in south africa (it's difficult to tell without using an API to collect everything comprehensively to tell how anomalous those stations are)..
https://www.wunderground.com/history/monthly/za/durban/FAVG/date/2025-9
shows ~ 20.8C as the average temperature for September; SFM00068538 was 3 C higher...
Various websites that showed indicating that there was a record heat wave in South Africa, if not exactly evenly distributed ...
(they have a very long animation for the whole year so you can see there is a heatwave)
Someone noting the heat wave in the gfs model analysis...
@parhizj i looked at 2 different global temp models and the temperatures in South Africa were higher than last year but nowhere near the temperatures GHCNm reports
other stations look fine, either they're historically inconsistent or the monthly delta is not abnormal
@yo22 thanks, but WHICH of the South Africa stations do you think are anomalous (or all of them??).
There are 5 for September, and with the exception of SFM00068461 (which is cooler from being at a higher altitude), the other four stations have a mean within 1 degree C of each other, and they all broke 30-yr records (or longer, I only checked the last 30 years), and none that seems obviously anomalous to me (highest was 2 std.dev) :
Station: SF002146700, LAT/LON: -29.67/17.90, Value: 23.350000381469727, Anomaly: 9.30, Last30yrs -> mean: 15.16, min: 12.08, max: 19.59, std: 1.97 EXCEEDS 30-yr RANGE BY +3.76°C
Station: SFM00068538, LAT/LON: -30.67/24.02, Value: 23.899999618530273, Anomaly: 8.55, Last30yrs -> mean: 15.37, min: 12.70, max: 18.00, std: 1.50 EXCEEDS 30-yr RANGE BY +5.90°C
Station: SFM00068461, LAT/LON: -28.25/28.34, Value: 19.450000762939453, Anomaly: 5.75, Last30yrs -> mean: 13.91, min: 11.90, max: 16.10, std: 1.10 EXCEEDS 30-yr RANGE BY +3.35°C
Station: SFM00068242, LAT/LON: -25.80/25.55, Value: 23.549999237060547, Anomaly: 3.50, Last30yrs -> mean: 19.61, min: 16.25, max: 21.95, std: 1.20 EXCEEDS 30-yr RANGE BY +1.60°C
Station: SFM00068174, LAT/LON: -23.87/29.45, Value: 22.850000381469727, Anomaly: 3.75, Last30yrs -> mean: 19.09, min: 17.49, max: 21.04, std: 0.89 EXCEEDS 30-yr RANGE BY +1.81°C
from v4.inv:
SF002146700 -29.6670 17.9000 1007.0 SPRINGBOK 10
SFM00068538 -30.6670 24.0170 1287.0 DEAARUA 12
SFM00068461 -28.2480 28.3360 1695.0 BETHLEHEM 22
SFM00068242 -25.7980 25.5480 1274.4 MAFIKENG 0
SFM00068174 -23.8670 29.4500 1224.0 POLOKWANE 29
~
I don't know though how well the global models would show these extreme forecast events for various reasons... (6 hour points might miss the daily max) ...
As far as I know this is what they use for reference for QC: (from the docs)
Step 1: Under the control of a configuration file, various stations and periods of station records
        are discarded.  The list of these suspected outliers is partially a holdover from applying
        the QC methods described in Hansen et al 1999 documents, or are the results of visual
        inspections of recent anomaly maps and comparing the visual outliers to reports of other
        sources like weather underground.
Manual QC methods are also listed in the 1999 paper which uses a higher threshold requirement (this 2 std. dev over last 30 years doesn't seem to meet the "obvious" requirement") given the number of nearby stations breaking records? (They seem to use a much more stringent 5 sigma for individual points like the above, but they also use 10 year periods which I didn't check....
"
A first quality check was to flag all monthly data that differed more than five standard deviations (5s) from the long-term mean for that month, unless one of the nearest five neighboring stations had an anomaly of the same sign for the same month that was at least half as large. Data were also flagged if the record had a jump discontinuity, specifically if the means for two 10 year periods differed by more than 3s. A third flag was designed to catch clumps of bad data that occasionally occur, usually at the beginning of a record; specifically, a station record was flagged if it contained 10 or more months within a 20 year period that differed from the long-term mean by more than 3s. All flagged data were graphically displayed along with neighboring stations that contained data during the period in question, and a subjective decision was made as to whether the apparent discontinuity was flawed data or a potentially real climate anomaly. The philosophy was that if the data were not quite obviously flawed, it was retained. Only a very small portion of the original data was deleted: approximately 20 station records were deleted entirely, in approximately 90 cases the early part of the record was deleted, in five cases a segment of 2-10 years was deleted from the record, and approximately 20 individual station months were deleted
"
from https://www.giss.nasa.gov/pubs/docs/1999/1999_Hansen_ha03200f.pdf
~
ghcnm.v4.0.1.20251009:
124.404
Probably will stop posting these updates until the government shutdown ends ...
@parhizj if you look at the history a lot of SF stations have a Q flag assigned to them, the value is likely manually changed. i'd say 3 of them will be set to -9999 and the two most-west and most-south will have their value reduced manually.
i think you're overanalyzing it, if you look at average land temps using i.e. era5-land, you'll see a hot spot over South Africa but its only 2c higher than last year at most.
edit: era5 is an hourly product, extremely accurate. you can look at jra's ensemble mean too, it shows the same data
i believe the only reason it hasn't been excluded yet (as it did last month) is because there is nobody in office to do it this month. the only question we have here is whether NASA will run the algorithm after the adjustments had been made or before
if you look at the PHA algorithm it has input files such as "stations to exclude", this is likely where the manual edits come in - that weren't possible this month yet
@yo22 what Q means…
Q GHCND Data from several African countries that had been "quarantined",
that is, withheld from public releaseuntil permission was granted
from the respective meteorological services
@parhizj that's the source flag not quality flag
edit: https://www.ncei.noaa.gov/pub/data/ghcn/v4/readme.txt
also doesnt appear in the q flag section, hence i think its manual
@yo22 I looked through the ghcnm source code.
It seems it just refers to data that was set as missing as it had QC flags that was either raw temp data or had sime time observation bias; it's not a manual adjustment issue as you suggested -- all those data are marked missing (-9999)
else if(PROC ~ "WMs")
{
if(mflg != "T") {mflg = tolower(mflg)}
# ANY non-blank QC flag data and it is not == X then this is
# RAW or TOB data for the QCF and should be set to missing
if(qflg != " " )
{
if(qflg != "X")
{
rdata = amiss
qflg = "Q"
}
}
@parhizj my best bet is its going to be fully excluded then, and gistemp will run later in the month or possibly next month. excluding south africa brings it down to 1.19-1.2, including more of Mexico bumps it up to 1.21-1.22
ghcnm.v4.0.1.20251014:
122.033
@yo22 You were correct on the Africa stations being too high, but it's still not at all likely to me it will end up in the lower bucket still for a preliminary report, despite trending downwards, especially given the below...
One of the 5 South Africa stations data for September has been removed (SFM00068538).
The other 4 have been adjusted downwards (likely as a result of homogenization now that more nearby stations have come in -- there is no manual adjustment flag for them).

As far as coverage -- still missing some of East Afirica (comparable to the preliminary from last time), and to a lesser degree some small boxes of South Africa, and some scattered boxes (islands), when comparing this year to last year (green is missing):

Preliminary ERA5 for 09-30 came in.
I'm getting 1.187 C for a point prediction after all adjustments (1.173 without a final adjustment on own past prediction errors) (shouldn't change change much tomorrow).
Edit: ~ deleted
From the GISTEMP website:
News and Updates
October 1, 2025: Due to the lapse in federal government funding, NASA is not updating this website. We sincerely regret this inconvenience.
~
On to of lack of data for a full release, now looks like from this market, Manifold is predicting there won't even be a preliminary release near the planned date as the government shutdown is going to last 10-15 days...
@parhizj Those workers also don't get paid during this time. They will instead be given back-dated pay when the shutdown is over.
So not paid on time but will be paid AFAIK
But the politicians keep getting paid. Who thinks it should be other way around?
@ChristopherRandles imho, congress can get paid once they start working more than half the days of the year…