Data is currently at
https://data.giss.nasa.gov/gistemp/tabledata_v4/GLB.Ts+dSST.csv
or
https://data.giss.nasa.gov/gistemp/tabledata_v4/GLB.Ts+dSST.txt
(or such updated location for this Gistemp v4 LOTI data)
January 2024 might show as 124 in hundredths of a degree C, this is +1.24C above the 1951-1980 base period. If it shows as 1.22 then it is in degrees i.e. 1.22C. Same logic/interpretation as this will be applied.
If the version or base period changes then I will consult with traders over what is best way for any such change to have least effect on betting positions or consider N/A if it is unclear what the sensible least effect resolution should be.
Numbers expected to be displayed to hundredth of a degree. The extra digit used here is to ensure understanding that +1.20C resolves to an exceed 1.195C option.
Resolves per first update seen by me or posted as long, as there is no reason to think data shown is significantly in error. If there is reason to think there may be an error then resolution will be delayed at least 24 hours. Minor later update should not cause a need to re-resolve.
 1,000
1,000🏅 Top traders
| # | Name | Total profit |
|---|---|---|
| 1 | Ṁ545 | |
| 2 | Ṁ225 | |
| 3 | Ṁ161 | |
| 4 | Ṁ84 | |
| 5 | Ṁ32 |
People are also trading
News from the GISTEMP home page:
"
News and Updates
November 12, 2025: As we return to normal operations, we hope to post the October GISTEMP analysis either this Friday, Nov. 14, or next Monday, Nov. 17.
"
Presumably the September numbers will just come along with it rather than prior?
The release date is slightly a bit more optimistic than I predicted earlier so I've increased my bet for October given that they may even use the ghcnm for last night even to do the analysis tomorrow, they still have the September analysis to do first... Either way I don't predict a large amount of stations being added between now and Sunday, but there are still those Central and East Africa stations missing that could come in and warm October up a tiny bit (but not enough presumably to leave the bin).
~
Latest ghcnm seems to have only added a single station (Jamaica) so no need to update on this data.
Different dataset but while shutdown continues, maybe this is of interest:
https://climate.copernicus.eu/climate-bulletin
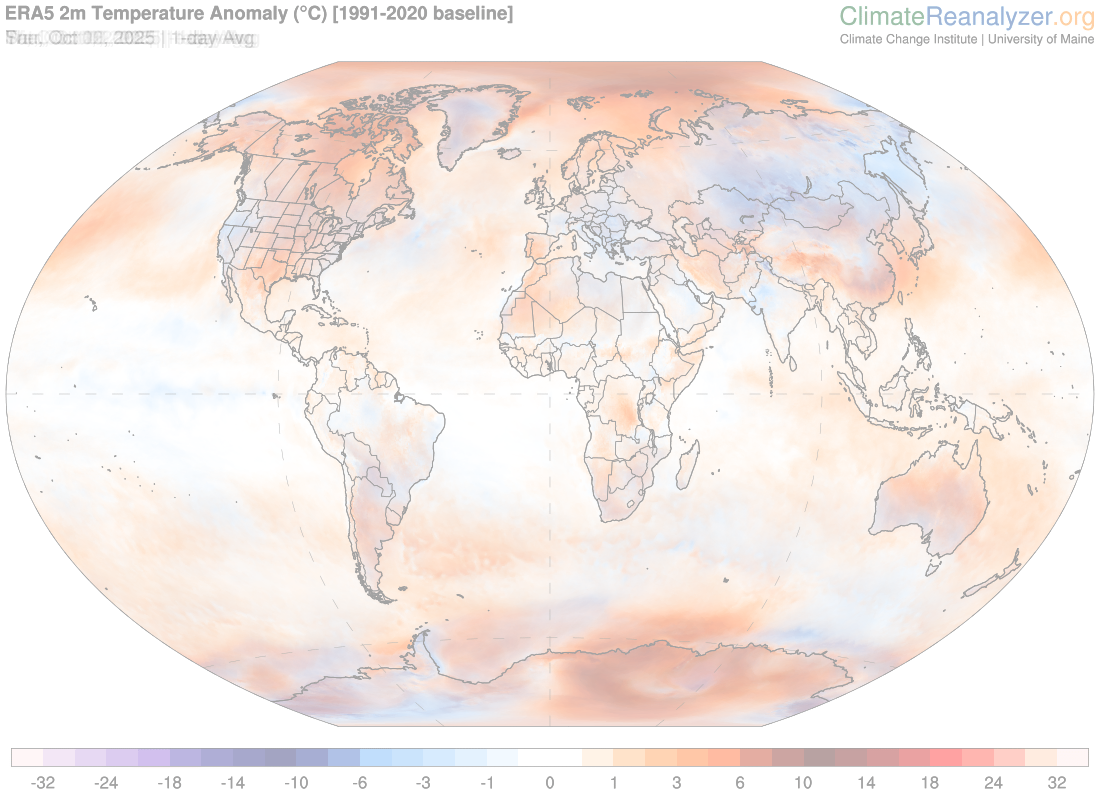
October 2025 was the third-warmest October globally, with an average surface air temperature of 15.14°C, 0.70°C above the 1991-2020 average for October.
October 2025 was 1.55°C above the estimated 1850-1900 average used to define the pre-industrial level, the first month above 1.50°C since April 2025.
https://climate.copernicus.eu/surface-air-temperature-october-2025
According to the ERA5 dataset, globally October 2025 was:0.70°C warmer than the 1991-2020 average for October, with an absolute surface air temperature of 15.14°C.
the third-warmest October on record, 0.16°C cooler than the record October of 2023 and only 0.11°C cooler than October 2024.
1.55°C warmer than an estimate of the pre-industrial October average for 1850-1900.
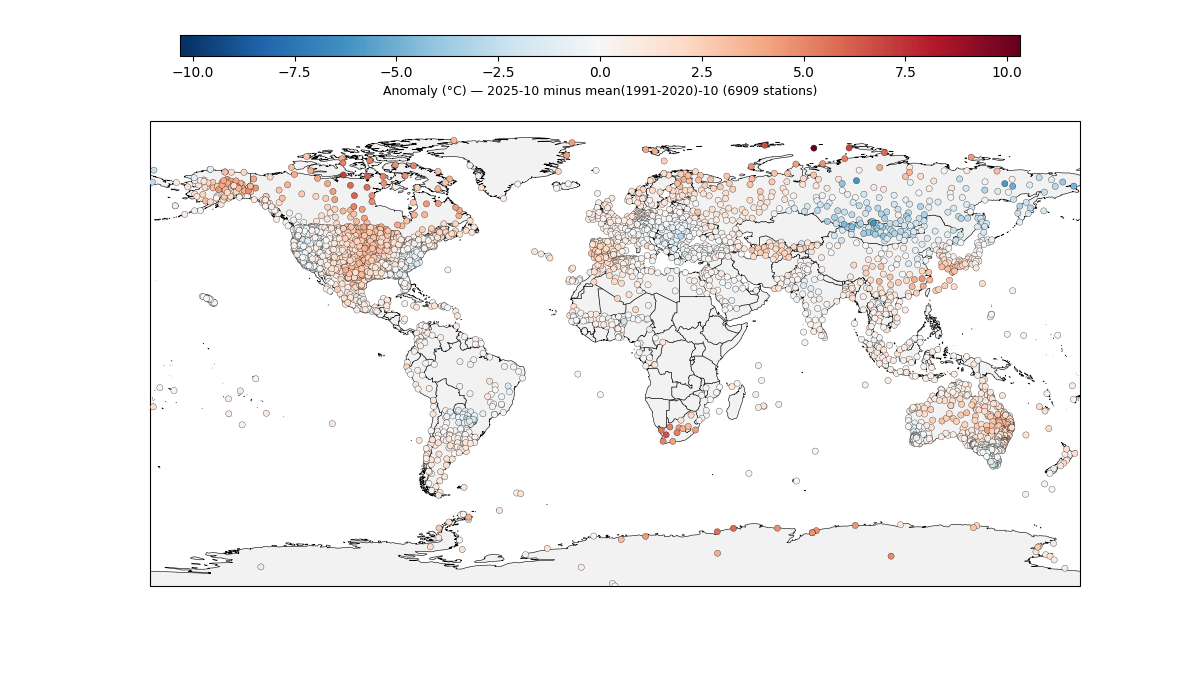
With latest gistemp October 2024 was 1.3378 and October 2025 is now 1.2388, so that 0.11 drop in ERA5 roughly matches GISTEMP (-0.099).
Edit: With the exception of Greenland and South Africa the anomalies seem to line up (for ghcnm).
South Africa does look warmer though. But we also don't yet have more of its data (more around the center of Africa) so I do expect it to drop a bit when more data comes in...
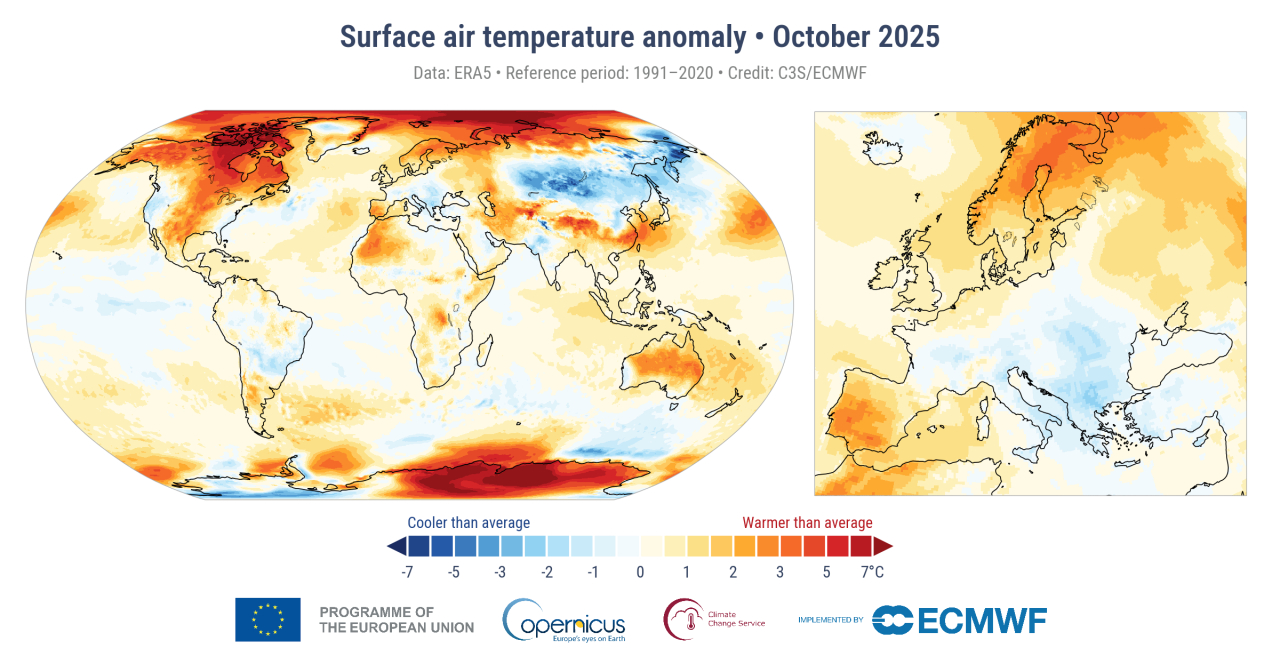

"In the Arctic, this was particularly the case over the Canadian archipelago, around Baffin Bay and over the central Arctic Ocean, where anomalies were more than 8°C above average. The same Arctic sector experienced much-below-average sea ice cover. Most of Eastern Antarctica saw much-warmer-than-average temperatures, with large regions seeing values also more than 8°C above average."
quite notable!
@parhizj maybe someone could do an arctic sea ice max market. Definitely had a big slowdown there.
ghcnm.v4.0.1.20251107:
123.12
~
About 300 more stations added
As far as gross coverage still missing parts of Africa... I've added the gistemp boxes to get an idea of how it will end up infilling (the 80 boxes)...
Quite a bit is being infilled though in south and east Africa from missing stations, but we do have Kigali from September so I suppose we should expect it for October too but looking at the ERA5 chart it looks mildly warm in terms of anomaly so even if it effects the two boxes if it alone comes in I don't expect a significant increase based on what they are already being infilled with, and if more Southern and Eastern Africa stations come in it those two boxes may come down.
Still only have roughly a bit more than 2/3 of the stations we had last year but based on expectations for a preliminary report in a few weeks (assuming the government opens in November) than I don't expect any further large suprises beyond what we already have (September by comparison is at ~3% missing area; and we have 300-400 or so less stations at the moment for October).
~
As for how I could be off, there could a single stations that come in particularly anomalously hot that has subboxes currently being infilled particularly on the cold side, i.e. for east Antarctica closer to the pole (i.e. AYM00089799 which we don't have data for yet) that throws my guess off and makes the subboxes (and potentially multiple boxes) even more anomalously hot, but its difficult to see how much higher that could raise it alone ...
Ideally this type of guess work might be better suited by doing some sensitivity analysis using what outstanding station data we lack and filling it in with ERA5 points using a few different random sets of different stations and rerunning gistemp a few times over them -- I don't have time for this though.
~
@ScottSupak I didn't want to rely on US sources since for all we know we might end up in another shutdown and have no data available, so I made one using sea ice extent with VISHOP as the source. Note its the month mean as I think it is more meaningful than the noisy daily maximum.
@parhizj the biggest surprise was China inclusion in the GHCNm, if exluded my prediction was spot on. i wonder if it'll continue to be included - and what caused the sudden lack of data, dropping from 10k to 6k stations is very significant, it looks like we're on the right track to 7-8k stations being used
@Rhhgdd I don't know how they're doing the migration but the September data for China is still missing. Considering the number of stations for September has in fact increased from a weeks ago I can only wildly speculate based on an image of my head of how they might be doing it -- i.e. a lot of now past data needs to be migrated somewhat by hand while they continue to work on the more automatic parts, and this is perhaps why we see China for October but not September? This assumes though that even the government is shutdown I think its possible they might still be working on the migration., so it still seems to me hard to tell what data we shouldn't expect beyond what stations we already got for September earlier on.
As final era5 came in, I get...
1.230 C after all adjustments (1.215 C without adjustment from own past errors)
new ersst came in earlier, but the ghncm from last night has no stations in s.hem. so expect it to rise... as of now its fairly useless
I probably won't post updates like I used to until a lot more data comes in...
ghcnm.v4.0.1.20251102:
106.97
@Rhhgdd 🤷 What the max is I don't know... I just know the ghcnm data is still far too sparse for the S. Hem. to be useful
@Rhhgdd Still alot missing and I guess we already have the largest cold contribution we're going to get (Mongolia) so we could be very biased so far, but it does appear slightly less plausible now given we have gotten a tiny bit more data, but not nearly enough for me to update yet beyond what the market is already at...
Speculating and without referencing any other data, based on what's been infilled and what's missing, Alaska indicates Canada could bring it up further (too much has been infilled for it and Greenland). And based on last month, so should South Africa... I don't know if its enough though to bring it up to 1.195 though.
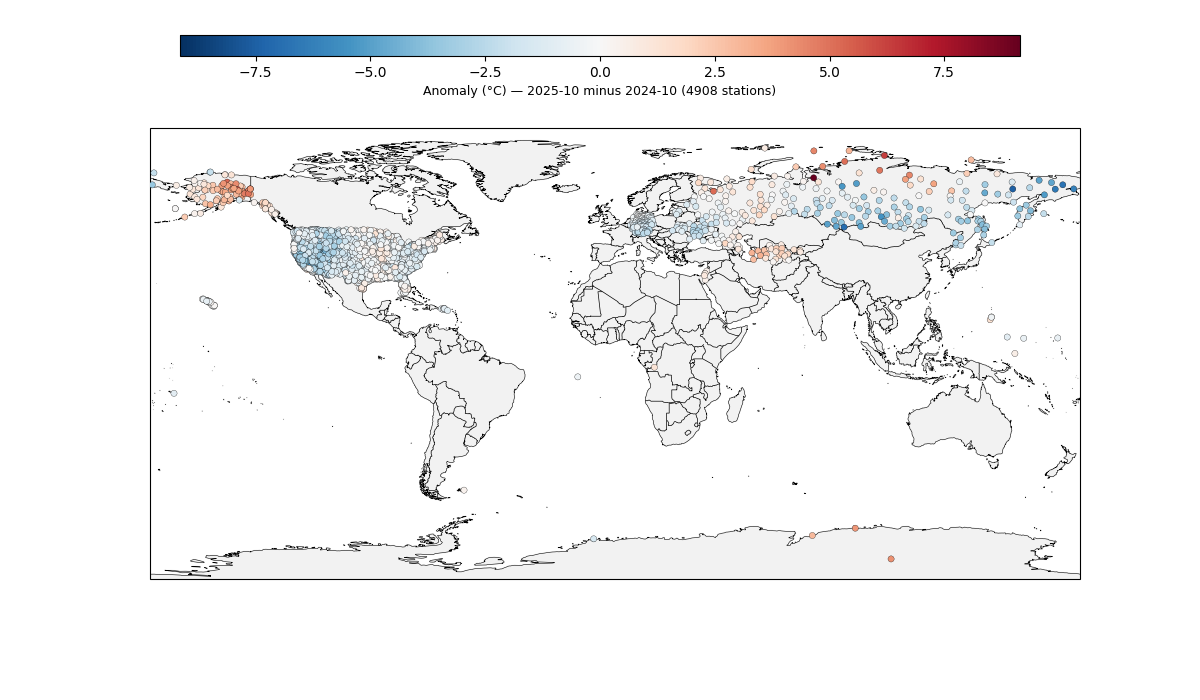
We got quite a bit more data in (i.e. Australia and South America), enough so its worthwhile to post an update (dropping down from roughly 39% to 12% missing landbox area):
ghcnm.v4.0.1.20251105:
116.95
Lazily, In order to see what to expect, I grabbed the daily temps from climate analyzer (Oct. 1 - Oct 30) and put them together to see what to expect...
Also modified the reference code plotting for stations to use a reference range (same as above) to get a comparable image (rather than just use last year)
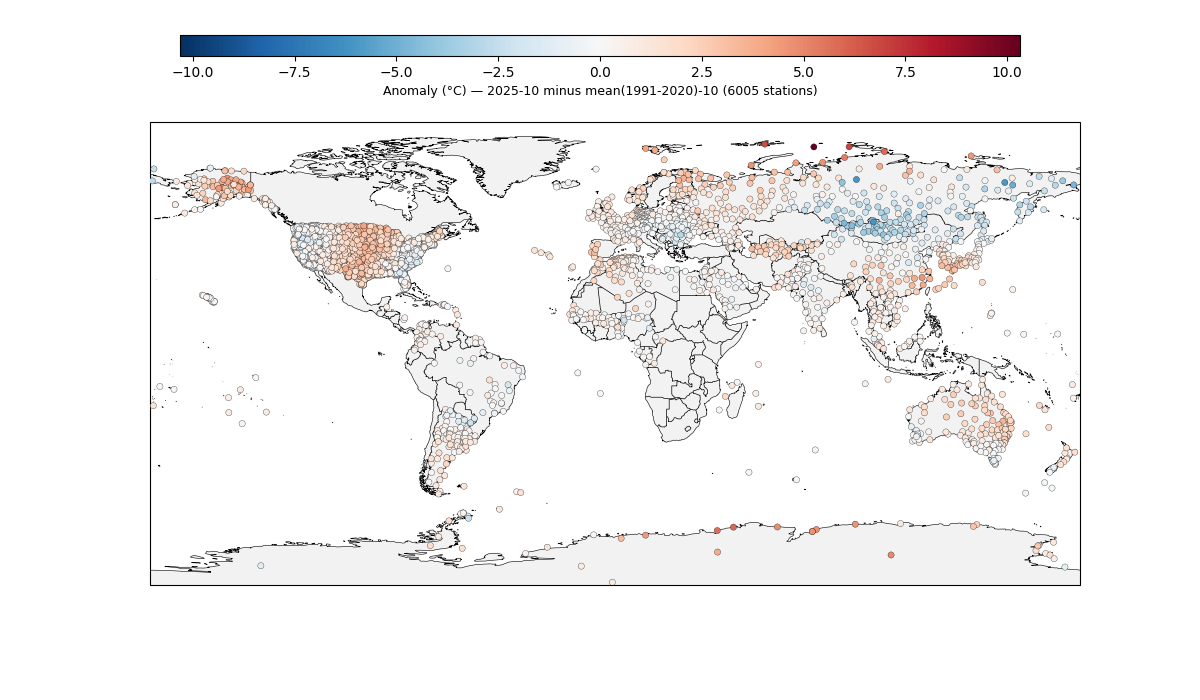
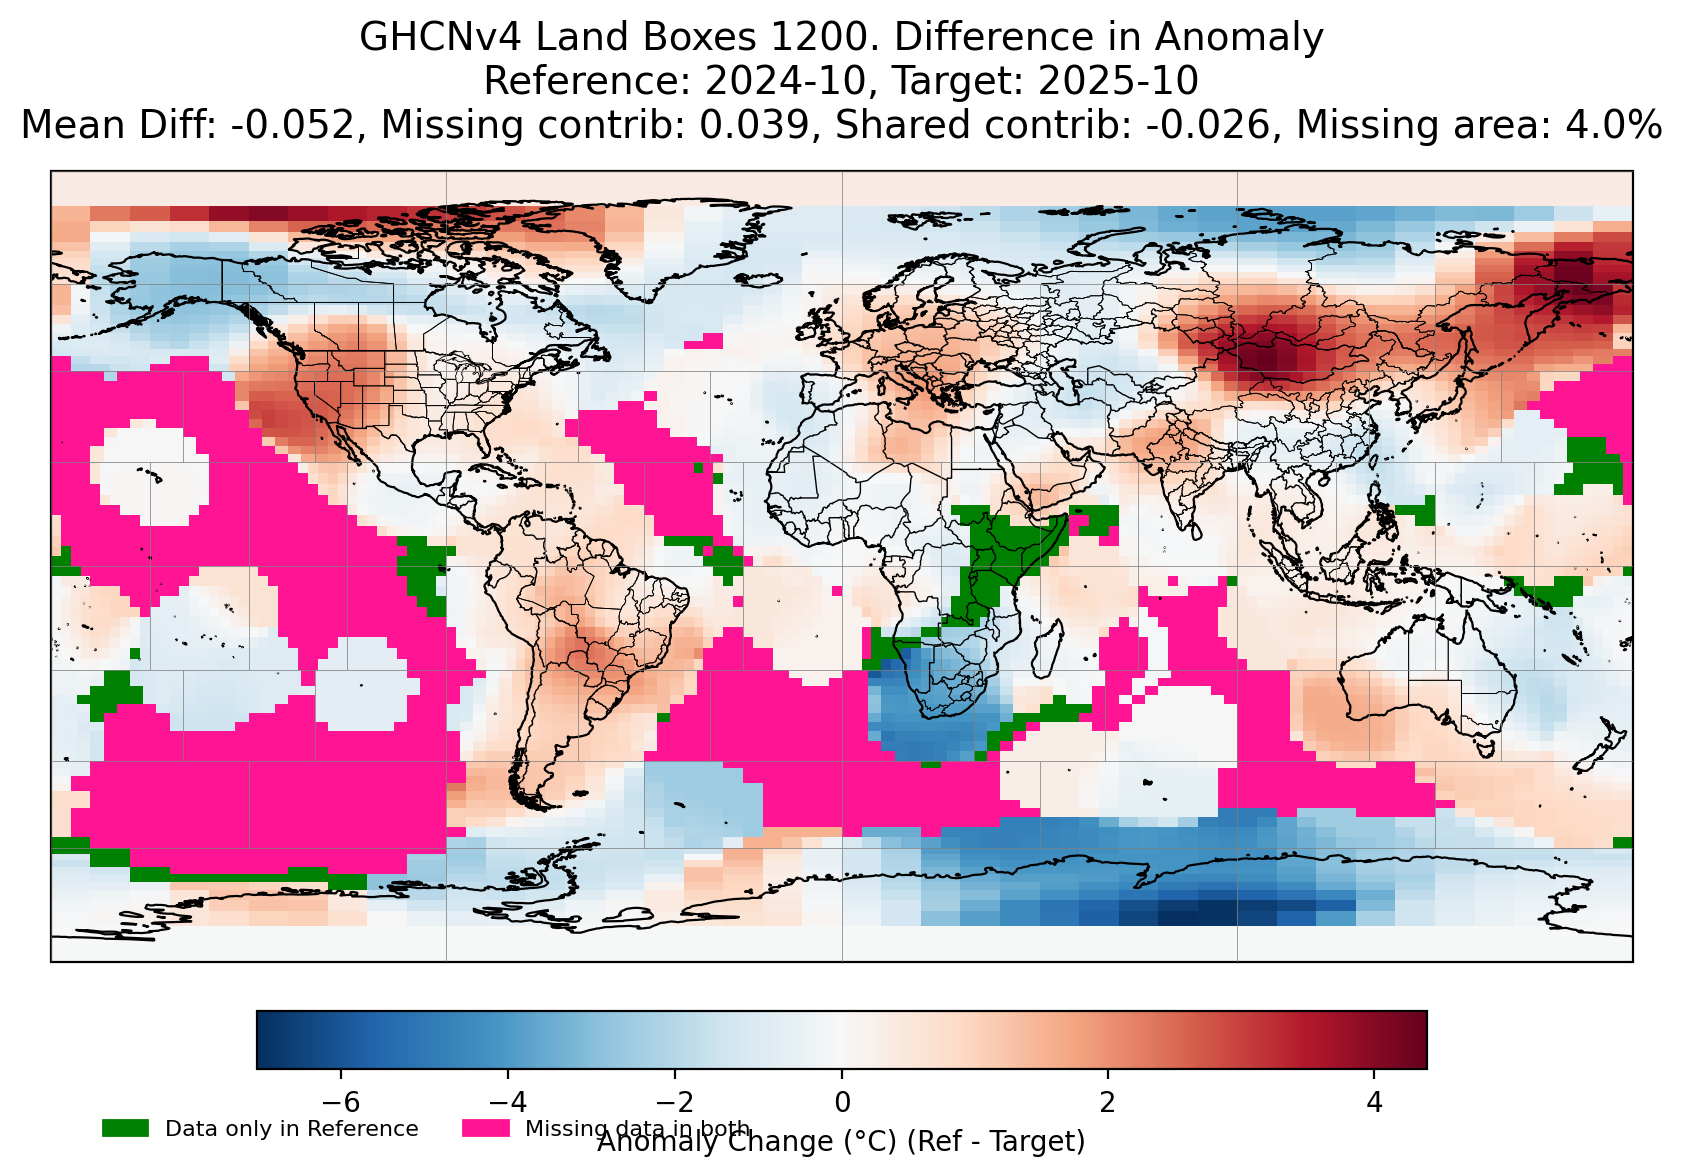
And after visually comparing what is being infilled and how .. (remember in below cold/hot is swapped as its 2024 Oct relative to 2025)
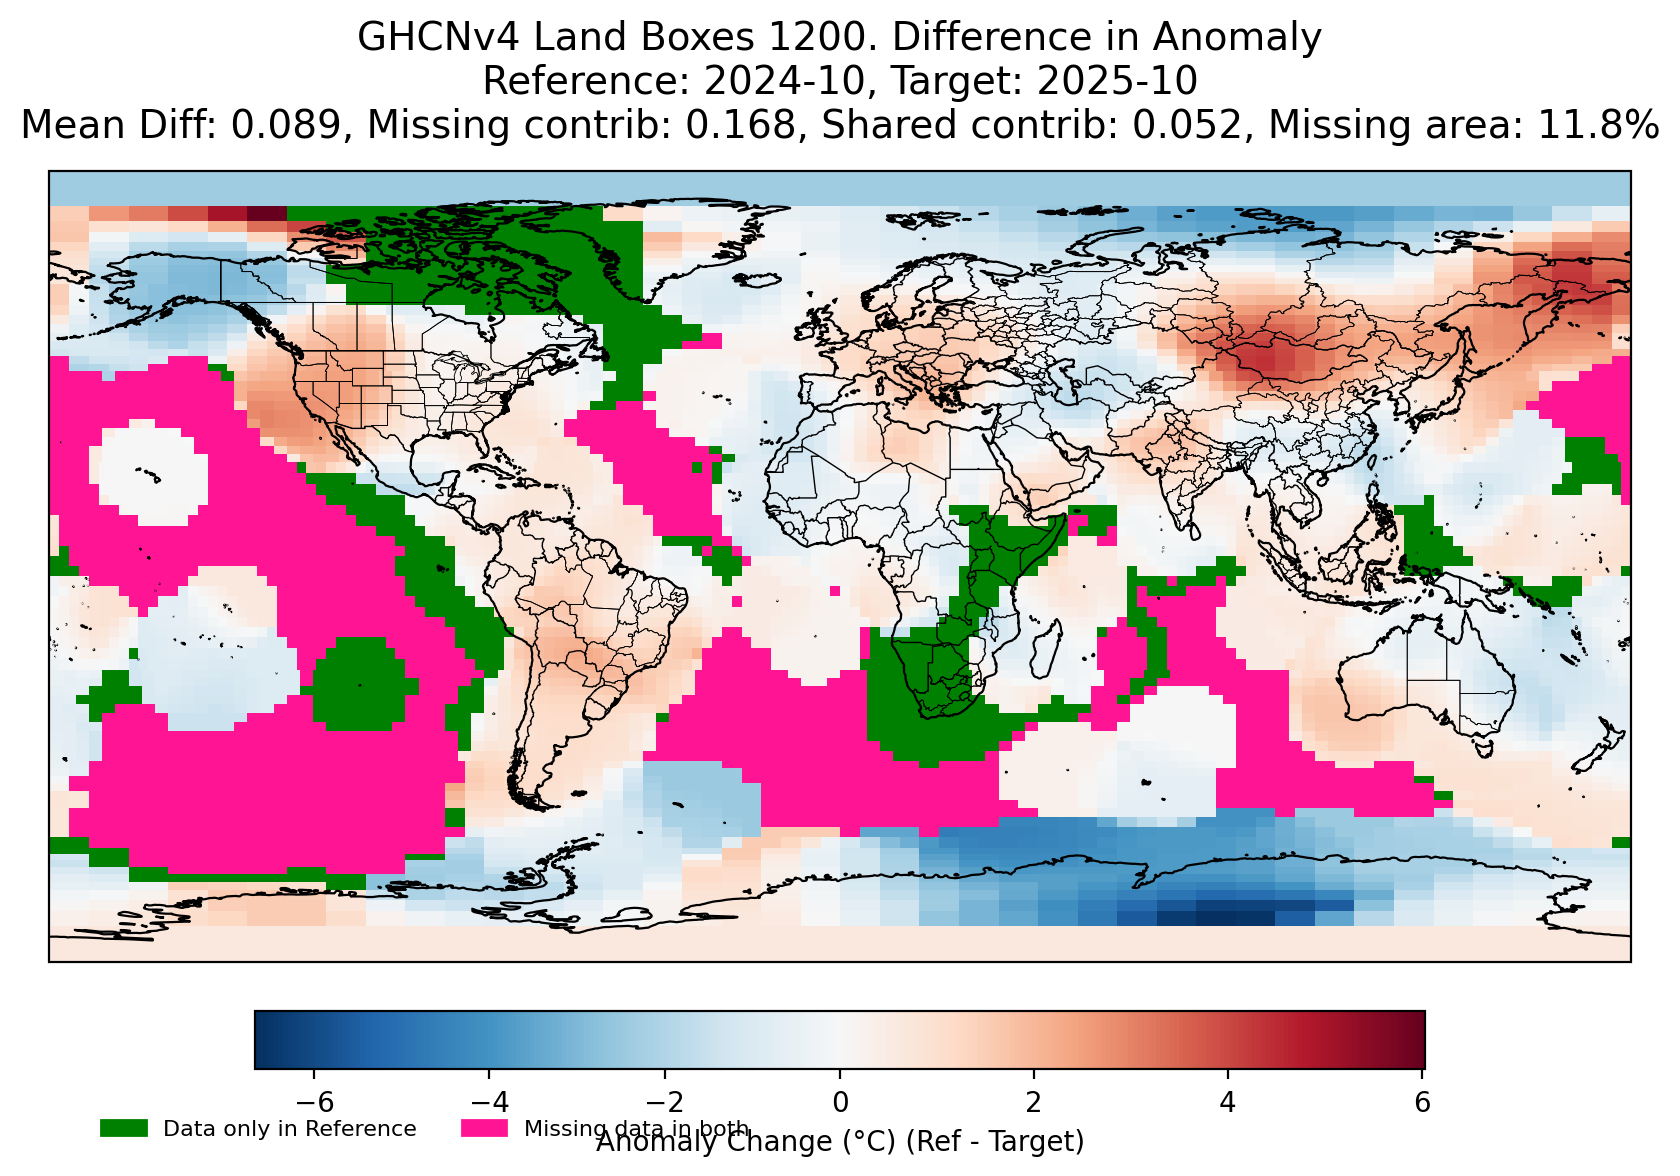
~
Based on what's outstanding that might impact it upwards, (which is mostly Canada and South Africa) when Canada comes in it should increase the temps further (despite expecting parts of Greenland to be a bit colder when they come in).
S. Africa should also increase it a bit.
And, some of Northern Mexico might also increase it a tiny bit (given that it looks like its being infilled a bit cold).
Based on the above and the currently anomaly it looks like it will be close to the bin edge, but based on the above and the prior ERA5->GISTEMP prediction, I (subjectively) place the 1.195+ bin to be now slightly more likely now.
I've dropped my shares in the higher bin (1.245+) (from 9% to 3% in the market) as it looks very unlikely now it will increase that high given the coverage we have now. (This is might be overconfident in retrospect but it seems correct at this moment...)
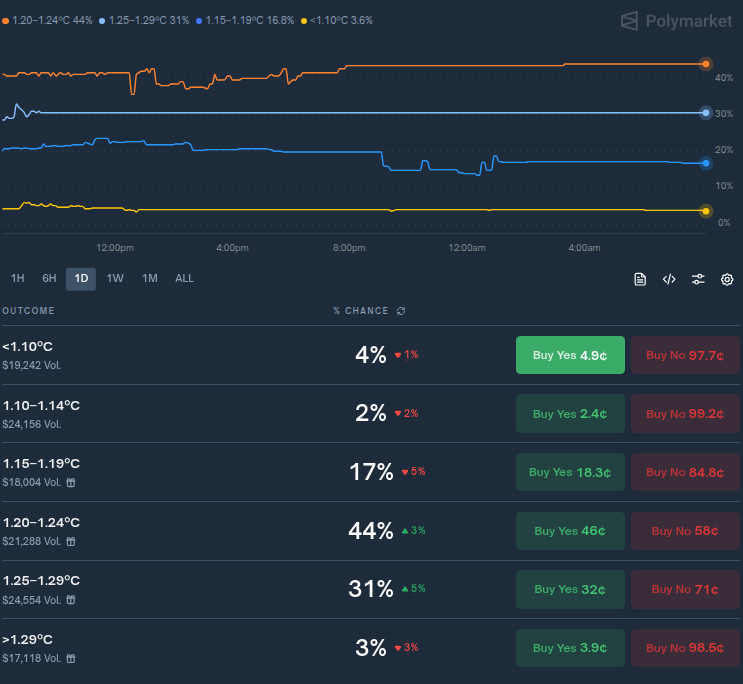
Referencing polymarket's chart for the last day, I don't see they have updated yet on this new information (or perhaps they have already updated all they want)
Either way, @Rhhgdd if it ends up resolving in the lower bin after all (1.145-1.195) it will look in retrospect that you were the most timely of all to update correctly.
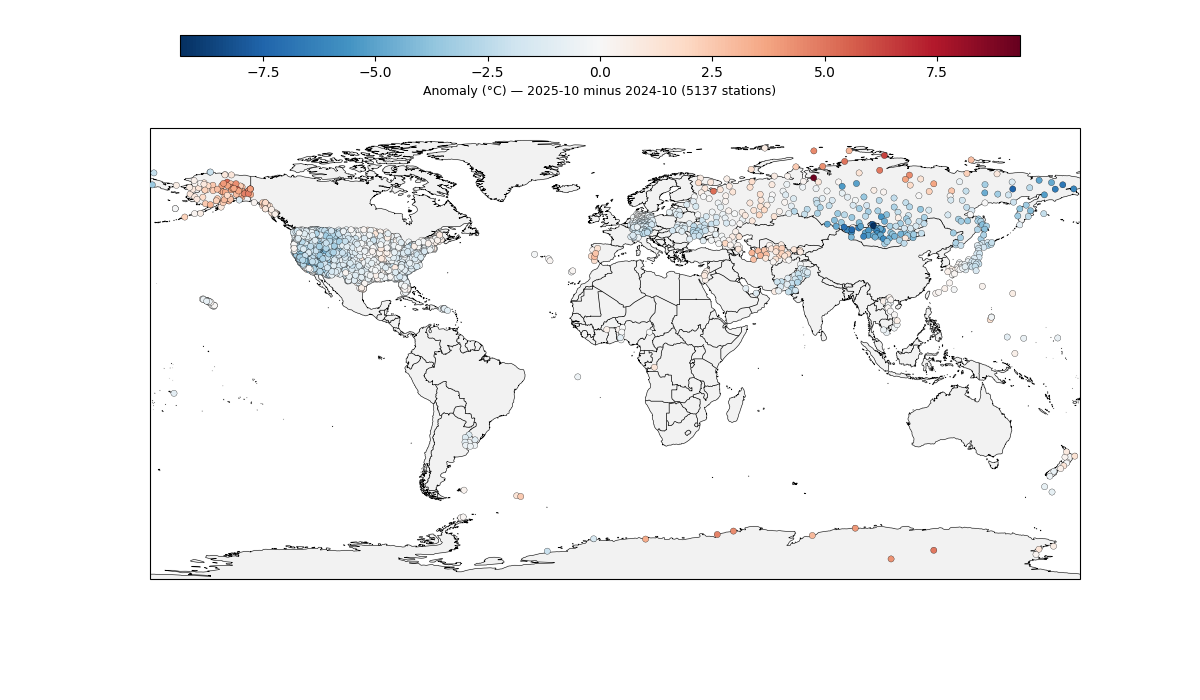
ghcnm.v4.0.1.20251106:
123.88
~
~320+ more stations came in (Canada, tip of South Africa, SE Asia, and more of Greenland).
Still missing East Africa, Mexico, parts of Brazil, and of course parts of the Caribbean.
(Using 1991-2020 for the anomaly)
With the exception of Greenland (which I thought might be a bit cooler), they were all hot but It looks like they all lifted it up much higher than I expected which means I am a poor judge by eye (perhaps the infilling was bringing it far too low).
I do expect if we get more of the temps in South Africa to come in that they end up homogenizing downwards the ones we do already have. Still missing a bit but retrospectively it looks like with the update yesterday I was wrong to sell out that higher bin at this point, so I've bought some shares back into it...
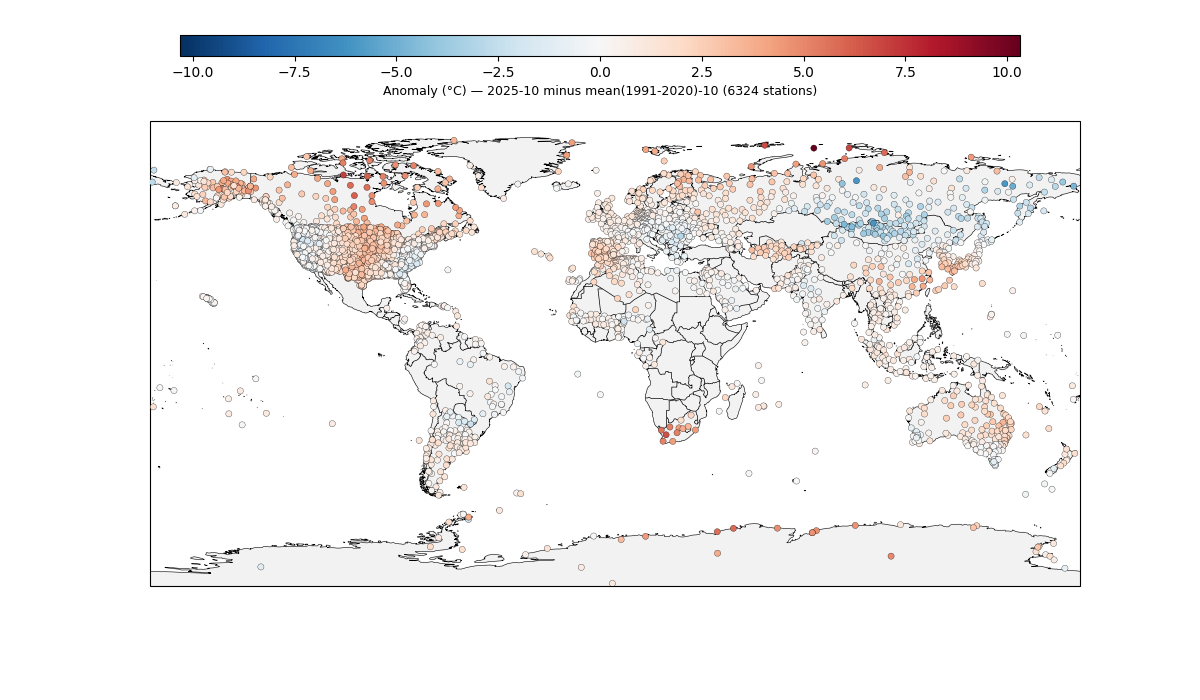
I don't note any egregious anomalies among the stations other than possibly (but not necessarily likely) Ostrov Vize (RSM00020069)
(which I don't think is necessarily anomalous - so I won't exclude it), and one of the South African stations that I expect to be homogenized downwards if we get more data. The ERA5 data did show significant warming events in both regions for October (if you reference the blended image above from ERA5 climatereanalyzer).
~
Top 50 HOT anomalous stations:
RSM00020069: LAT=79.50, LON=76.98, ANOM=10.32, VALUE=2.20, Last30yrs -> mean: -6.70, min: -16.92, max: -0.35, std: 4.28 EXCEEDS 30-yr RANGE BY +2.55°C
...
SF001344780: LAT=-31.47, LON=19.77, ANOM=6.64, VALUE=23.10, Last30yrs -> mean: 16.65, min: 13.26, max: 19.70, std: 1.42 EXCEEDS 30-yr RANGE BY +3.40°C
Notably Antarctica is also exceptionally warm, but I don't see a solid reason to discount it because neighbors also report similar values, i..e for
https://en.wikipedia.org/wiki/Molodyozhnaya_Station_(Antarctica)
AYM00089542: LAT=-67.67, LON=45.85, ANOM=5.95, VALUE=-7.50, Last30yrs -> mean: -13.50, min: -16.24, max: -10.55, std: 1.42 EXCEEDS 30-yr RANGE BY +3.05°C
ghcnm.v4.0.1.20251108:
123.09
~

Only 50 or so stations got added; mainly Mexico and stations from Paraguay that brought the temps down a bit.
Also got a station that survived from NW Jamaica (JM000078388 - Montego Bay's airport) despite hurricane Melissa hitting it with 105 kt gusts...
TAF MKJS 281715Z 2818/2918 07060G95KT 400 +TSRA BKN012CB OVC045
          BECMG 2822/2824 30065G105KT
         BECMG 2916/2918 28025G35KT 7000 SHRA OVC050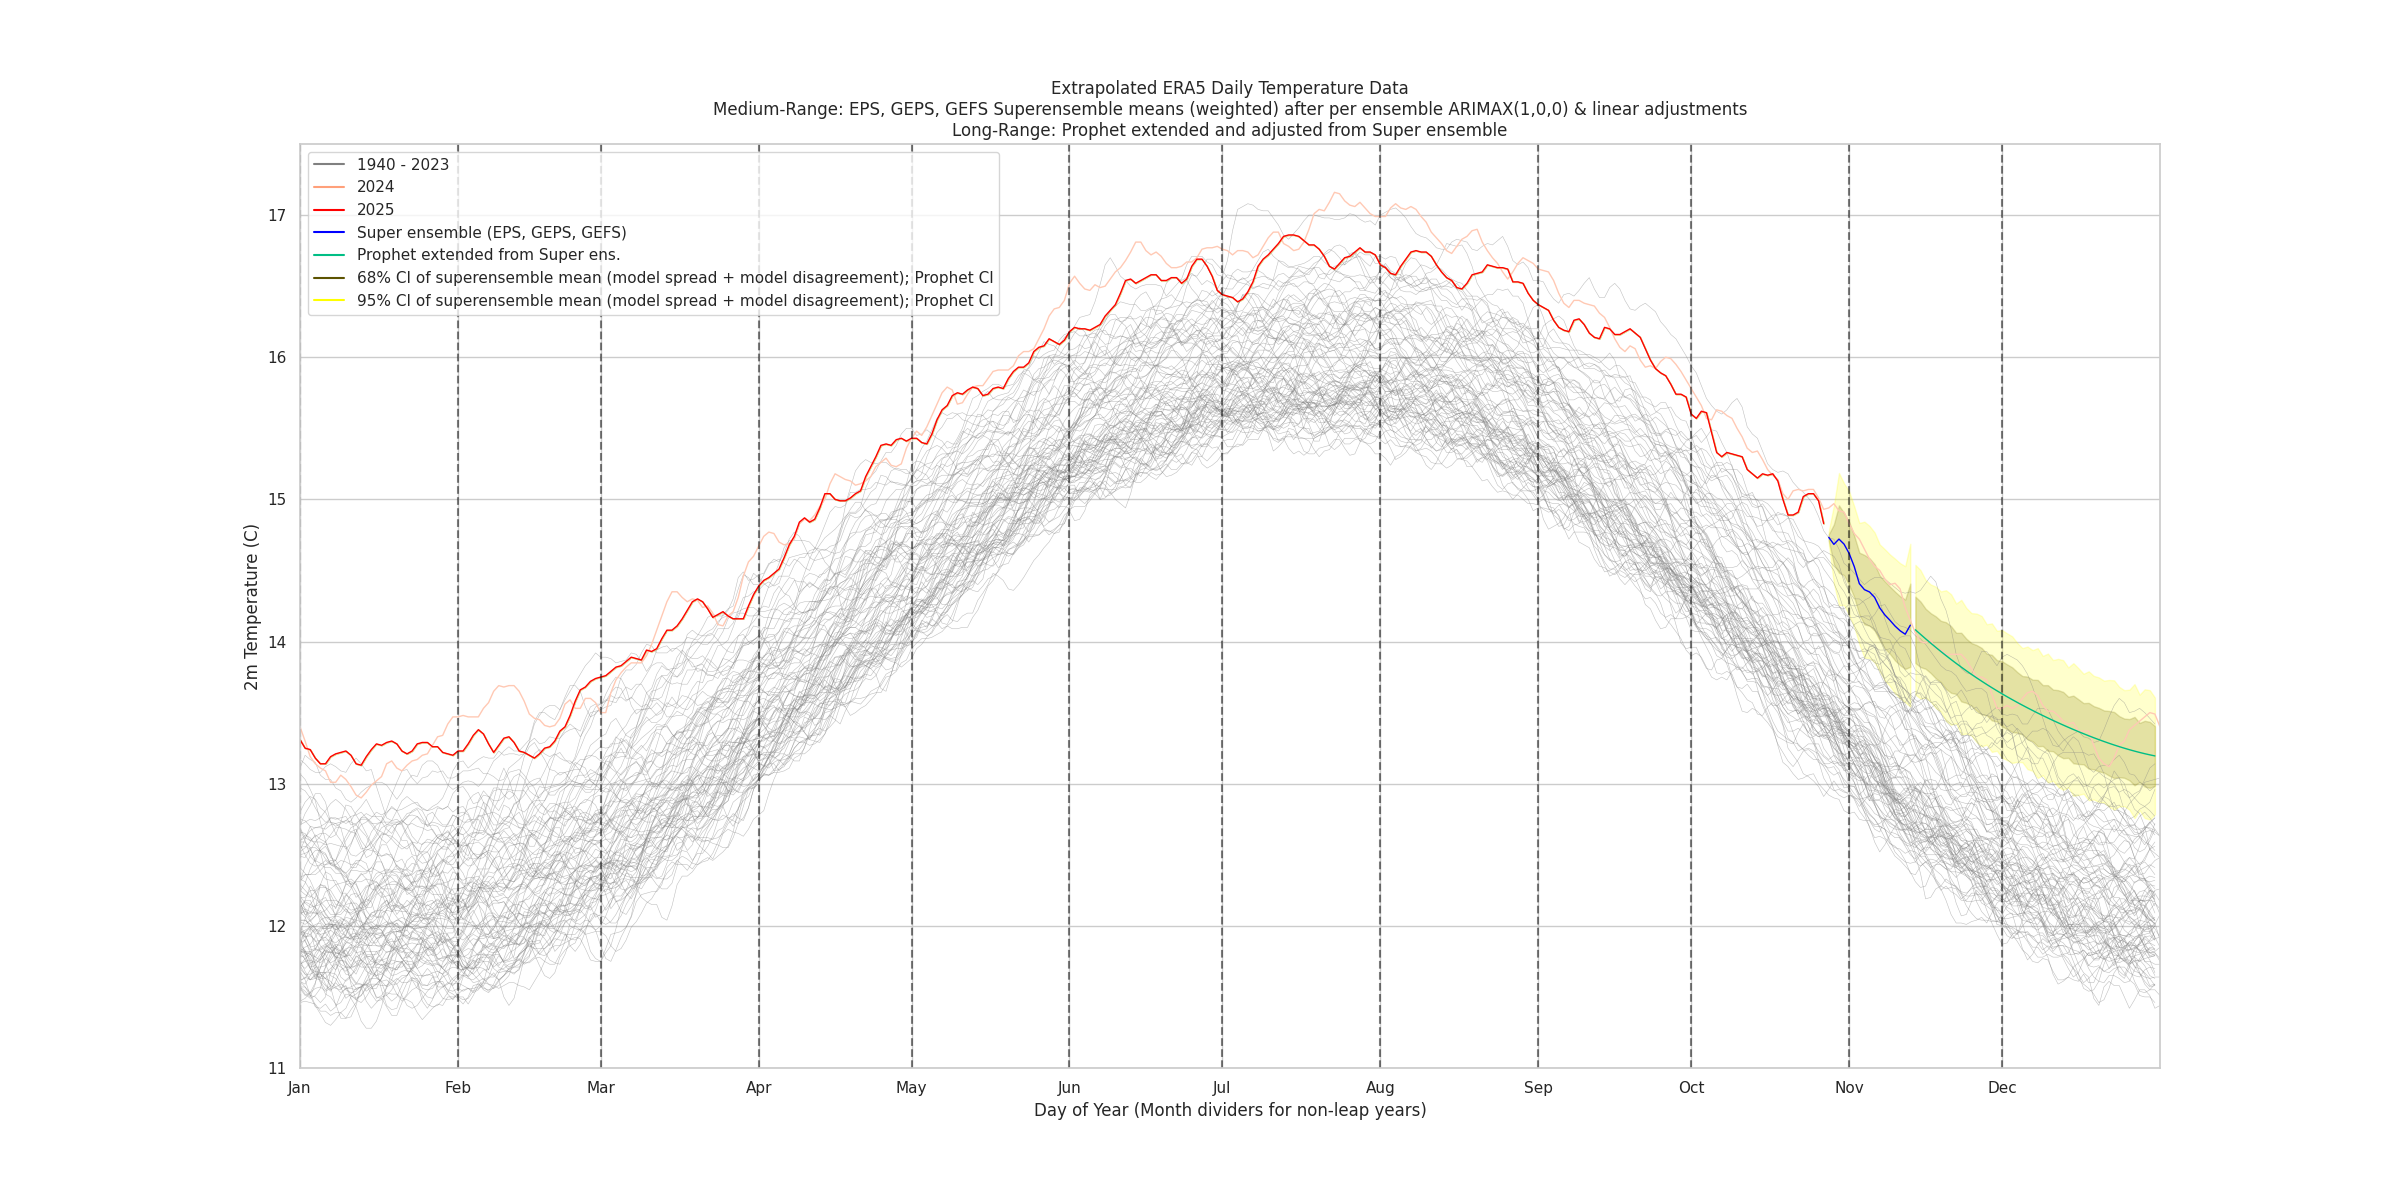
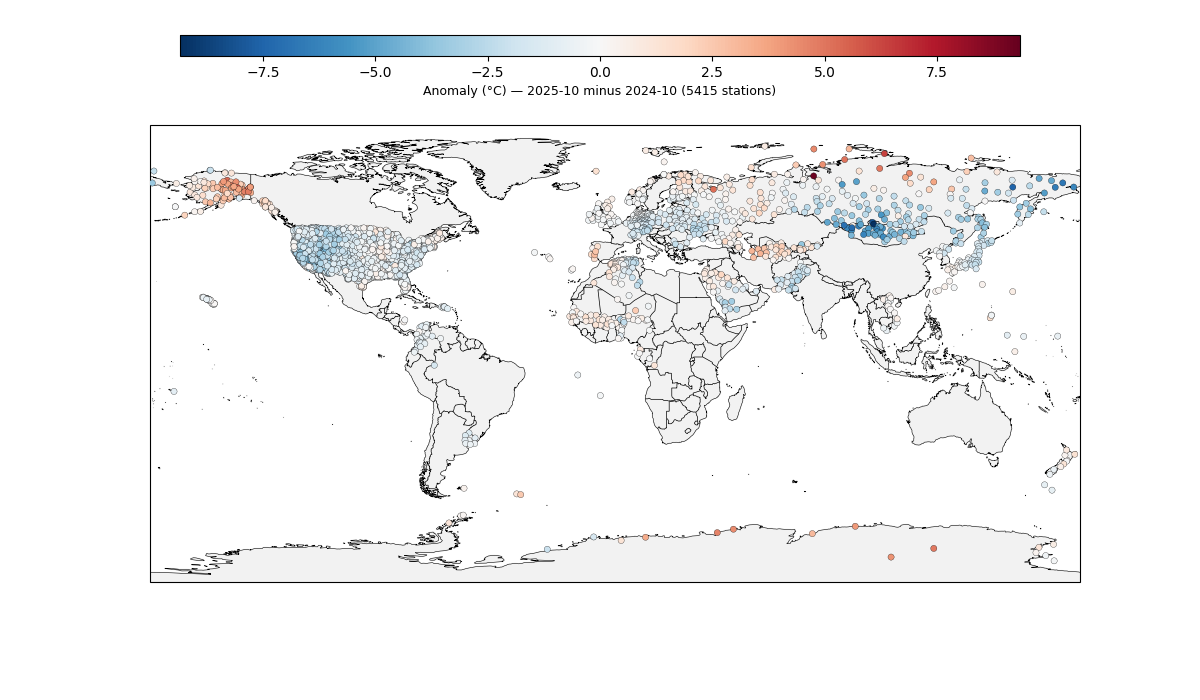
ghcnm.v4.0.1.20251111:
121.95
~
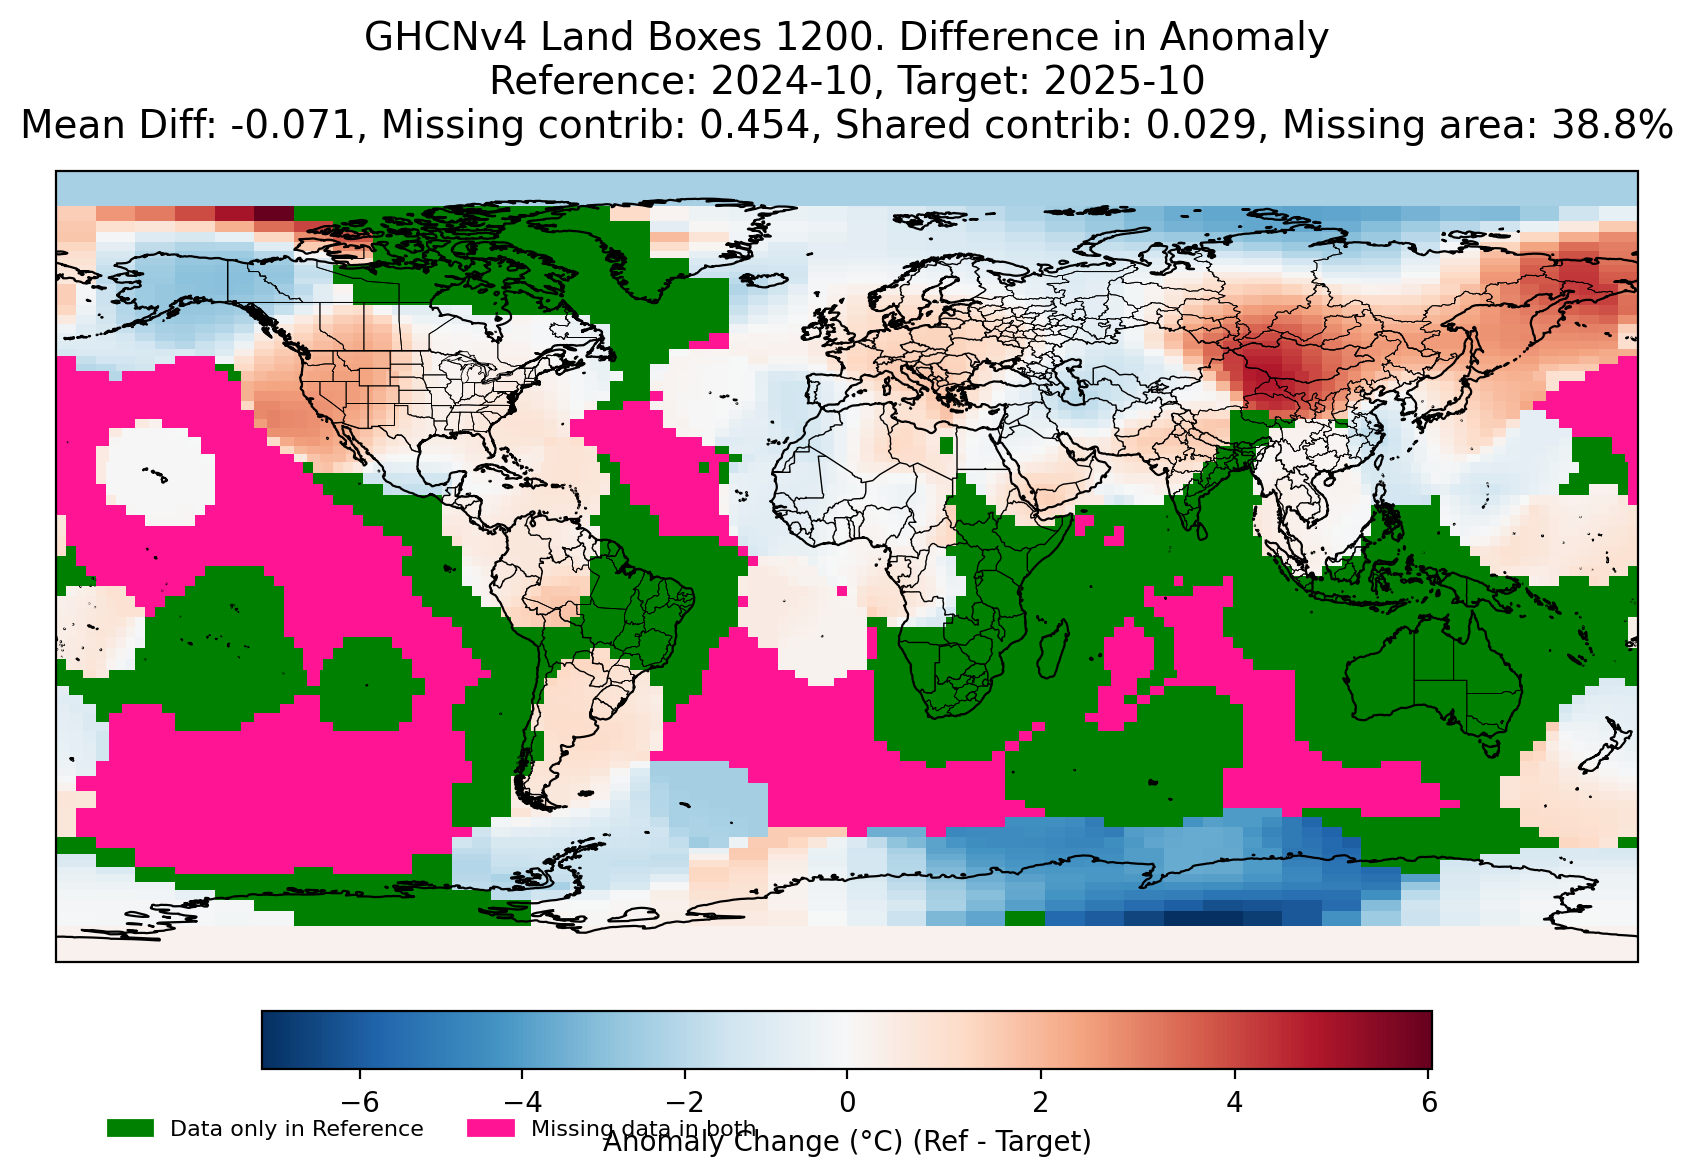
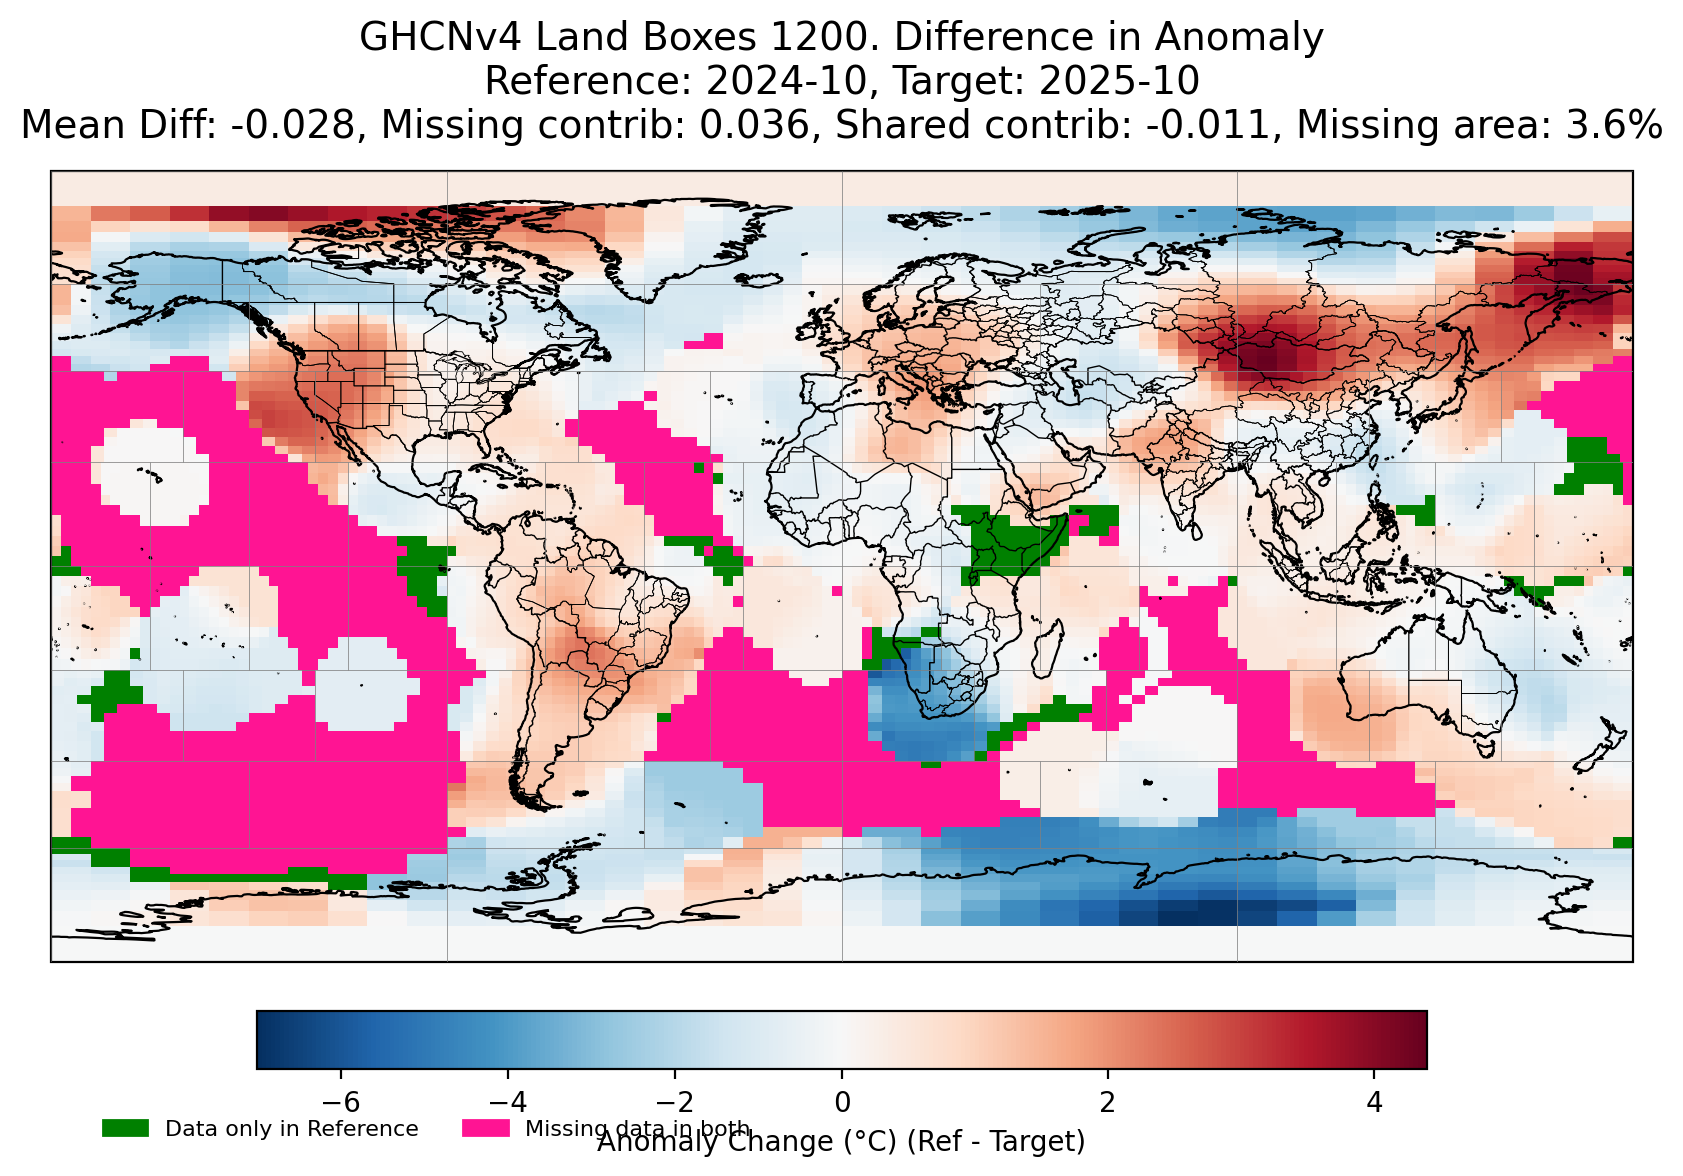
I haven't updated since there wasn't many new stations added in last few days, but last night a small set of new stations came in. The new stations were mostly from Mozambique and being relatively cool compared to South Africa lowered the temps for the south Africa box, but also infilled its own box more, and with slightly with cooler temps (decreasing landbox coverage from 4 to 3.6%)

i.e.
compare ghcnm.v4.0.1.20251110 landboxes
to ghcnm.v4.0.1.20251111 landboxes
~
Given the government shutdown is widely predicted to end at the end of this week, I'm guessing some timely preliminary release will happen by the beginning of next week (perhaps by Tuesday), so I am expecting only 5-6 more updates to ghcnm before then (perhaps as soon as Friday might be possible though this seems too optimistic if they want to go through the anomalies).
Given that the last point is nearly squarely in the middle of the bin I've increased my bet in it, but now that it has decreased to the middle I've also now agnostically hedged a tiny bit on the lower end bin even if my priors think its quite a bit less likely than the higher bin. (i.e. if central Africa data comes in this
@yo22 sounds good, except I’ve been low by quite a bit last few months… last time I checked gistemp for September was 1.26 so it should be in that general range…
For climate news, I wonder whether we will continue to get anomalous temps from Antarctica… it’s been in the news twice recently..
The sudden stratospheric warming event over the last month or so…
And the paper documenting the recent discovery of possibly common methane seeps (microbial apparently ?) in the coastal Ross sea… paper and article (skimmed it)