Data is currently at
403 Forbidden
or
(or such updated location for this Gistemp v4 LOTI data)
January 2024 might show as 124 in hundredths of a degree C, this is +1.24C above the 1951-1980 base period. If it shows as 1.22 then it is in degrees i.e. 1.22C. Same logic/interpretation as this will be applied.
If the version or base period changes then I will consult with traders over what is best way for any such change to have least effect on betting positions or consider N/A if it is unclear what the sensible least effect resolution should be.
Numbers expected to be displayed to hundredth of a degree. The extra digit used here is to ensure understanding that +1.20C resolves to an exceed 1.195C option.
Resolves per first update seen by me or posted as long, as there is no reason to think data shown is significantly in error. If there is reason to think there may be an error then resolution will be delayed at least 24 hours. Minor later update should not cause a need to re-resolve.
August 2026 market:
 1,000
1,000🏅 Top traders
| # | Trader | Total profit |
|---|---|---|
| 1 | Ṁ1,412 | |
| 2 | Ṁ186 | |
| 3 | Ṁ176 | |
| 4 | Ṁ129 | |
| 5 | Ṁ100 |
People are also trading
August 2026 market
oops answer wrong try again now at
/ChristopherRandles/global-average-temperature-august-2-dECE9E96uA
Updated my unofficial GISTEMP repo to include changes for ERSSTv6.
Includes the fortran version of the ERSSTv6 SBBX creation code as well a pure python version by Claude (both use the NCEI monthly netCDF files rather than the combined PSL file).
Also added (the updated) downloader for the NCEI sst data.
Note that the NCEI is due for a scheduled maintenance tomorrow afternoon:
"Due to scheduled maintenance, many NCEI systems may be unavailable August 3, 3:30 PM ET - 5:30 PM ET. We apologize for any inconvenience."
ERSSTv6 came in some hours earlier... we have some fairly decent coverage of the NH and some very partial for Antarctica and Australia. (Enough to do an analysis):
result_ghcnm.v4.0.1.20260802
114.73028677804142
(it took a while for me to finish the EPS runs from 06Z today and the analysis so I'm late).
TLDR from below is I think the market putting 1.195-1.245 at 88% is too high despite it being the most likely still objectively:
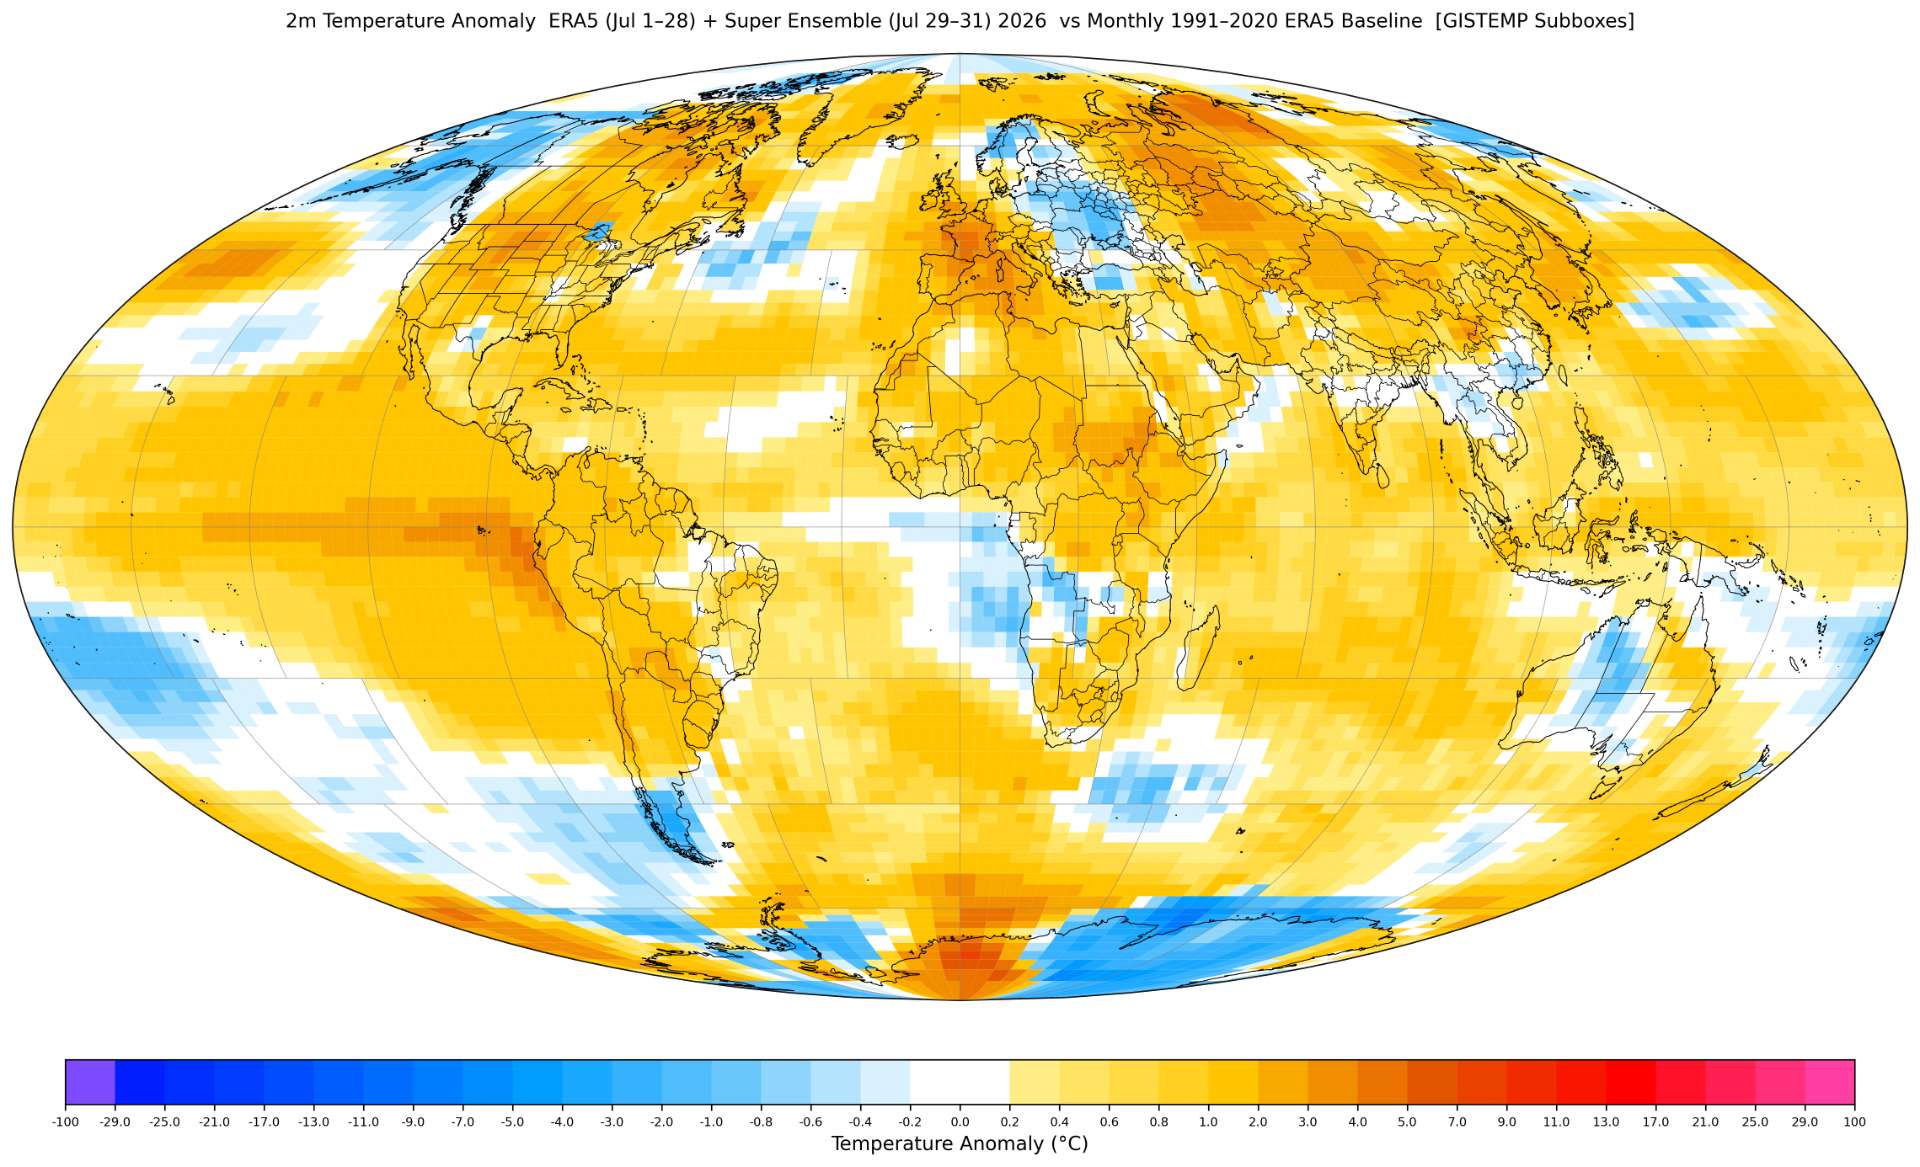
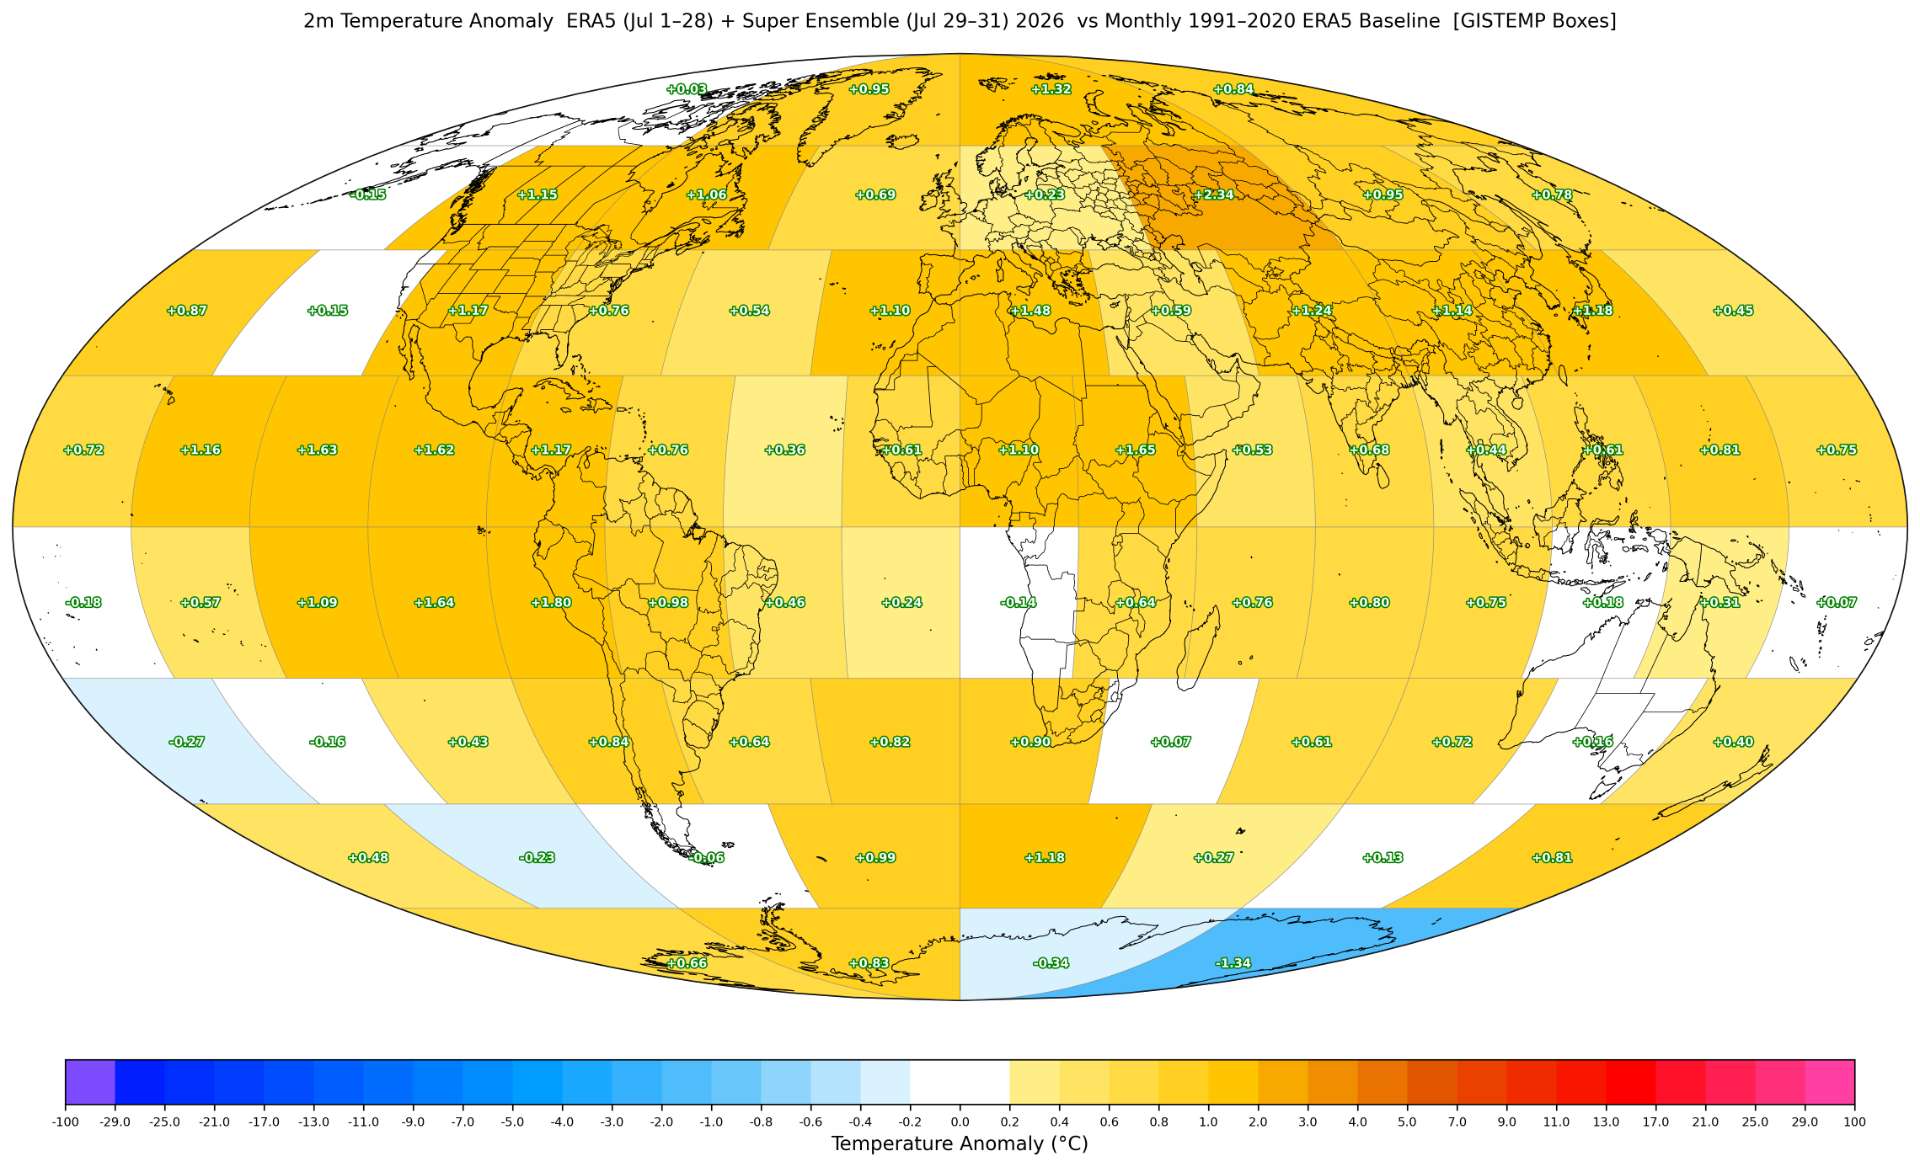
GISTEMP plots:
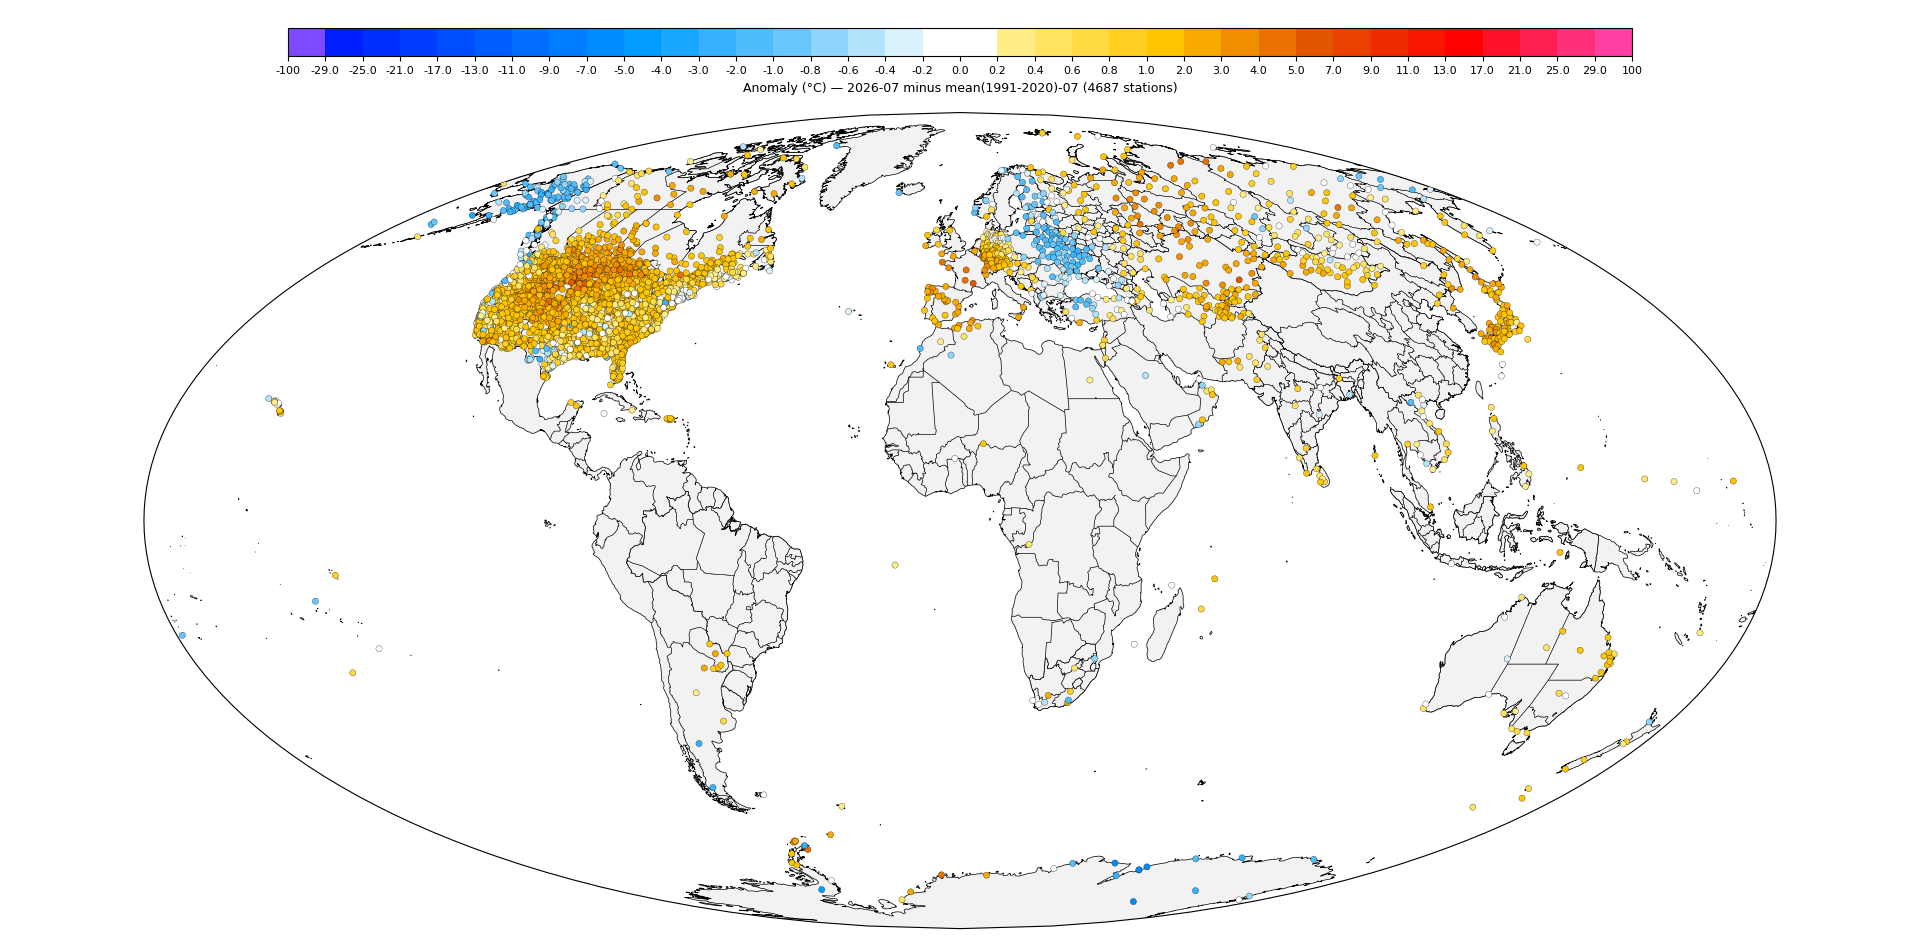
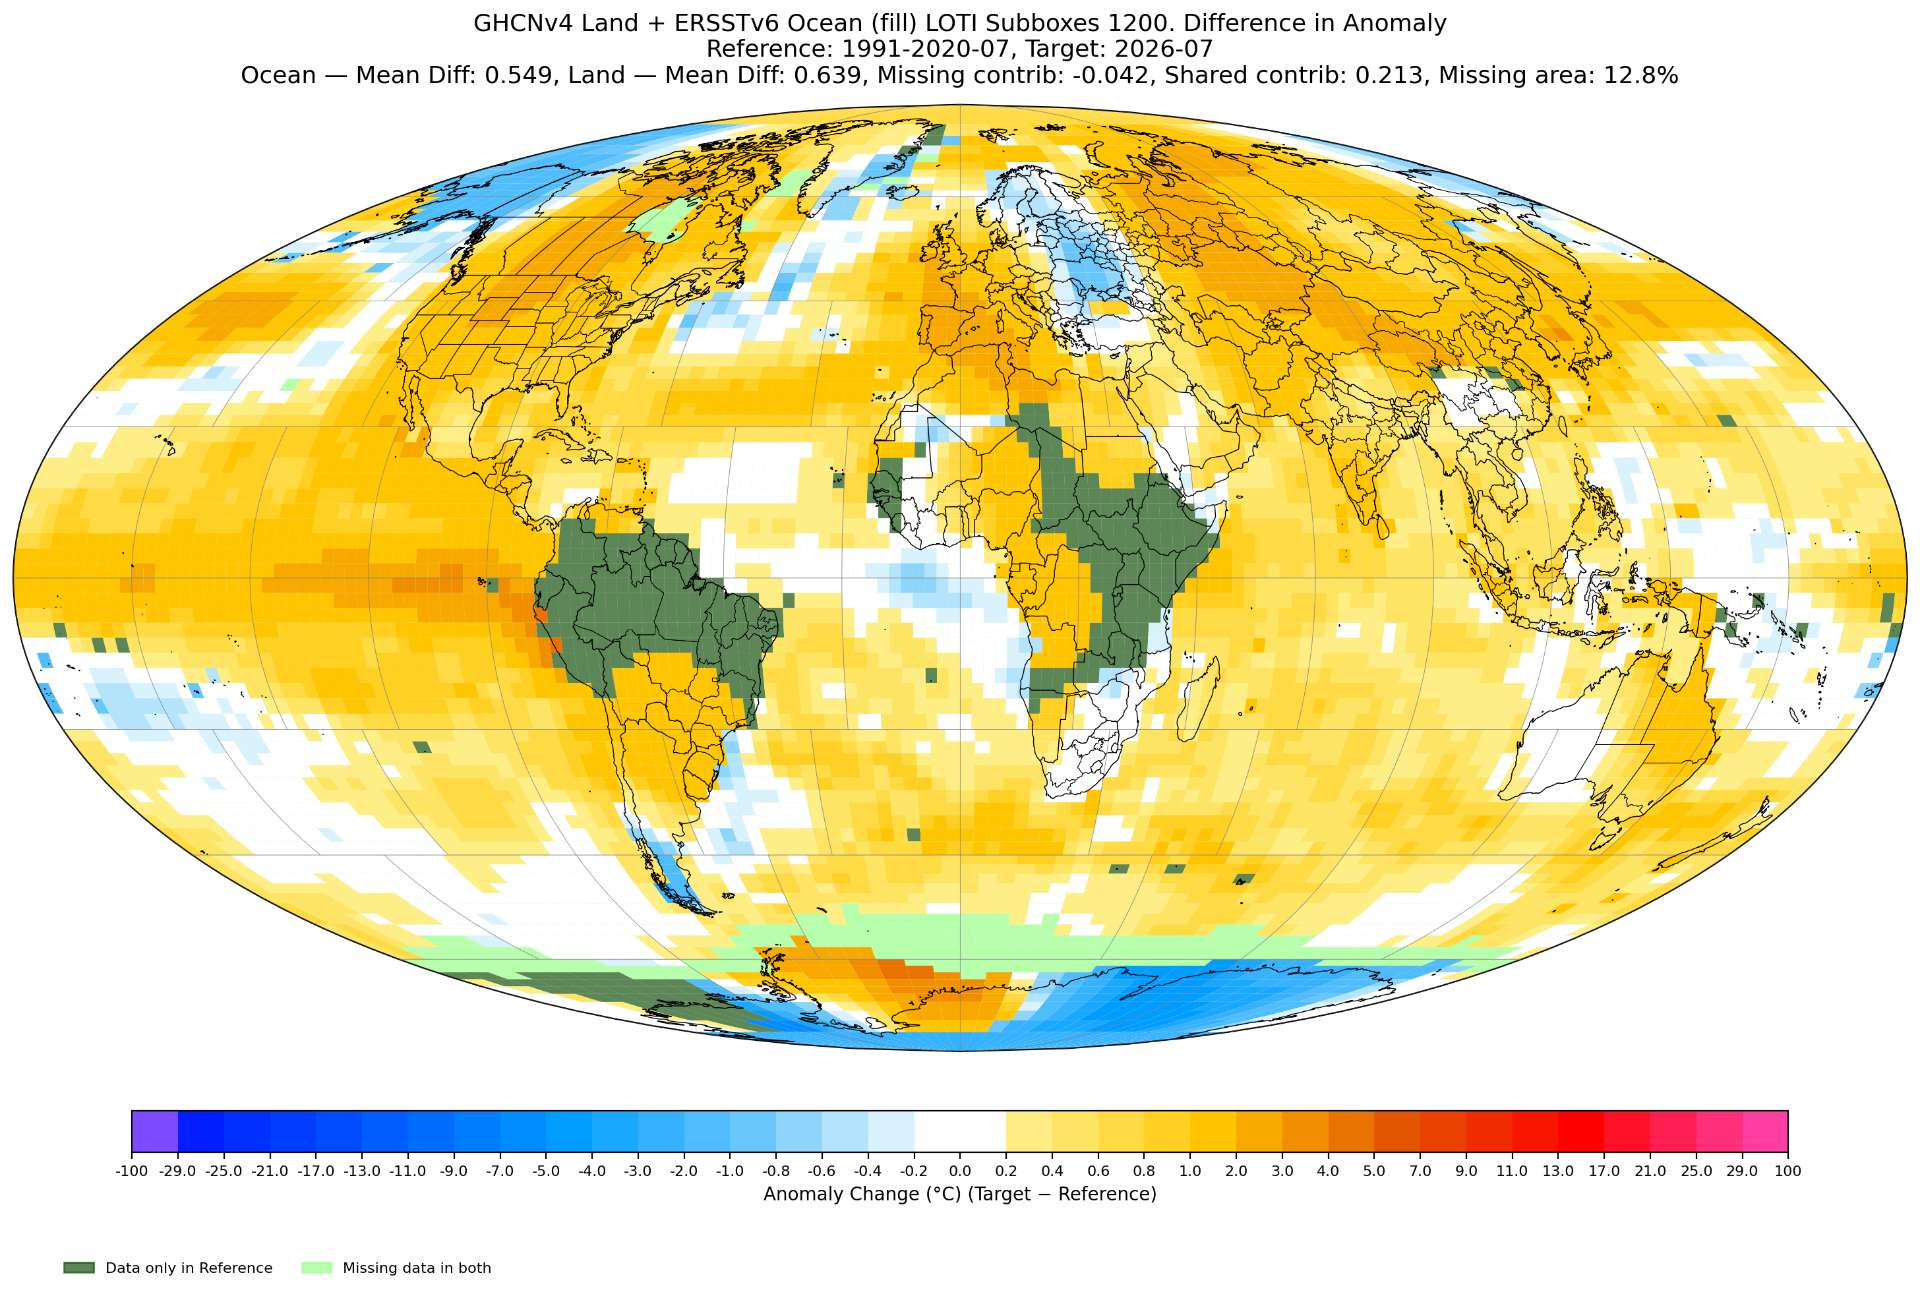
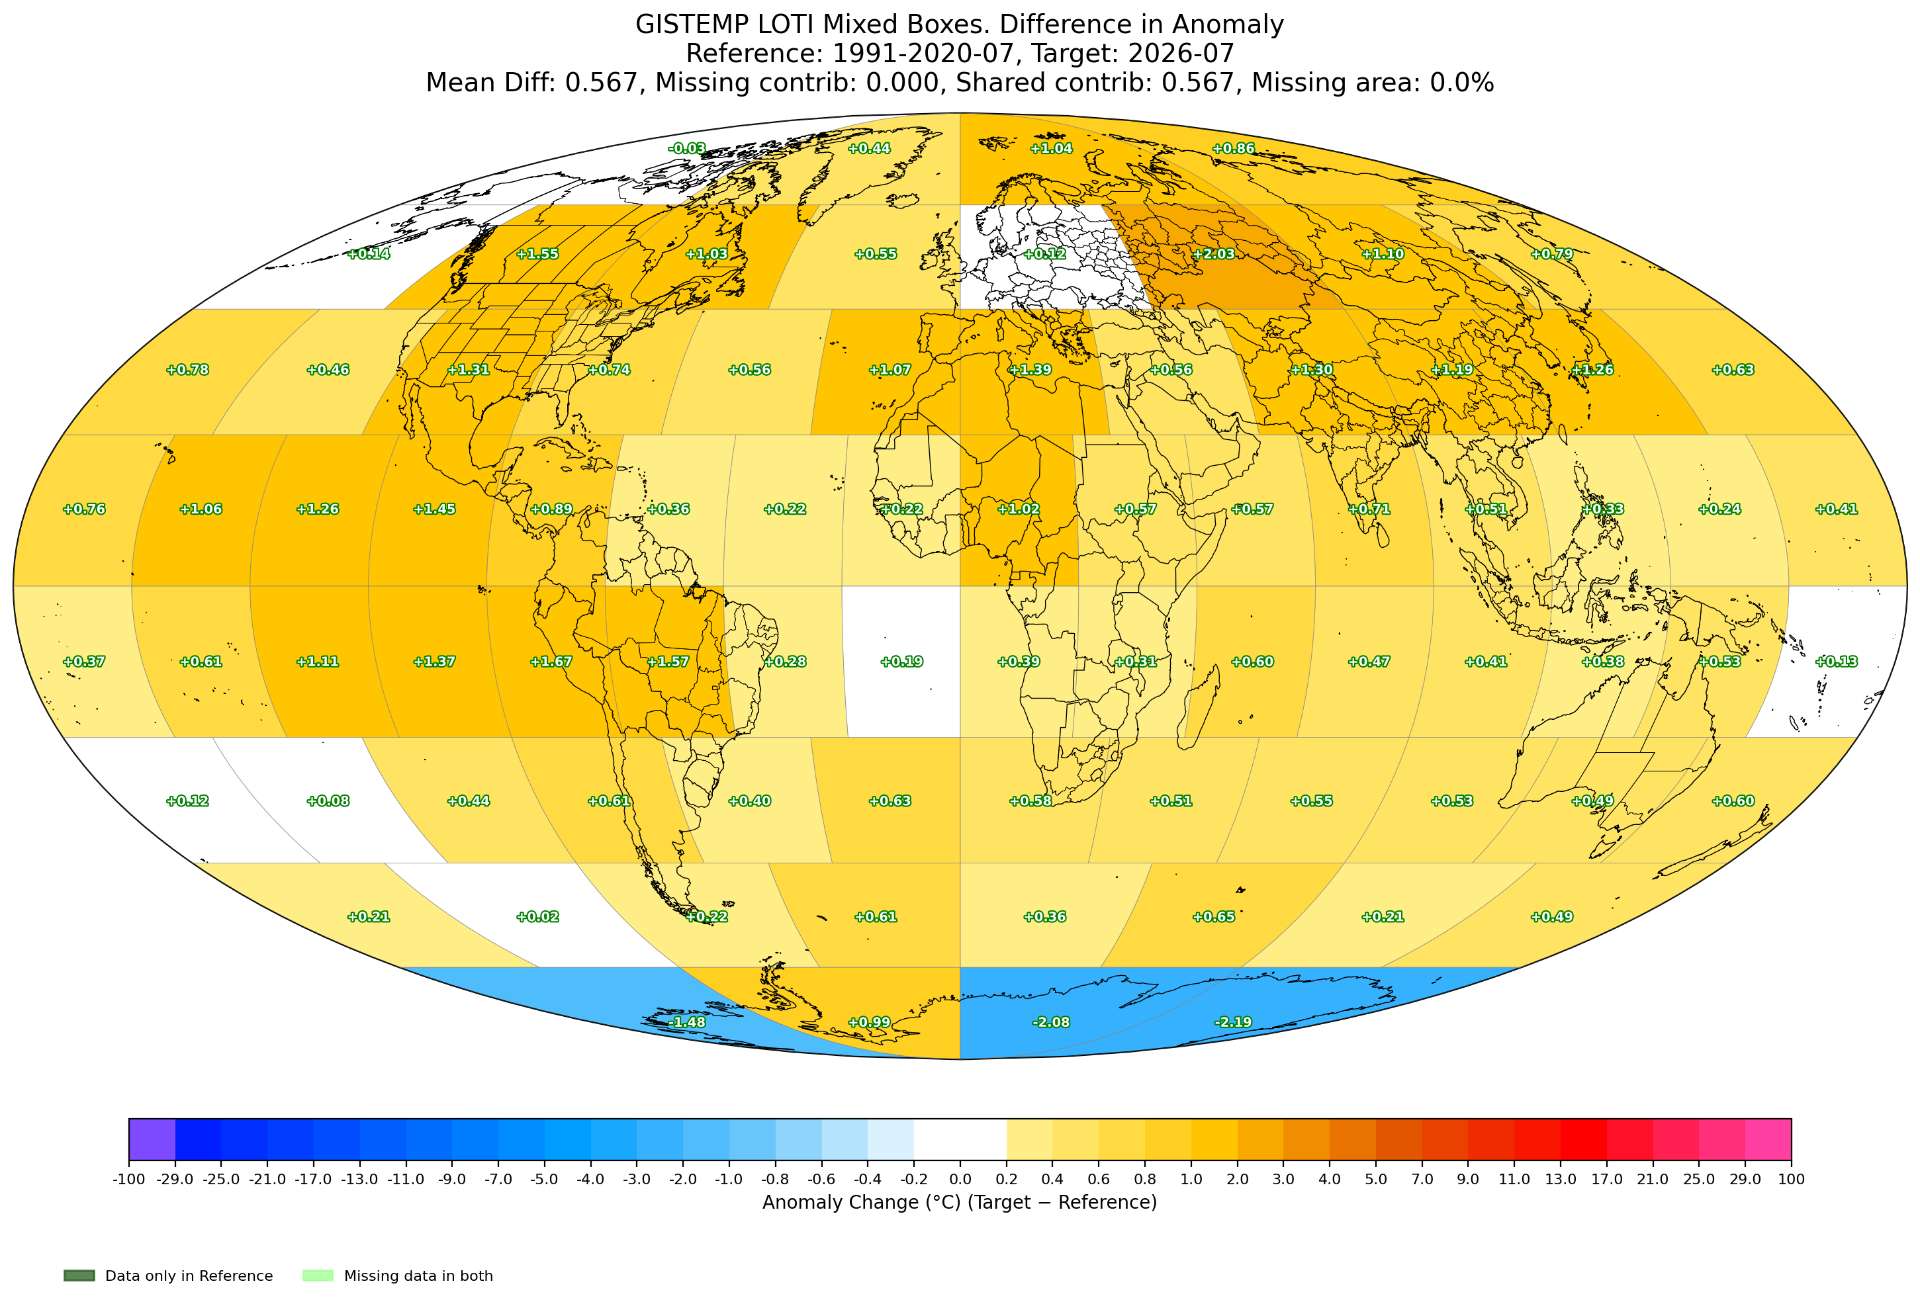
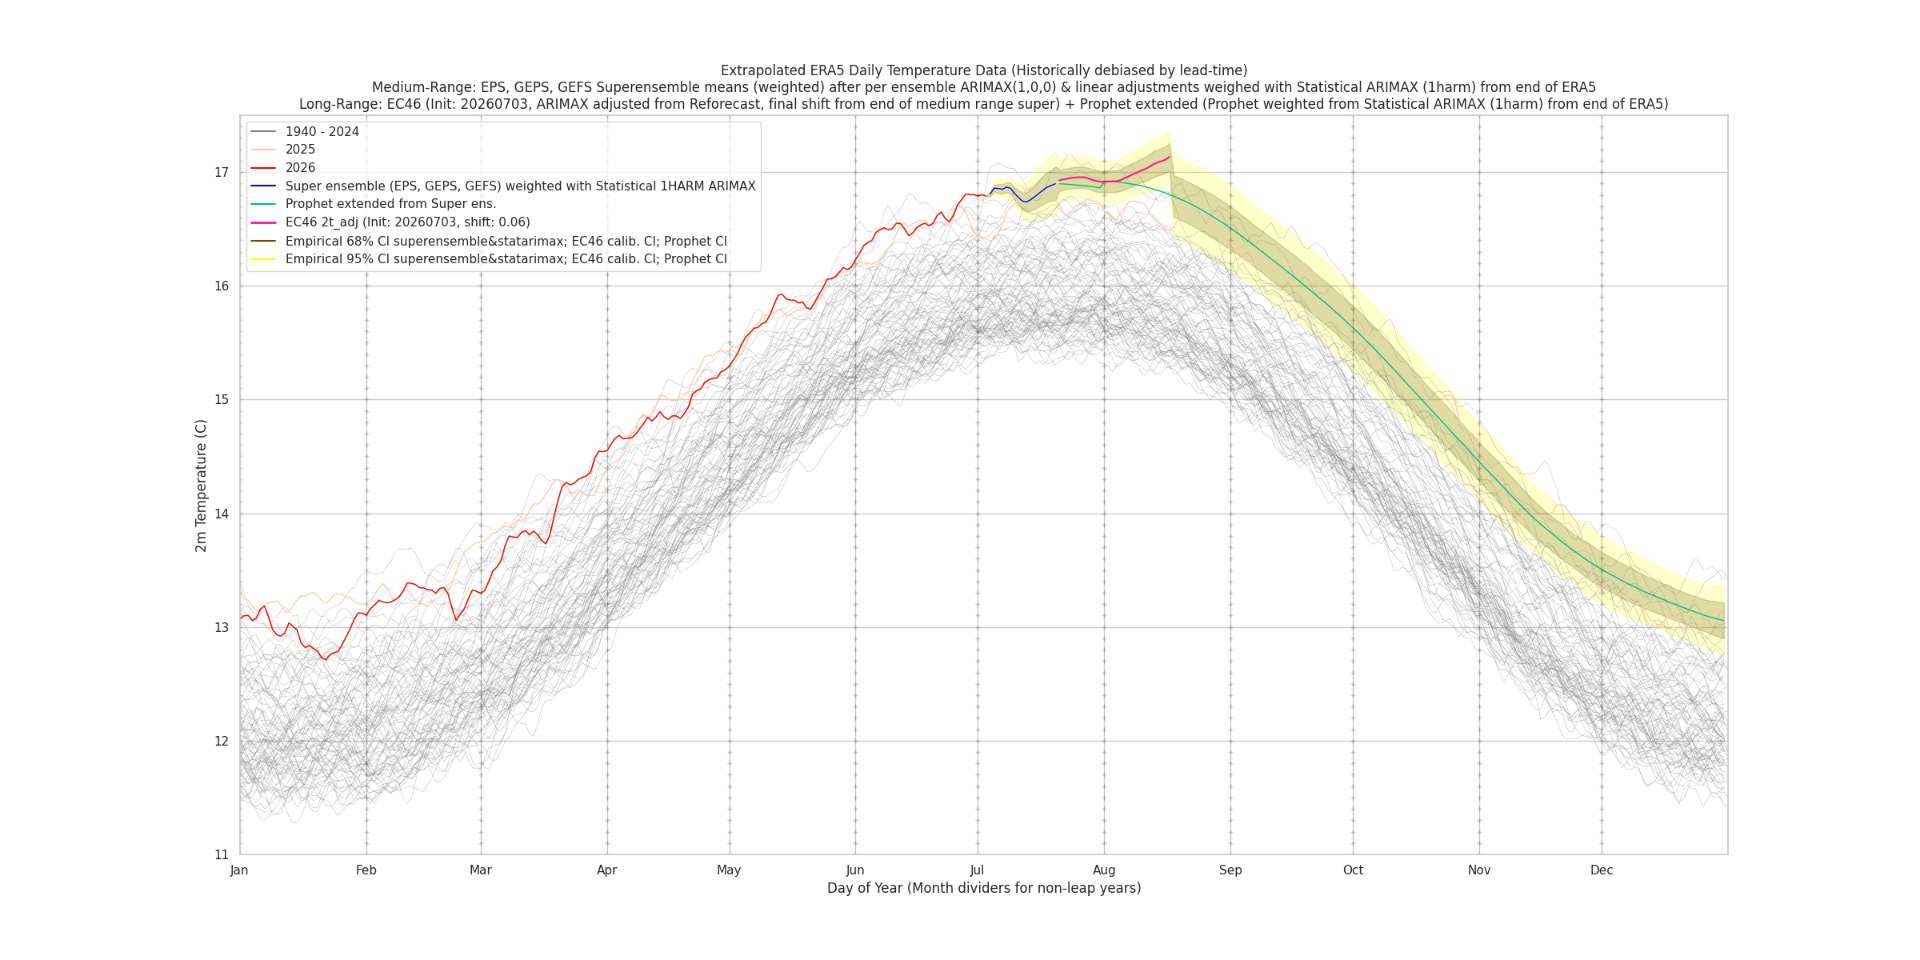
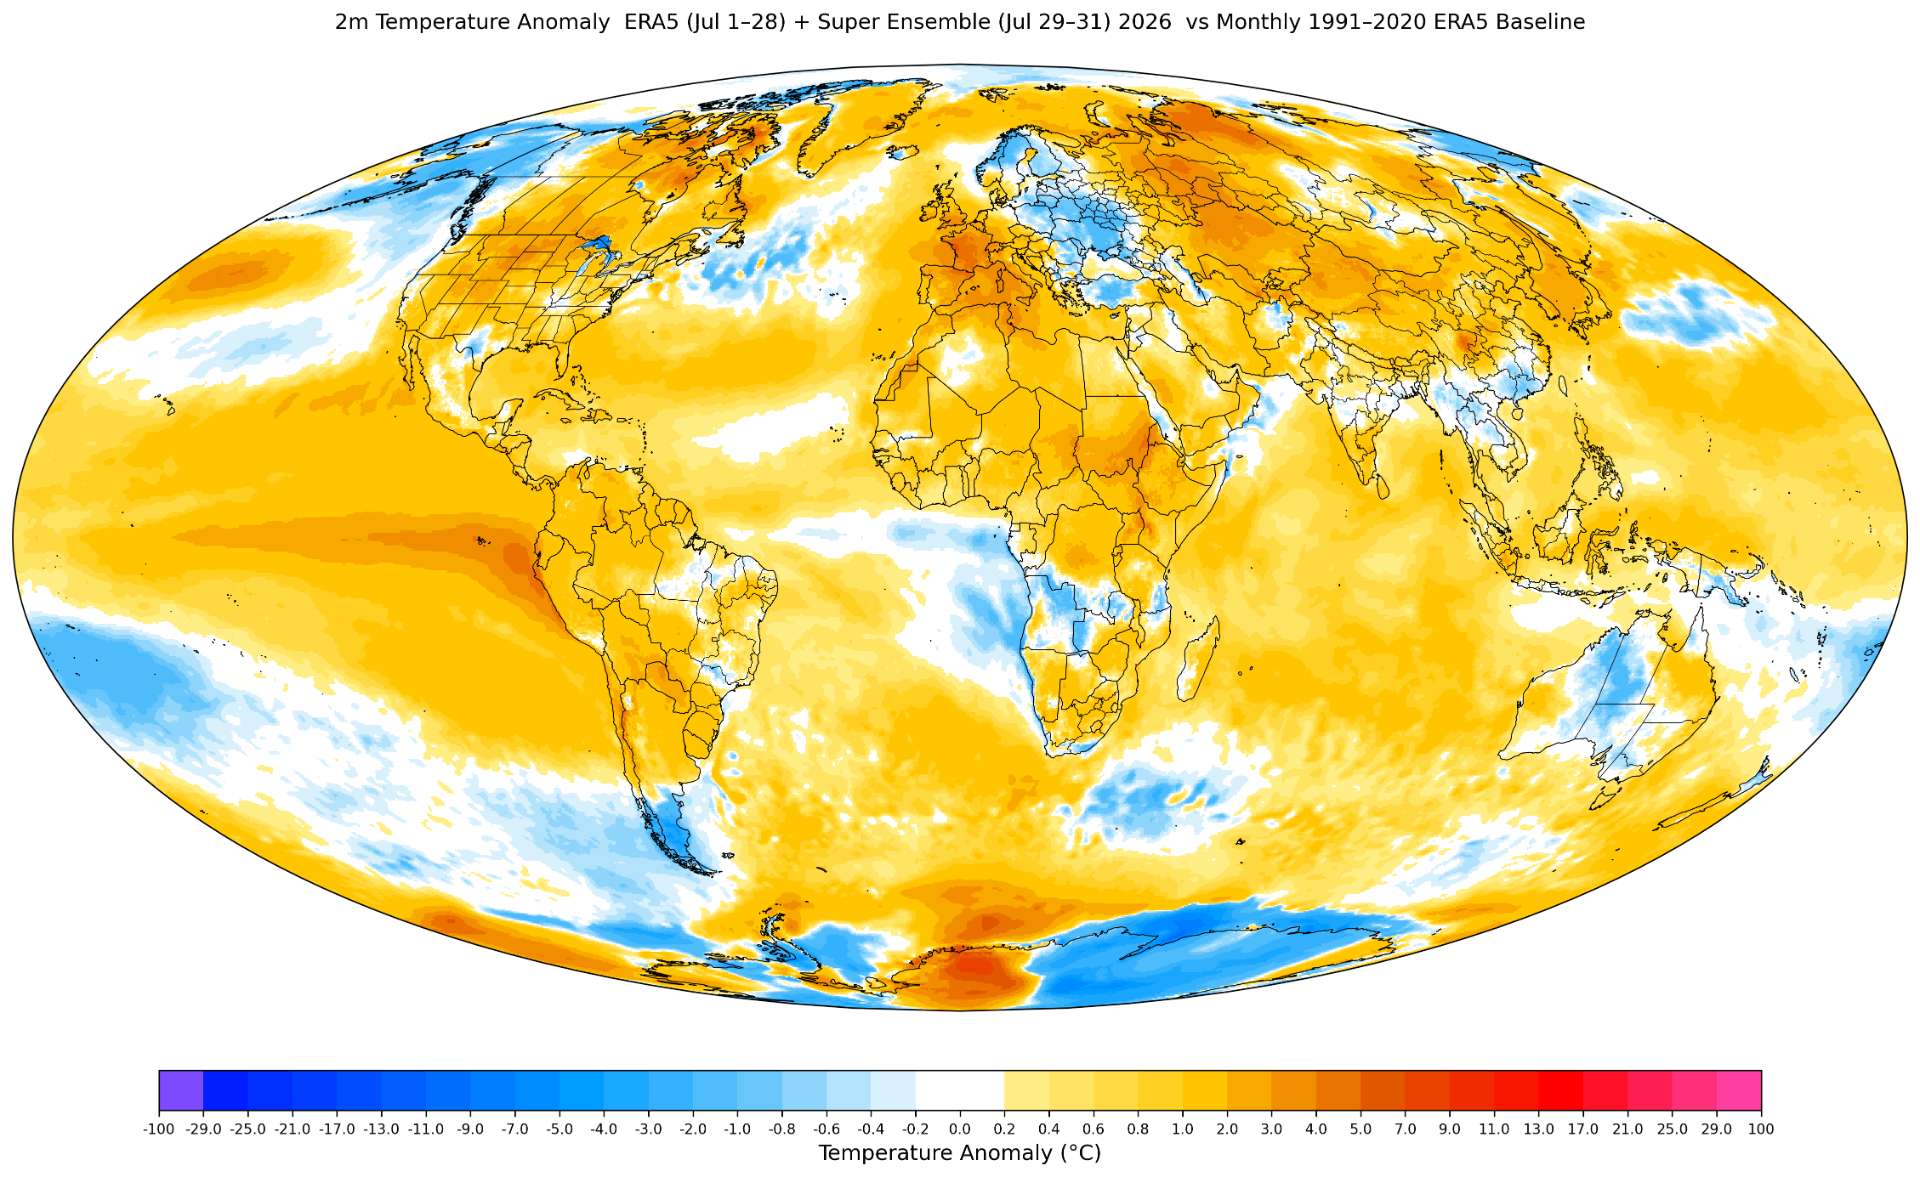
ERA5 plots (super ensemble from July 29-):
===
Below analysis based on the above products and mainly looking at the deltas of the gistemp/era5 toggle box tool for gistemp boxes (ghcnm0802)...
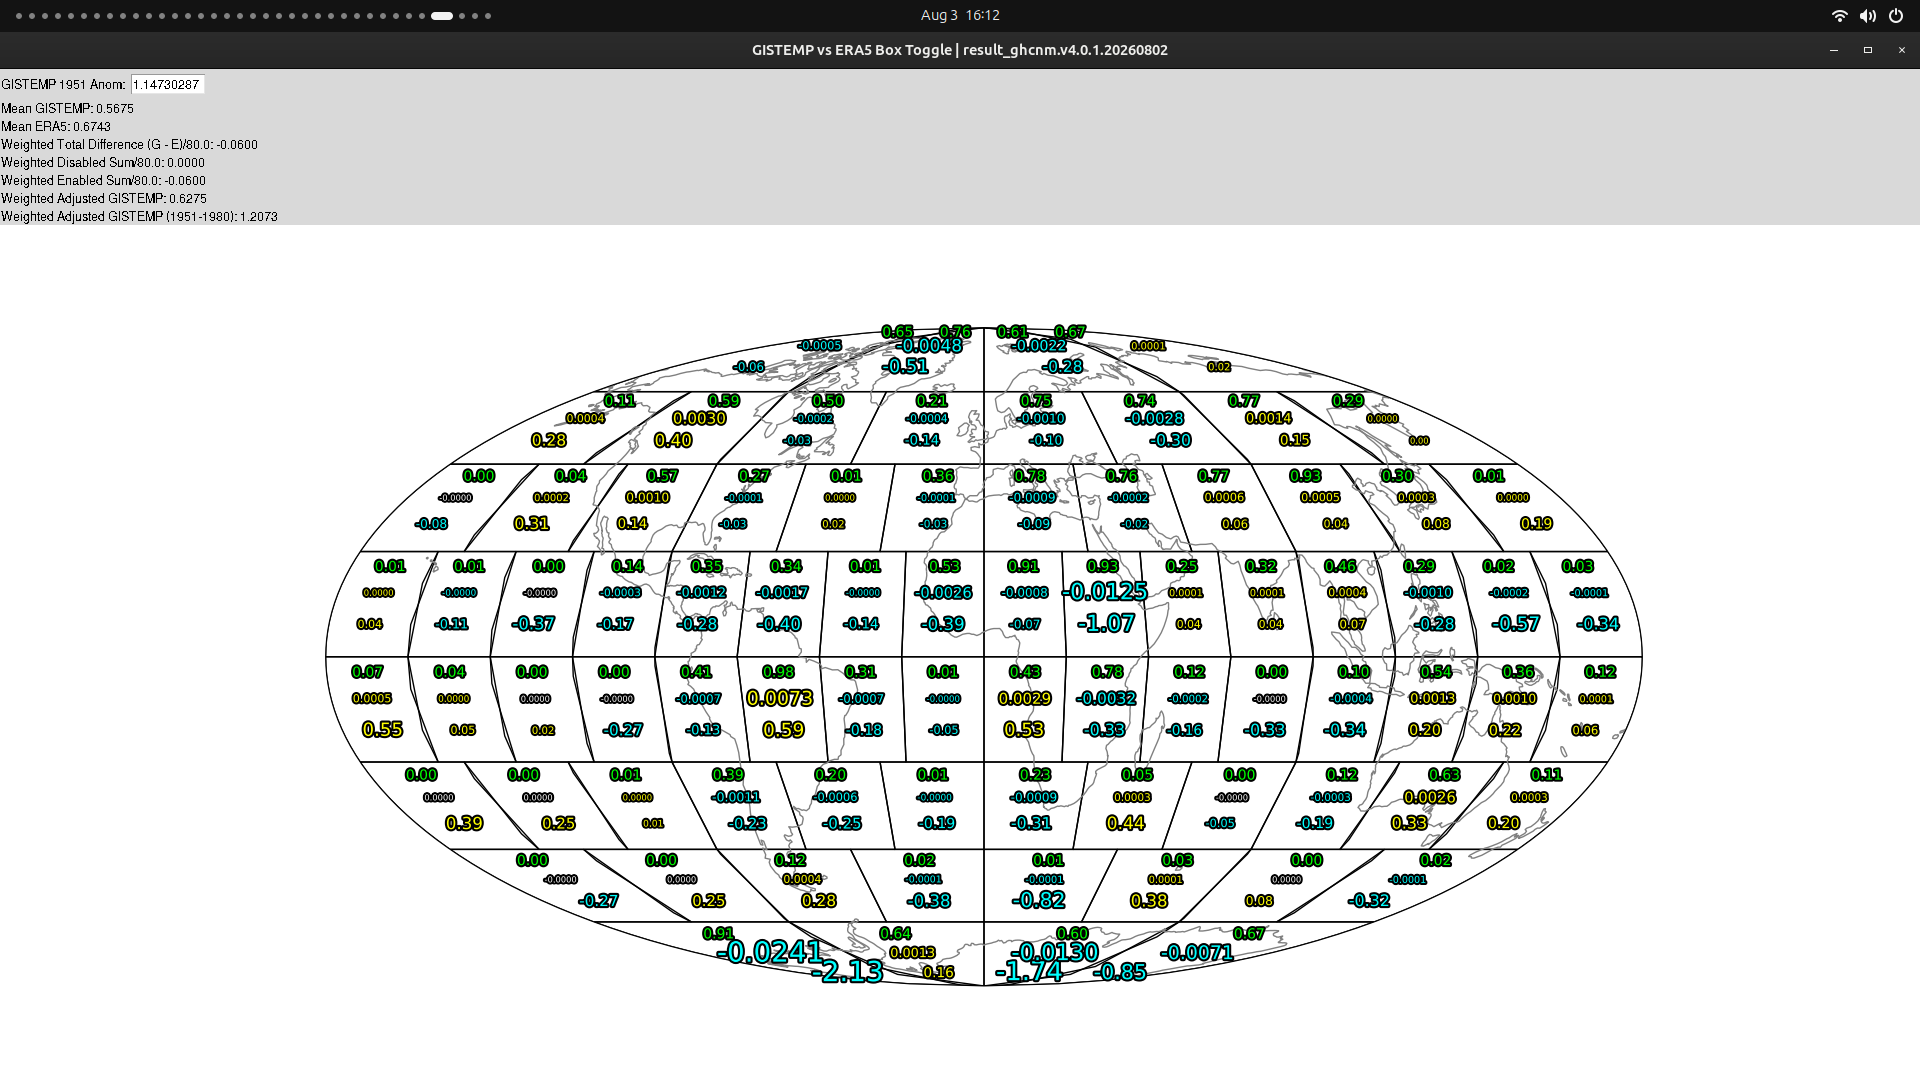
without weights... the difference of the global mean is:
G - E = 0.5675 - 0.6743 = -0.1068
This is a large gap... We need another ~ +0.05 C to even reach the 1.195-1.245 bin edge though presently.
Weighted (using a too aggressive set of weights -- i.e. more stations than will be available in the leading month):
G - E = -0.0600 (that is GISTEMP(ghcnm20260802) - ERA5(ERA5 to july 28, and superens adjusted to ERA5 for rest of july)
i.e. suggesting GISTEMP rising to around 1.2073 (enough to reach the next bin with a margin of about 0.012 C (naively this is not a large margin)
Looking at the gistemp boxes suggests that the biggest deltas remaining are warming deltas with the exception of the Brazil box (where GISTEMP is infilled warmer than ERA5 presently).
The key areas remaining for warming are:
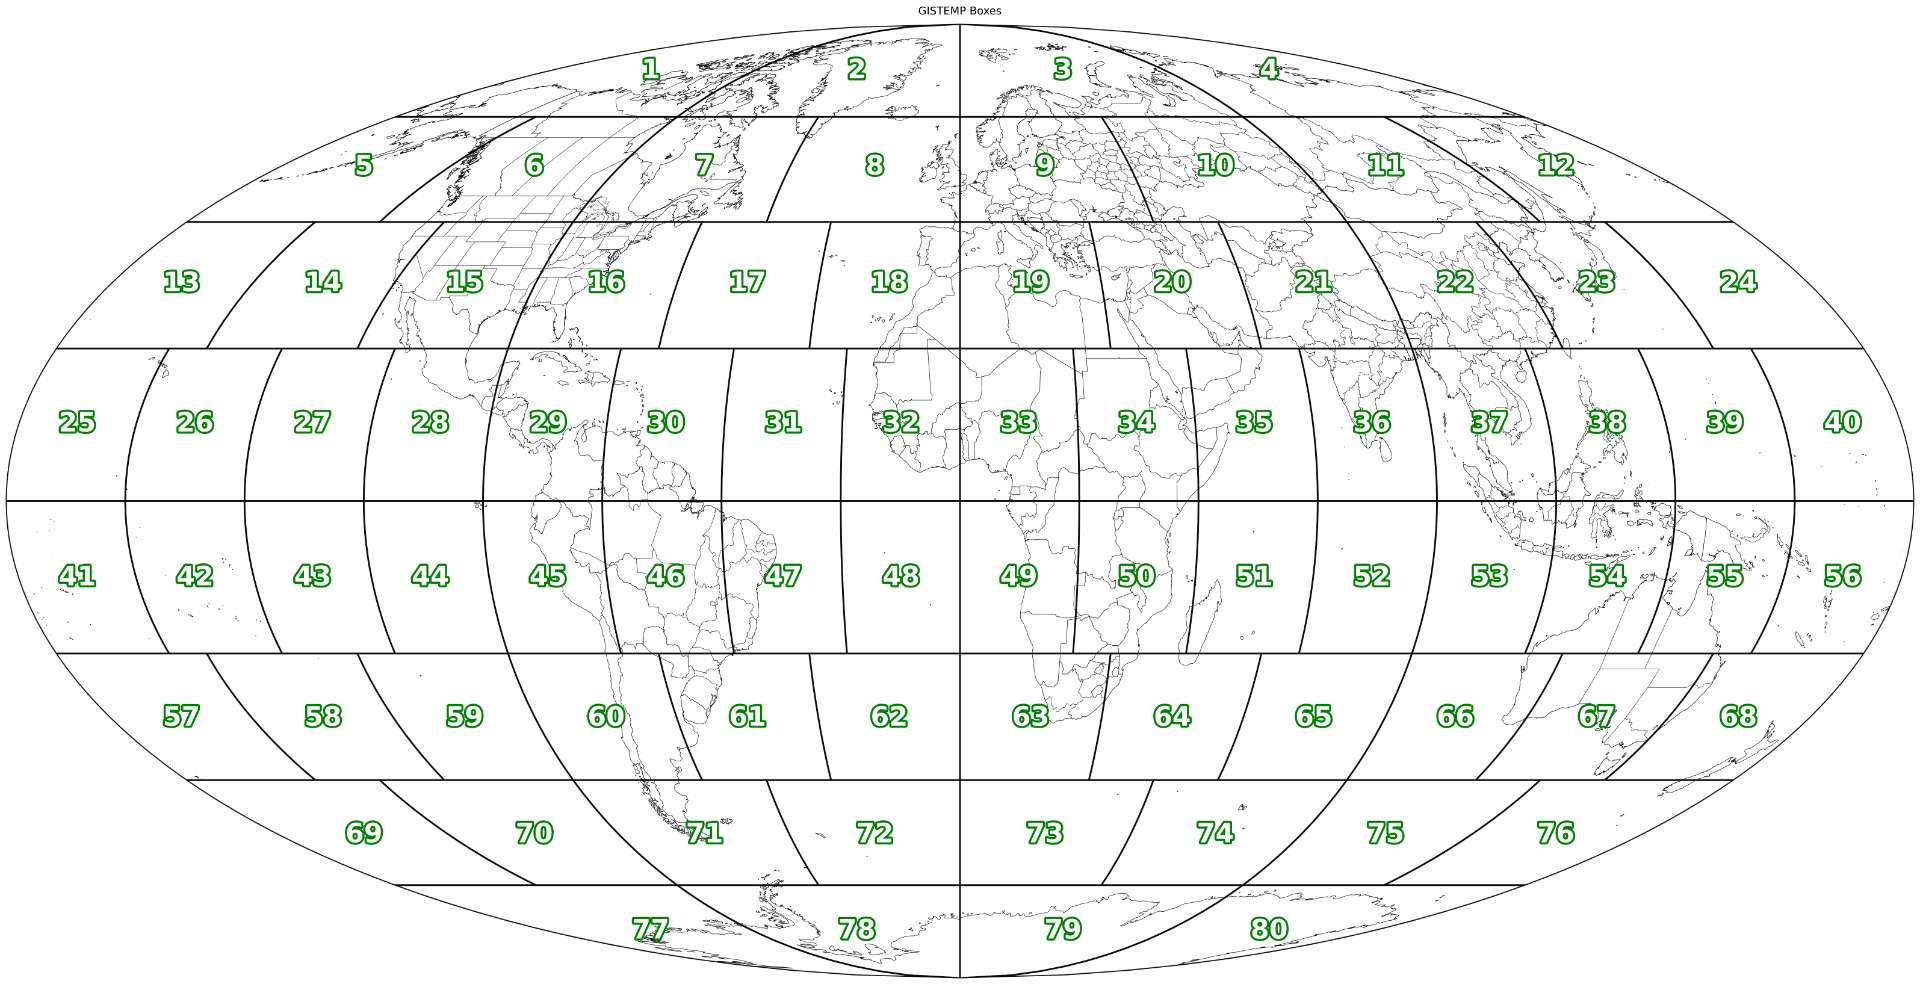
Antarctica: (Elizabeth Station, central Antarctica (near the pole), and eastern Antarctica (missing some expected stations near the coast): i.e. boxes 77,79,80). Regridding+sampling effects means I don't expect the warm anomaly to reach what the gistemp boxes suggest (although I did note how warm Elizabeth station was for a few days last month).
Africa Box 34: of the stations still expected in the box (and to infill from outside the box through more distant subboxes), (if we don't get Uganda/Rwanda stations in time (which we likely won't based on the last few months)) the subboxes will be based more on stations from NE of the box in SW Saudia Arabia, and a sparse few from westwards in the CAR and Chad. Notice in ERA5 the hottest is is centered near the region bordering Sudan/South Sudan/Ethiopia. The lack of stations explains its currently infilled colder value in GISTEMP but I do not expect the warm anomaly to reach what ERA5 suggests in the gistemp_boxes product precisely because elsewhere the sampling of stations from GISTEMP will be on average cooler than the ERA5 box anomaly itself.
For the north pole (box 2): Greenland looks fairly homogenous so I do some warming once the rest of its data comes in (we are unlucky to get the sampling presently from the couple cold samples from NW Greenland and the single sample of western Iceland, as eastern Iceland looks warm in ERA5 (although there will likely be 2 more from western Iceland that are cold, and only one from Eastern Iceland) so the amount of warming will be reduced). Although Svalbard is in the next box over since its close enough for regridding/infilling to effect it and hasn't come in yet it looks like it actually might cool marginally box 2 when it does come in. So net change from remaining stations should still be warmer but again likely not as much as ERA5 indicates.
For cooling there only seems to be Brazil (box 46): Since we already got the warmest samples we will likely see from South America (namely from Paraguay) we SHOULD definitely expect some cooling for this box (based on the anomalies from ERA5).
An important unknown that is not covered by the gistempboxes is box 45, as coastal Peru looks warm in the zoomed in plot of ERA5 (NINO1+2 are very anomalously warm now so its not clear how warm it is since the resolution isn't that high to distinguish the land points from the ocean), and also inland ERA5 is presently going to bias the delta colder than what it will be, since the inland won't be represented by GISTEMP stations.
If coastal Peru is not a factor it seems (subjectively based on the above) overwhelming likely we will end up near the bin edges or possibly in the 1.145-1.195 bin for GISTEMP. The normal best models I use are near 1.21 though. It is only the old, simple linear model that is pushing it up to 1.22. This suggests there is reason to believe it could still end up in the 1.145-1.195 bin despite my best plain consensus model estimate of 1.2196.
Edit: I add the box id plots for reference in case its not clear:
==
The above is reason enough to continue betting up that lower bin (1.145-1.195) as I have been previously based on the same probabilities suggested by the same model (despite having too small a position in the 1.195-1.245 bin), but not enough to bet up the other bins (the 1.245-1.295 bin seems out). I'll keep my positions elsewhere as is (as the 1.245-1.295 bin is only a sale value of ~50 mana).
Point estimate (old, delta2 method, loti3 method) adjusted by prediction error mean: 1.2439, 1.2112 1.2143
Point estimate (mix), pre-adjusted by member prediction error mean: 1.2196
===
Edit3: (Revised below edit as I was not thorough enough in the anomaly calculations and considering the impacts from box 80, and box 78 on box 77).
The ERA5 box anom for Elizabeth is +0.66 C. While the station anomaly is -0.60 C. The current GISTEMP box anomaly is -1.48 (biased from box 80). So GISTEMP relative to Elizabeth(ERA5) is currently G-E = -1.48 - (-0.60) = -0.88 C
That means with a future Elizabeth sample where this validates (what ends up in ghcnm processed/debiased in GISTEMP etc), the Elizabeth contribution (all other things being equal) would suggest an increase of up to +0.88 C (no where reaching the current 2.13 C difference alone). However, there are still a few stations I think along the Eastern Antartica that are to be expected, and based on the ERA5 plots these could have warm anomalies (despite most of the present ones currently cold/neutral) as ERA5 shows this could the case since there is a sliver of warm anomaly there, so that delta potential up to +0.88 C could increase some more (but not too much since there are already stations in Box 80, as well as Box 78 that will stabilize the Box 77 anomaly to some extent, with Box 78 going to be mixed cool/warm station anomalies).
Regardless, this supports much less warming in box 77 than above indicated if this validates.. (even if the box raises 1C it will only be (from latest run) a global +0.0114 C change (1/80 * 0.91 (the weight)) rather than a global +0.0241 C change contribution, for global a net change (compared to latest run of) of 0.0114 - 0.0241 = -0.0127. I said earlier the margin was around 0.012C, so this would eliminate that margin and put us near the bin edge.
python3 point_forecast_month.py 2022 2026 7 -82.6170 -137.0830
--- Monthly t2m mean point forecast ---
Target Month: 07 (2022-2026)
Lat/Lon: (-82.617, -137.083)
Climatology (ERA5, 1991-2020): -32.6 °C
Target month anomaly (1991-2020): [4.5, -2.2, -1.4, -6.1, -0.6] °C
Point forecast (absolute): [-28.1, -34.8, -34.0, -38.7, -33.2] °C
----------------
@zzd1246739271648 You're referring to the internal CMB one here (AFAIK that's an internal one used by NCEI):
https://www.ncei.noaa.gov/pub/data/cmb/ersst/v5/netcdf/
I don't know why they are still doing runs of it (maybe its on purpose for diagnostics, maybe someone has asked them to extend it, or maybe they haven't gotten around to updating their cron jobs etc).
The official dissemination link for for v5 hasn't disseminated it for July though, but it has for v6:
https://www.ncei.noaa.gov/data/sea-surface-temperature-extended-reconstructed/v5/access/
https://www.ncei.noaa.gov/data/sea-surface-temperature-extended-reconstructed/v6/access/
While PSL has disseminated/updated their aggregated product v5 for July but not yet for v6.
https://downloads.psl.noaa.gov/Datasets/noaa.ersst.v5/
https://downloads.psl.noaa.gov/Datasets/noaa.ersst.v6/
I'm sure based on the GISTEMP fortran code they use the NCEI monthly netcdf for the data but I do not know for sure which dissemination source they actually use (the internal CMB one or the official one) -- though I would guess the official one.
Based on the PSL data notice (assuming it was not in error) I would still expect the NASA/GISTEMP team to update to ERSSTv6 given how trivial a change it is in the code. There is nothing on the GISTEMP home page but they usually only update it once a month anyway after each month's release.
result_ghcnm.v4.0.1.20260803
115.84679571077199
~120 stations added resulted in an increase of ~ 0.011 C over yesterday's run (it's fairly large considering how few stations were added).
GISTEMP plots:
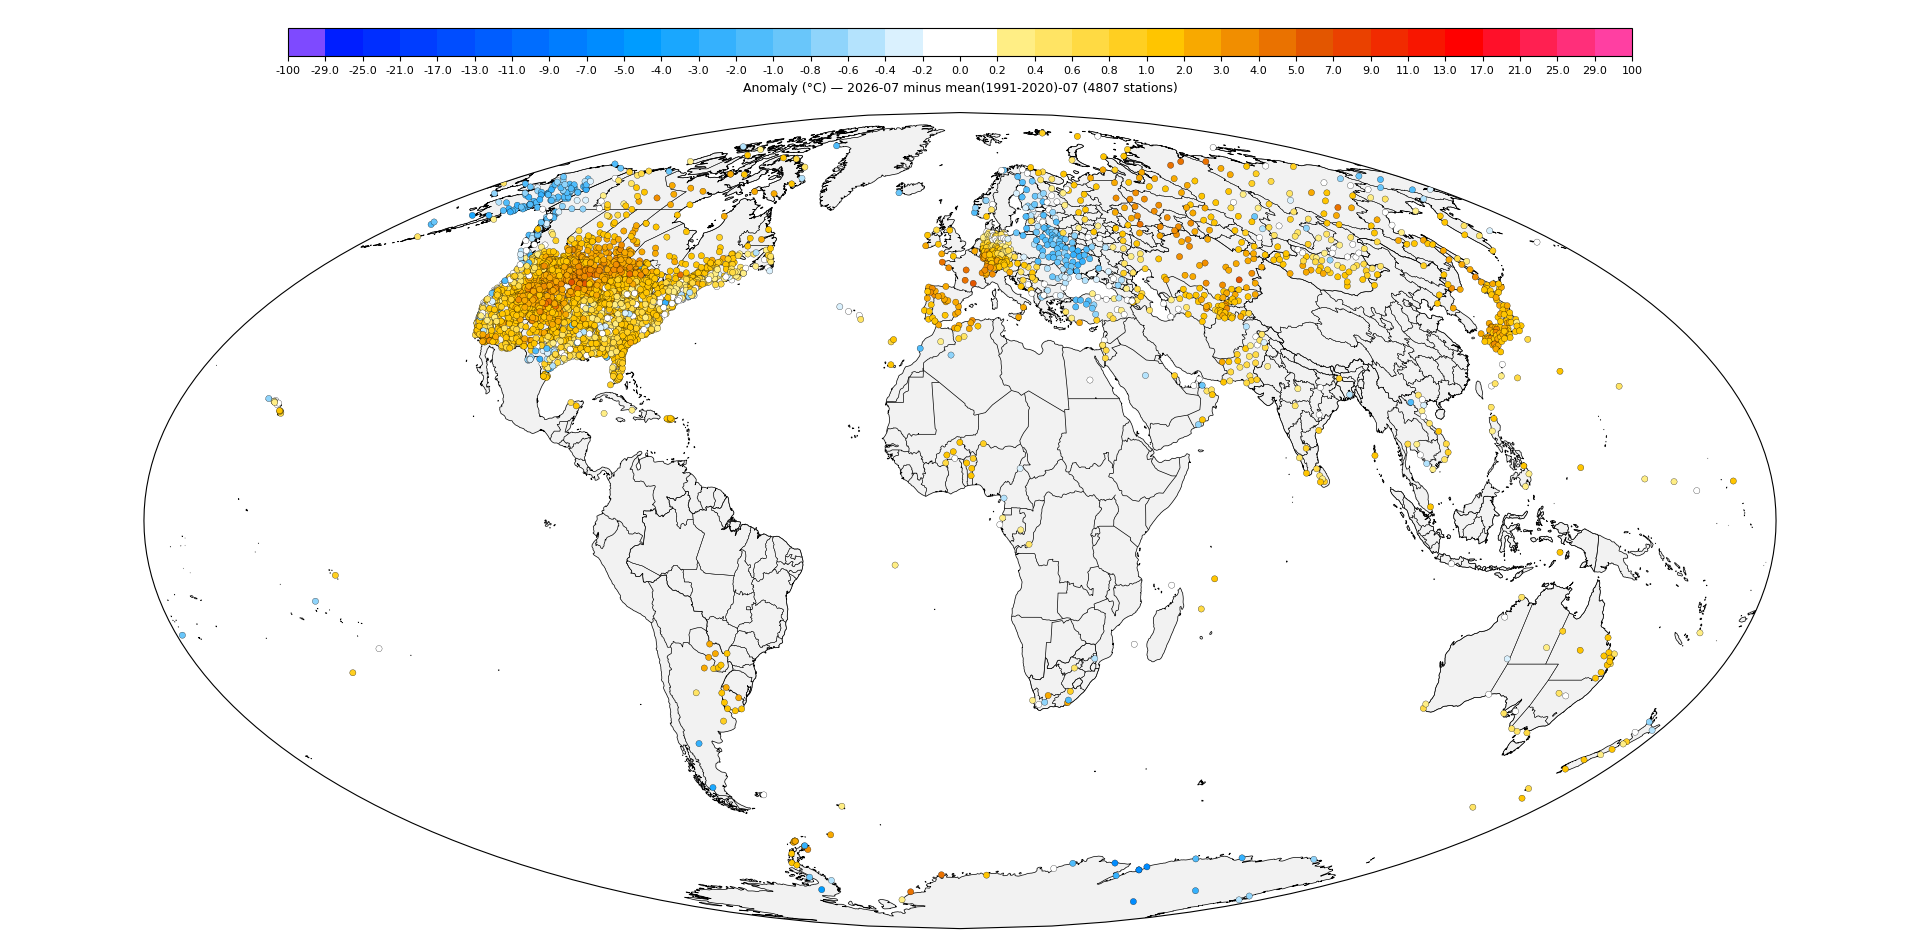
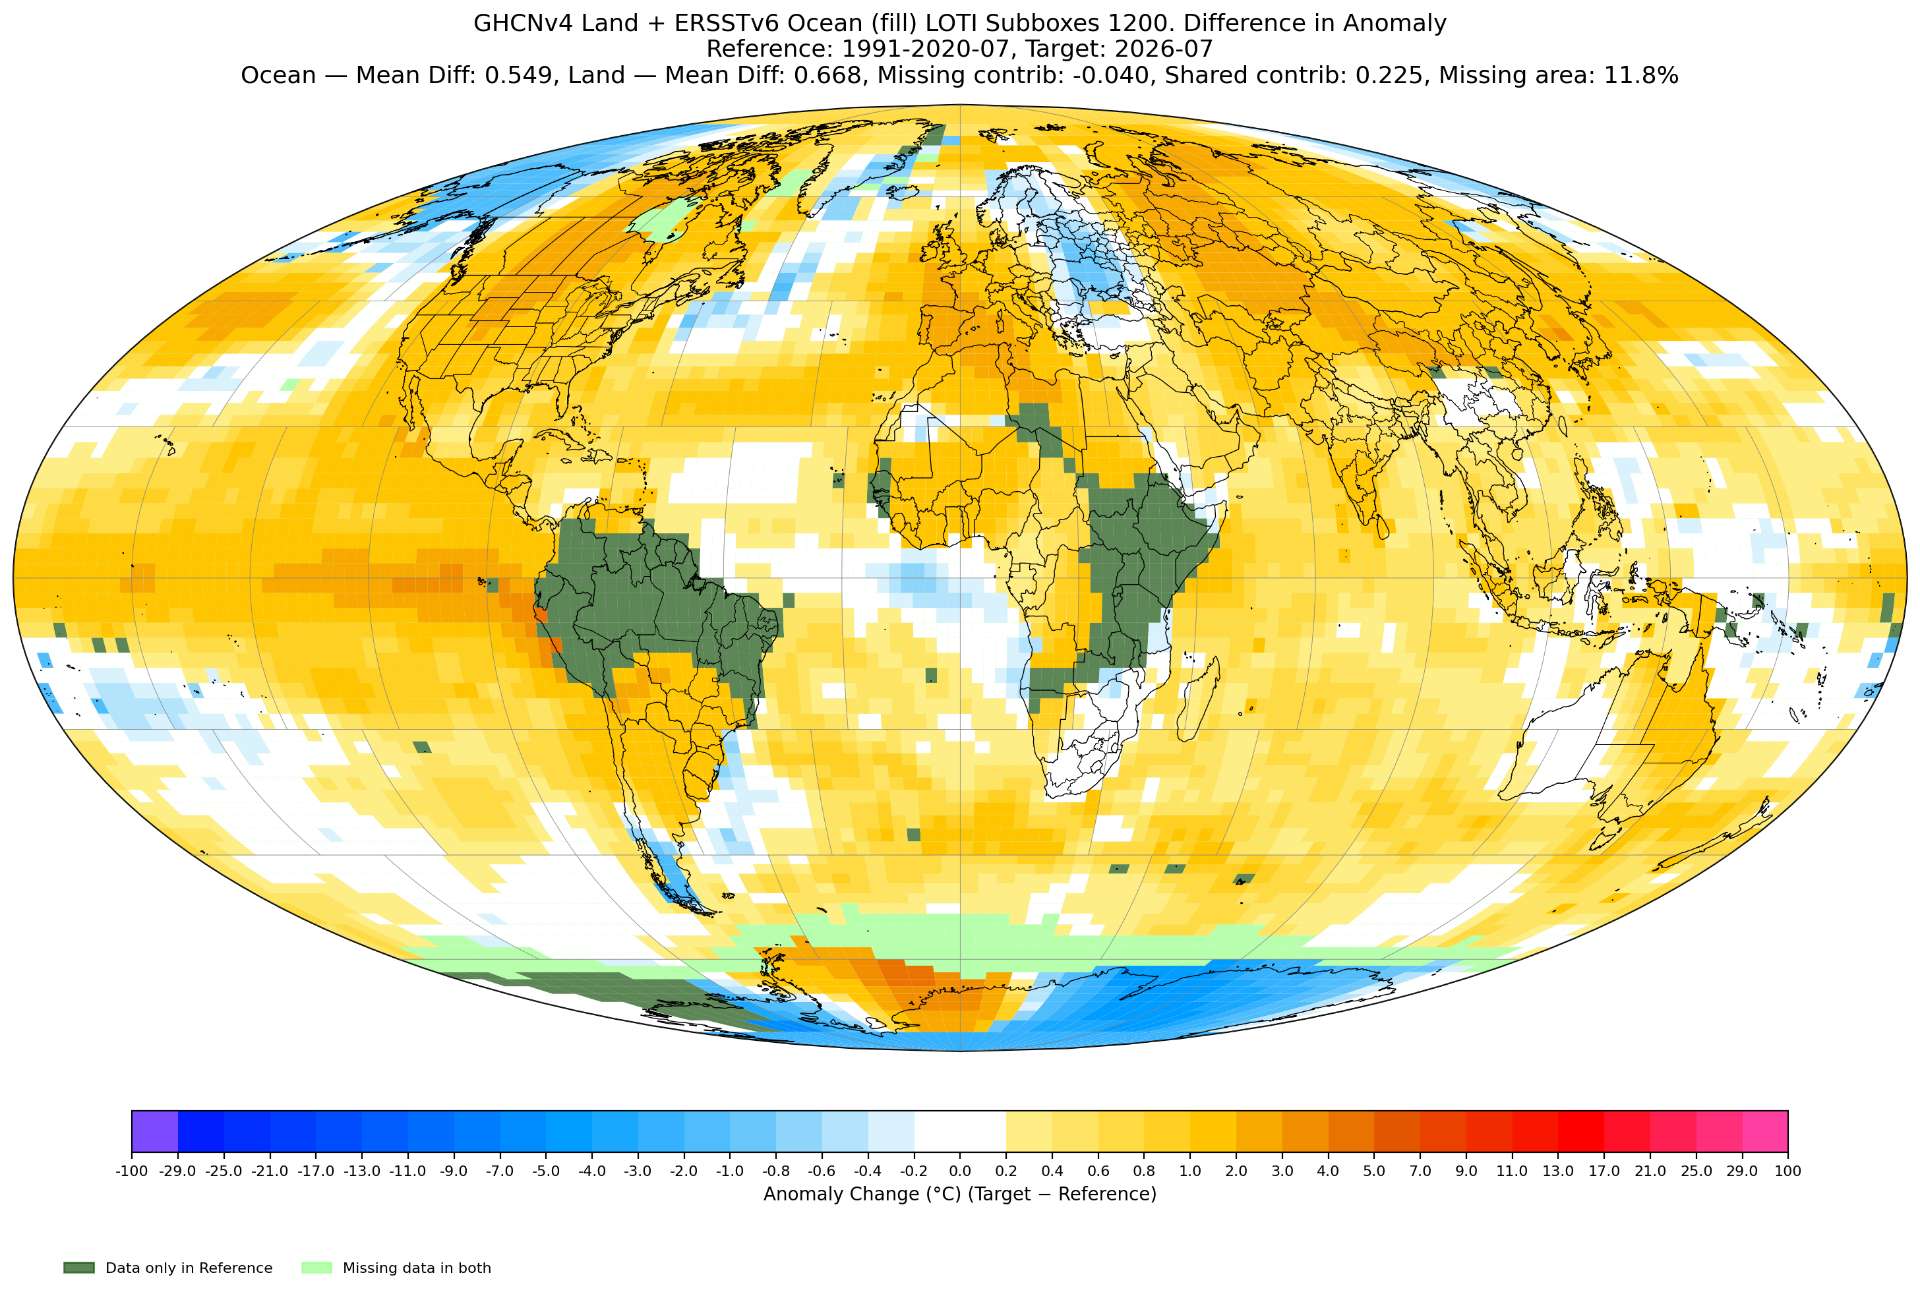
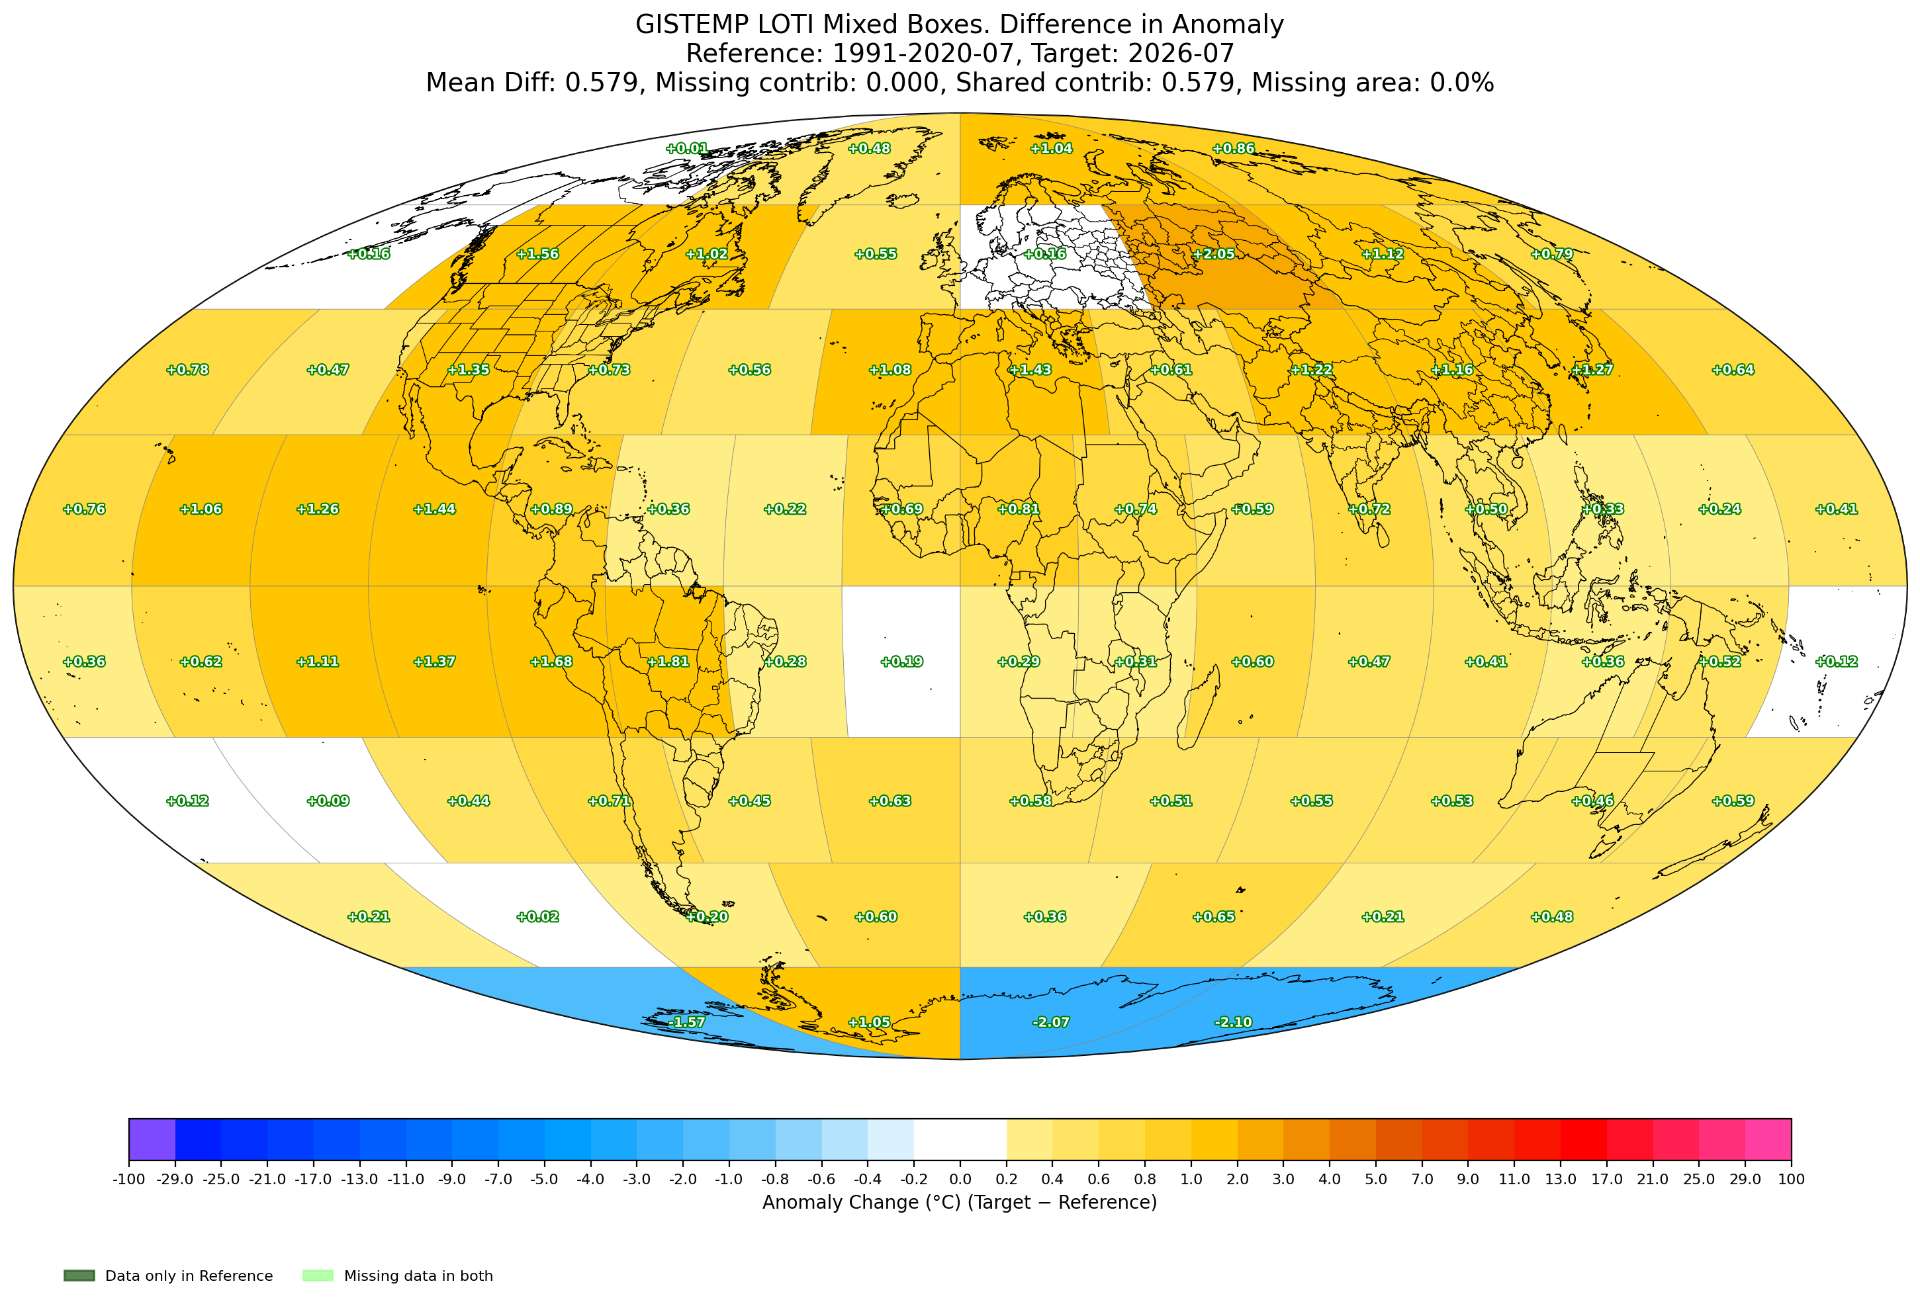
~
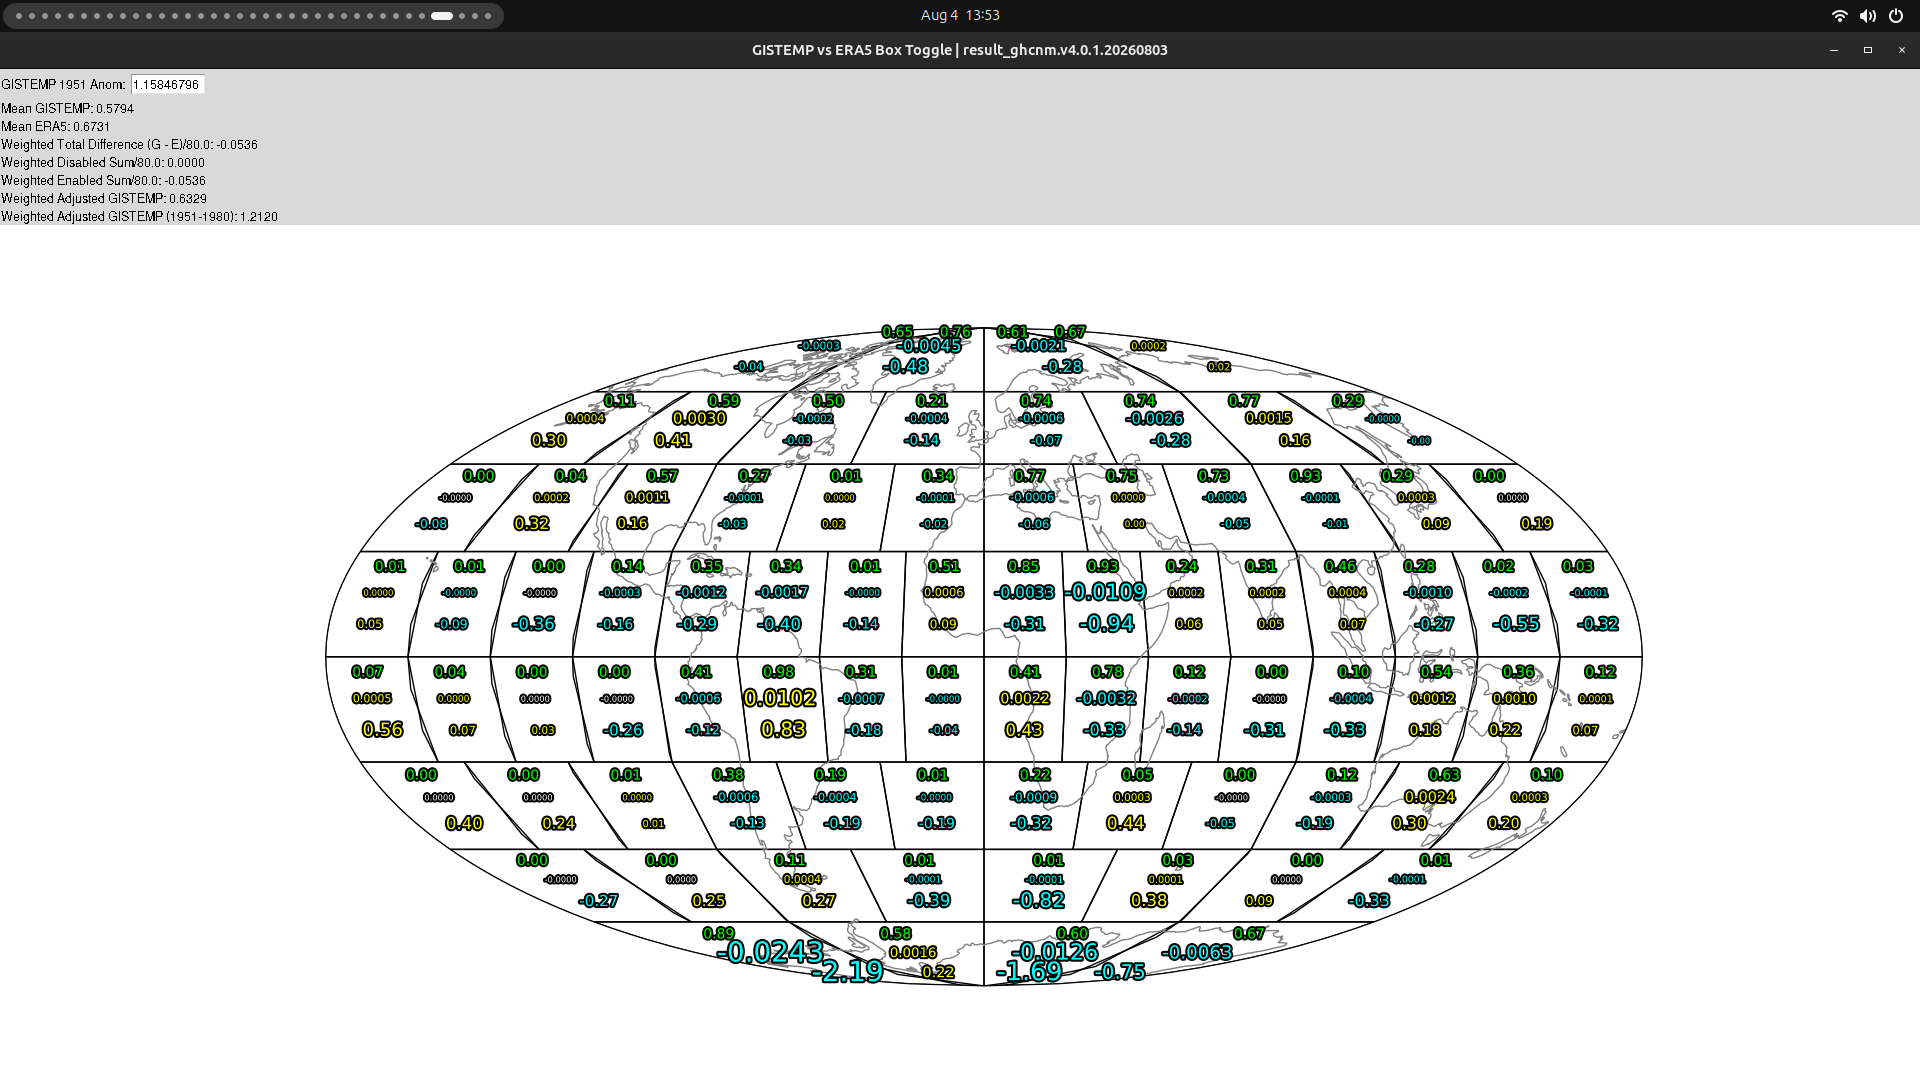
Given the above/below change and the weighted gistemp toggles box program now showing a slightly larger margin (+0.005 from yesterday) my guess is to sell given that the probabiltiies from the model itself only support up to 12% for that bin even though subjectively I think it could be higher since I have experience from last month that it is anchoring the value to the higher ERA5 value and I know that the weights are likely also overdone (meaning not all of the further +0.0536 C change should be expected). So, I'm going to continue holding as usual, but I'm less confident it will be near the bin edge so I've sold some based on that.
As far as I can tell the revisions and new stations in Antarctica ended up (mostly) canceling each other out (even if the changes were like + or - 0.09C for the box) across the boxes (box 77 cooled by as much as 80 warmed, with 78 only marginally warming ~ 0.06C for its box which isn't significant globally).
The boxes that did most significantly change include:
1) Box 46 (Brazil): Increase of +0.24C for the box since yesterday (+0.003 globally) C. It got biased even more warm with stations from Uruguay.
2) Box 32 (West Africa): Increase of +0.47 C for the box since yesterday (~= 0.006 C globally). Most of the warming came from this box yesterday. It got warmer as it got various more stations, but is very close to the ERA5 anomaly now (so less biased) (weight looks overdone though now for leading month but is inconsequential if it remains so close to ERA5).
3) Box 34 (East Africa): Increase of +0.17 C for the box since yesterday (~= 0.002 C globally), from 0.57 to 0.74 C. This was a real puzzler in different ways. A couple stations' anomalies appeared to be revised downwards (like KHARGA) from my station plotter since yesterday (in actuality the absolute temperature rose slightly but it's own baseline especially further back got raised so the anomaly decreased). Even accounting for this the actual subbox plot shows a drastic difference from this towards the middle of the box for my expectations based on this, especially with the subboxes associated with KHARGA warming instead -- from this I must conclude that stations (other than KHARGA) not present in July 2026 were revised such that in past Julys the overlapping periods (or even their larger own baseline periods) with KHARGA baselines shifted significantly upwards relative to KHARGA (much warmer than the +0.3 to +0.4C 1961-1990 baseline that KHARGA got shifted, as this should have reduced its anomaly), resulting in KHARGA contributing subboxes becoming warmer via the debiasing&stitching done in the step3 combine(). We had one new station obviously in the box that was warmer (but that did not reach subboxes like 3383 where KHARGA is the only contributor), but also stations a bit further away (outside the box) were also warm that likely contributed to -some- warming of the subboxes. Most of the warming looks like it came from the subboxes in the middle and the NW part from some combination of GHOR_SAFI being added and MULGA. Not exhaustive list: (I realize that for day to day comparisons in change in anomalies for GHCNm, with the 1991-2020 baseline being plotted it can be misleading since the anomaly is calculated in GISTEMP relative to 1961-1990 for the step5 subbox->box step.
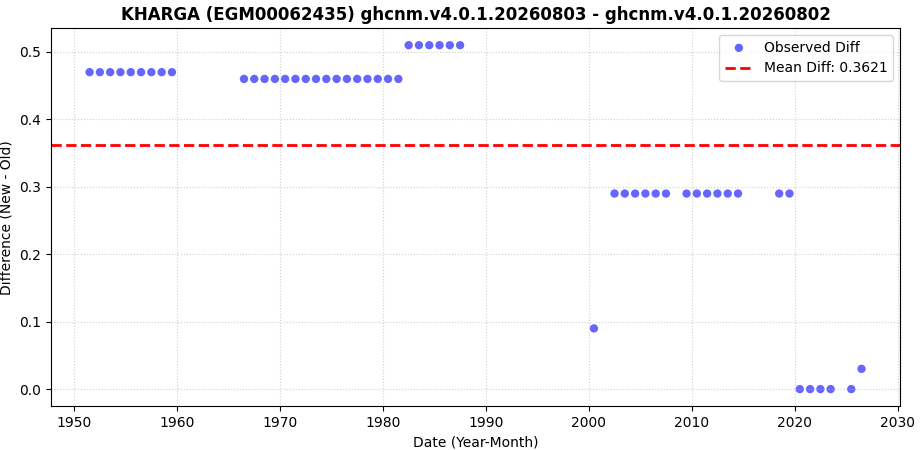
some of the stations contributing to box 34 and their 1991-2020 station anomalies:
Elev. (m): 73.0, Station: EGM00062435, Name: KHARGA
LAT/LON: 25.45/ 30.53, Value: 33.80, Anomaly: 0.02, Last30yrs -> mean: 33.26, min: 30.70, max: 35.30, std: 1.11
Elev. (m): -350.0, Station: JOM00040296, Name: GHOR_SAFI
LAT/LON: 31.03/ 35.47, Value: 35.73, Anomaly: 0.65, Last30yrs -> mean: 35.22, min: 34.10, max: 36.50, std: 0.64
Elev. (m): 242.0, Station: CMM00064860, Name: GAROUA
LAT/LON: 9.34/ 13.37, Value: 27.90, Anomaly: -0.35, Last30yrs -> mean: 26.83, min: 25.24, max: 29.72, std: 0.79
Elev. (m): 2.0, Station: BA000041150, Name: BAHRAIN_INT_AIRPO
LAT/LON: 26.27/ 50.65, Value: 36.90, Anomaly: 0.94, Last30yrs -> mean: 35.86, min: 34.05, max: 37.85, std: 0.98
(GAROUA filled in 4 new warm subboxes on the western edge (despite it having a cool 1991-2020 station anomaly). Bahrain is further away, contributing 4 (weakly weighted) subboxes to box 34 (which only has 41/100 subboxes filling it in presently) made warmed the existing subboxes from cooler & higher elevation GASSIM in SA to make them less cold. Most of the warming though I'd guess is actually from revisions to stations not shown in the mapper.
Other boxes only changed by <= 0.10 C for each box (Box 60 for instance influenced by Uruguay is increased also +0.10 C, which globally this is only ~ 0.001C so I didn't analyze them).
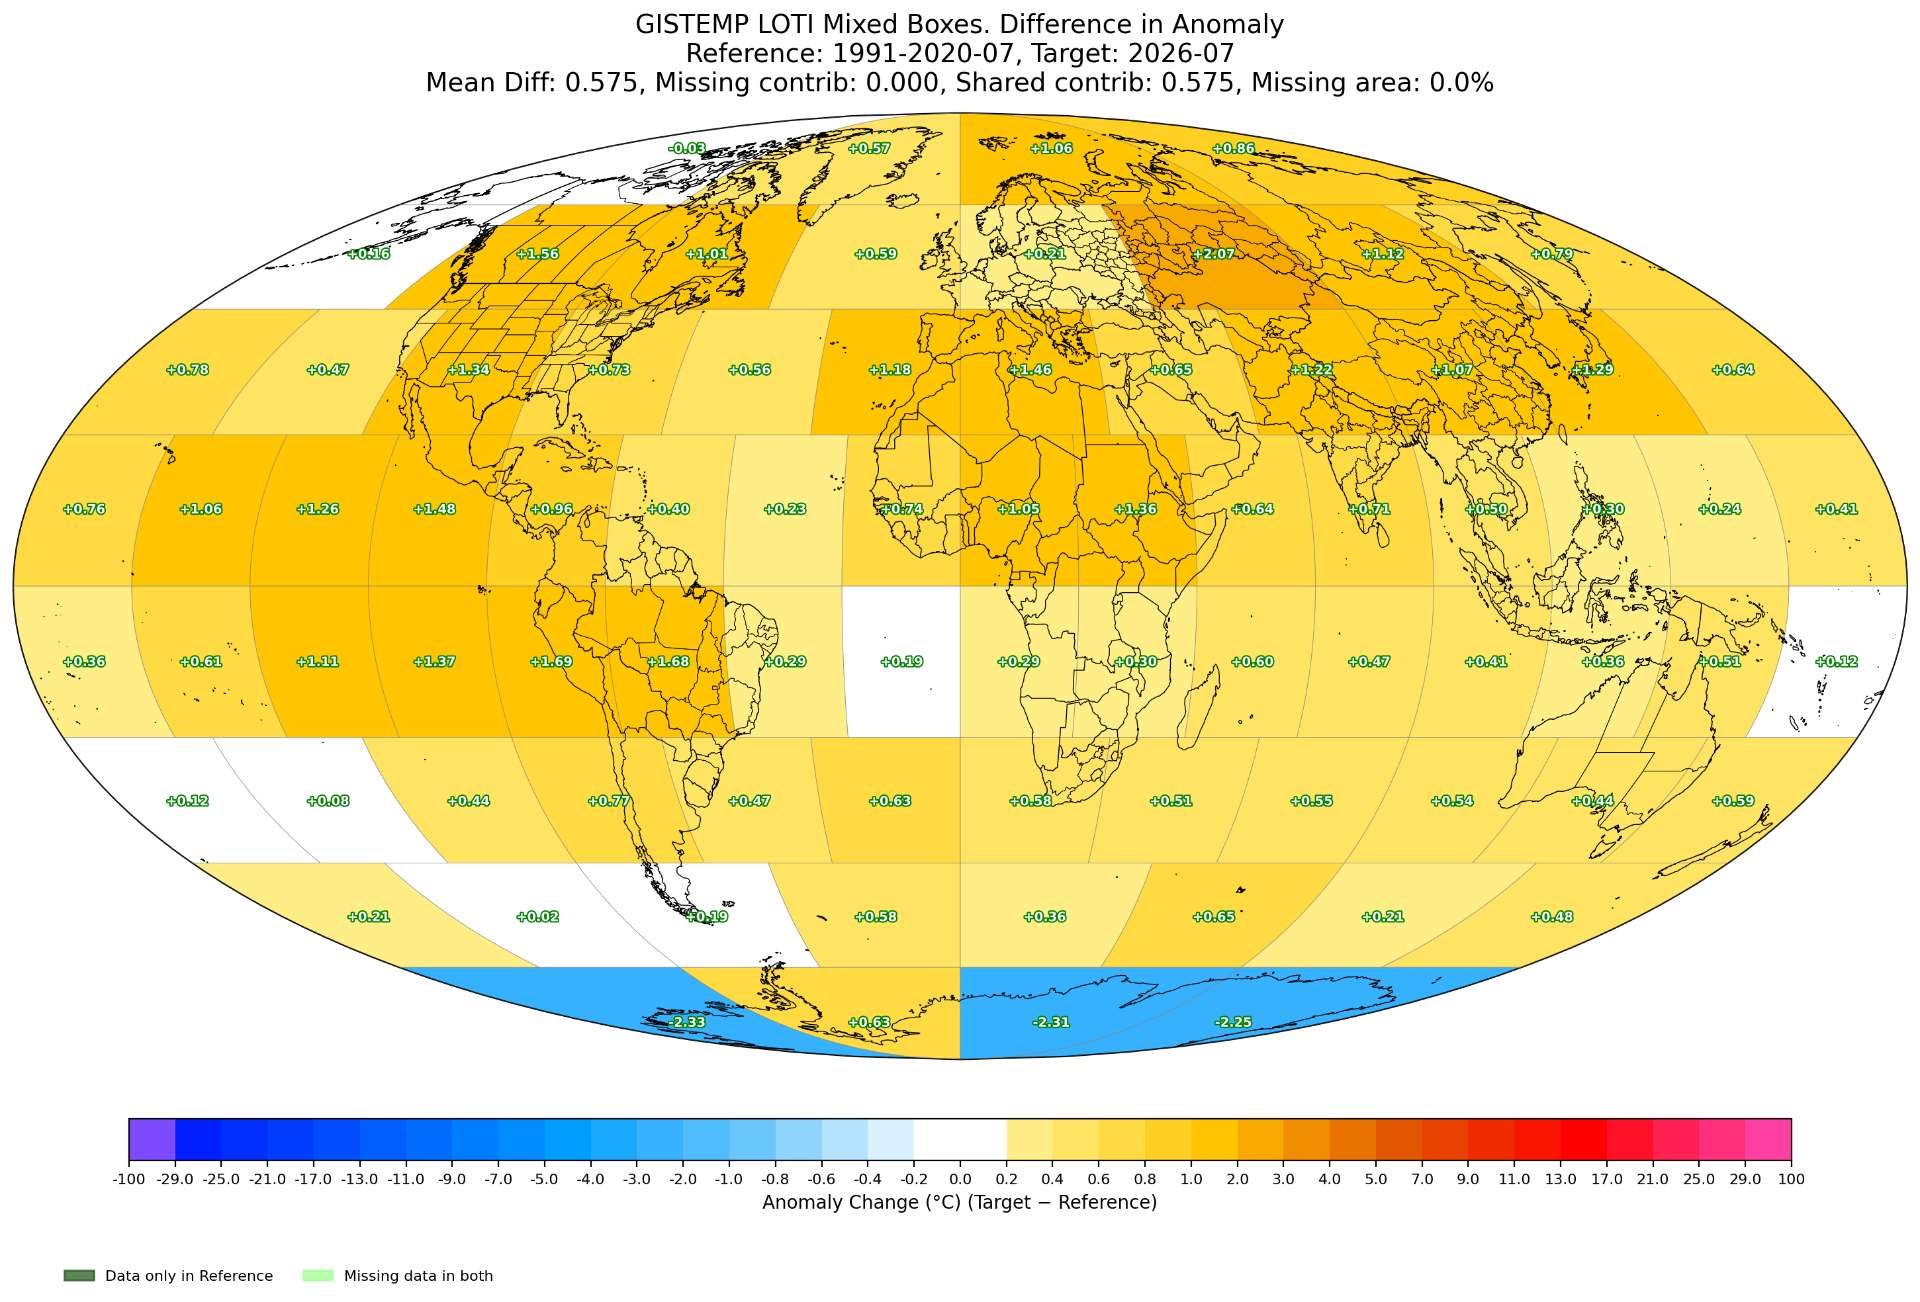
result_ghcnm.v4.0.1.20260804
115.90825600919163
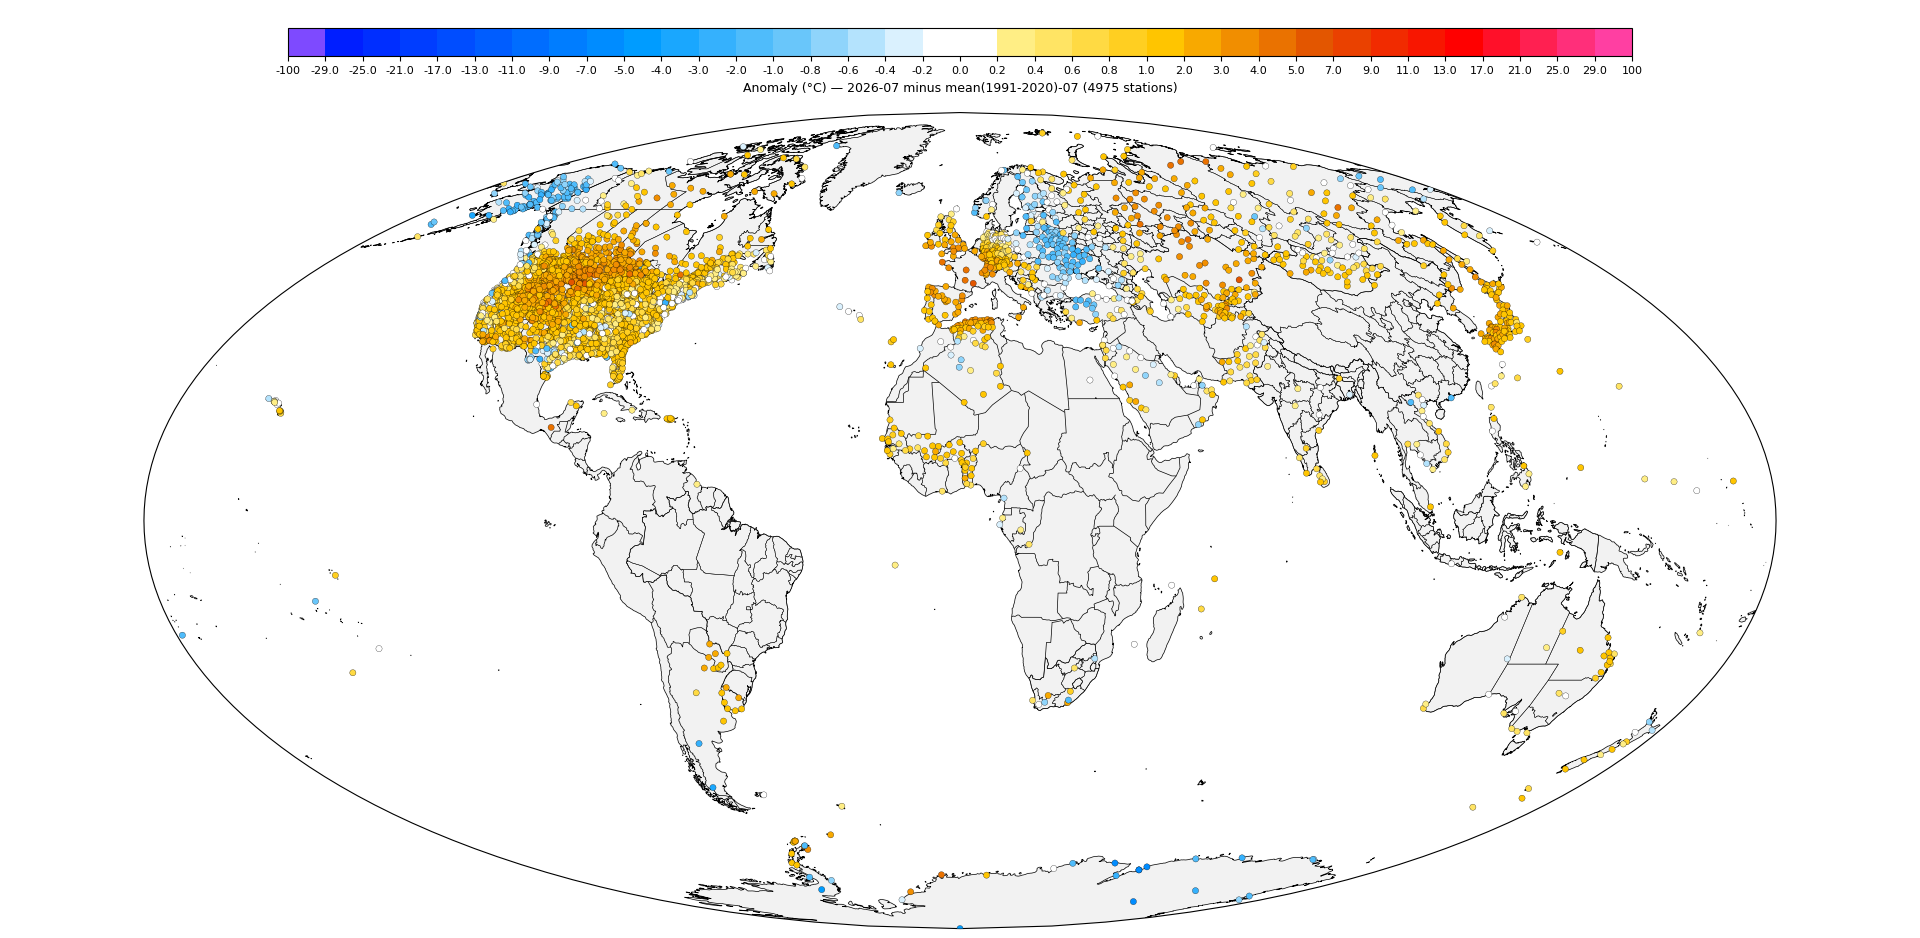
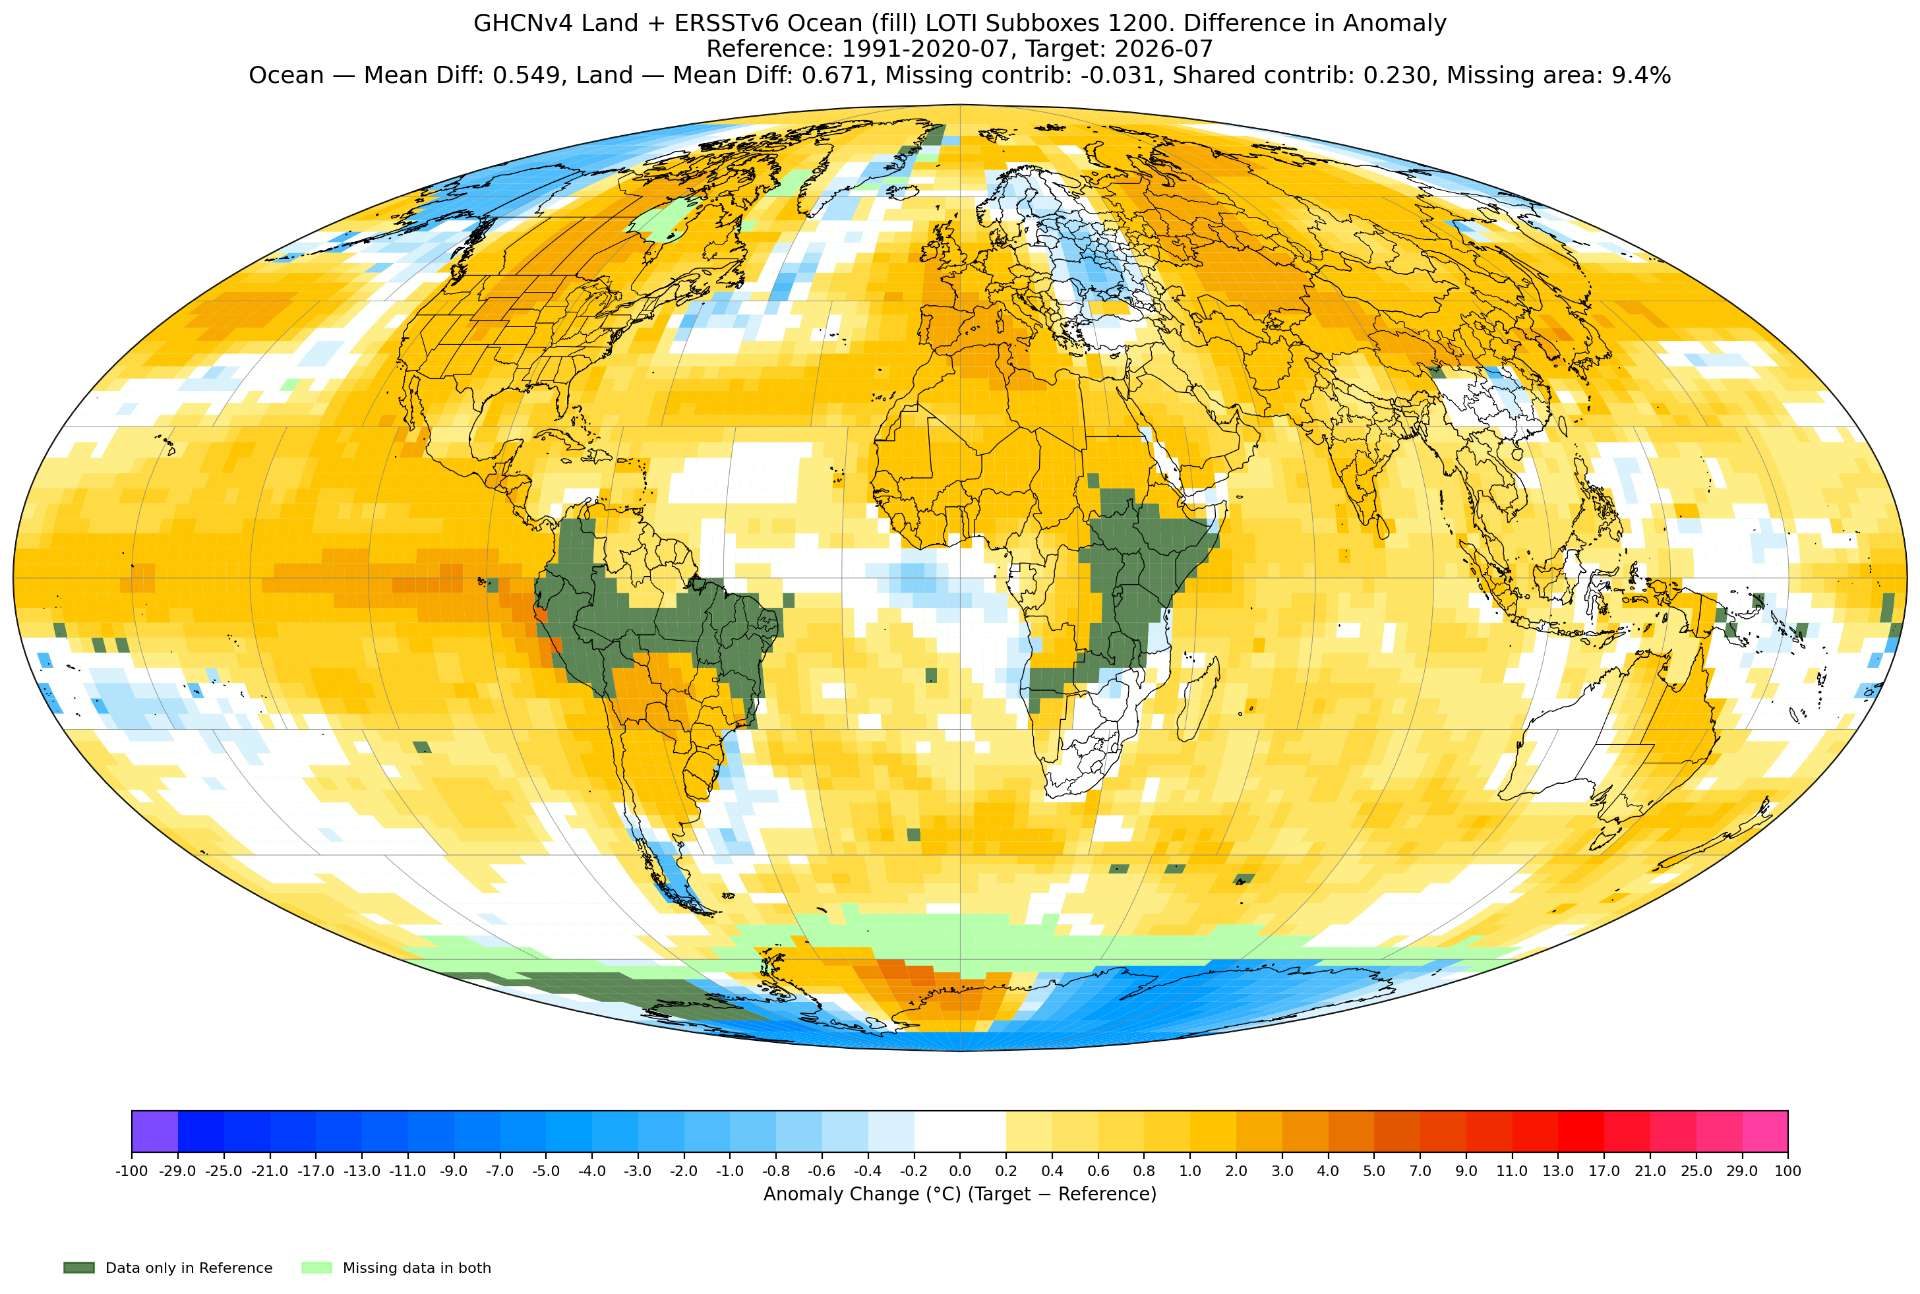
~
Global anomaly only rose by about 0.0006 C from yesterday's run, with 168 more stations added.
Scheduled release date is Tuesday (Aug 11), so they could do the analysis as late as Monday, which would mean ghcnm.v4.0.1.20260804 is the latest one they would end up using (and most likely to me at the moment), although its possible they do the run over the weekend also...
~
The gistemp toggle box program suggests now an anomaly of 1.2162. Still in good agreement with the other 3 models and their weighted mean (but keeping aware it may be anchoring to them):
Point estimate (old, delta2 method, loti3 method) adjusted by prediction error mean: 1.2441, 1.2111 1.2145
Point estimate (mix), pre-adjusted by member prediction error mean: 1.2196
(One more day of ERA5 gridded data left ...)
And with the analysis below, despite the gistemp toggle increasing another +0.004 C (improving the margin and likelihood we will end up in the 1.195-1.245 bin), nothing suggests changing my betting...
~
A single new station in South America (GEORGETOWN in Guyana) got added that cooled the northern portion of the Brazil box slightly (-0.13 C), while at least 3 stations in Argentia got revised upwards that reduced its effect (adding a somewhat negligible +0.09C total across boxes 60,61,71; some of box 71 warming was reduce by subboxes in Antarctica archipelago cooling).
More Saudia Arabia stations (Box 34), and it really warmed up (+0.62 C from yesterday with the new additions).
More West Africa stations, causing Box 18 to warm slightly (+0.10 C)
more NW and Central Africa stations caused box 33 to warm (+0.23 C)
Some negligible cooling/warming in other boxes (MACAU_INTL in China cooled a couple boxes neglgibily (total -0.09C across the two) as much as the Greenland box 2 warmed from revision to NE Canada & Iceland).
Net for those largest warming contributors is +0.62 + 0.10 +0.23 ~= +0.95 C. It looks like cumulatively there was quite a bit of individually negligible warming, but cumulatively significant on top of that elsewhere (enough to over power Antarctica's cooling).
Quite a bit of cooling all came from Antarctica to balance most of that out, with all 4 boxes (77-80) dropping a total of (0.76+0.42+0.24+0.15) ~= -1.57 C from the result of three new stations, along with around at 7 noticeable revisions (6 of them downwards, likely some from GHCNm PHA and possibly some from new data still).
Specifically two more new Antarctica stations, but it was AMUNDSEN_SCOTT that I suspect really contributed to dropping temps across all 4 Antarctica boxes (77-80) (with no Elizabeth it has an outsized effect on that box):
Elev. (m): 9999.0, Station: AYW00090001, Name: AMUNDSEN_SCOTT
LAT/LON: -90.00/ 0.00, Value: -64.75, Anomaly: -4.50, Last30yrs -> mean: -60.18, min: -67.19, max: -53.45, std: 3.17
Elev. (m): 243.0, Station: AYM00089832, Name: D_10
LAT/LON: -66.72/ 139.83, Value: -20.05, Anomaly: -1.30, Last30yrs -> mean: -18.67, min: -22.78, max: -12.51, std: 2.33
Elev. (m): 69.0, Station: AYM00089065, Name: FOSSIL_BLUFF
LAT/LON: -71.32/ -68.28, Value: -17.16, Anomaly: -1.16, Last30yrs -> mean: -15.13, min: -19.85, max: -11.06, std: 2.47
(Amundsen Scott's subboxes:)
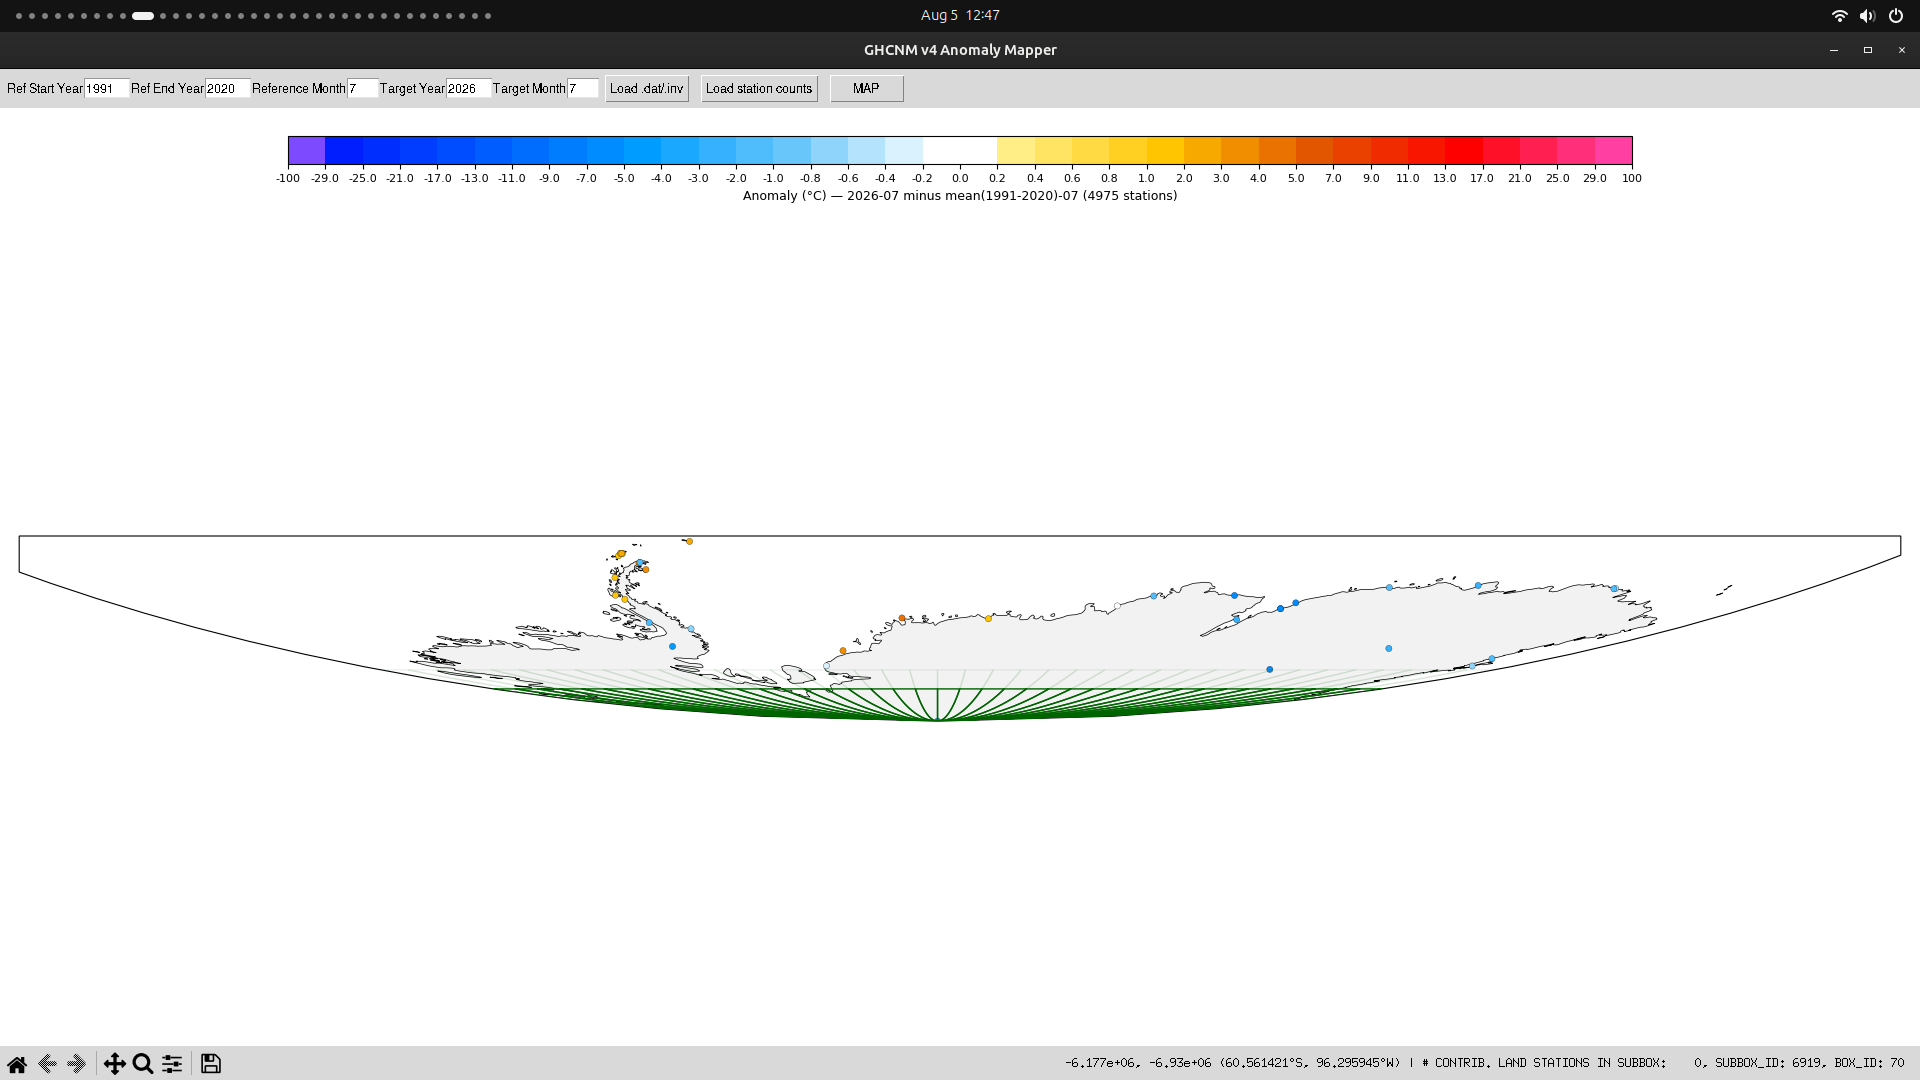
When Elizabeth comes in should reduce the cooling bias quite a bit...
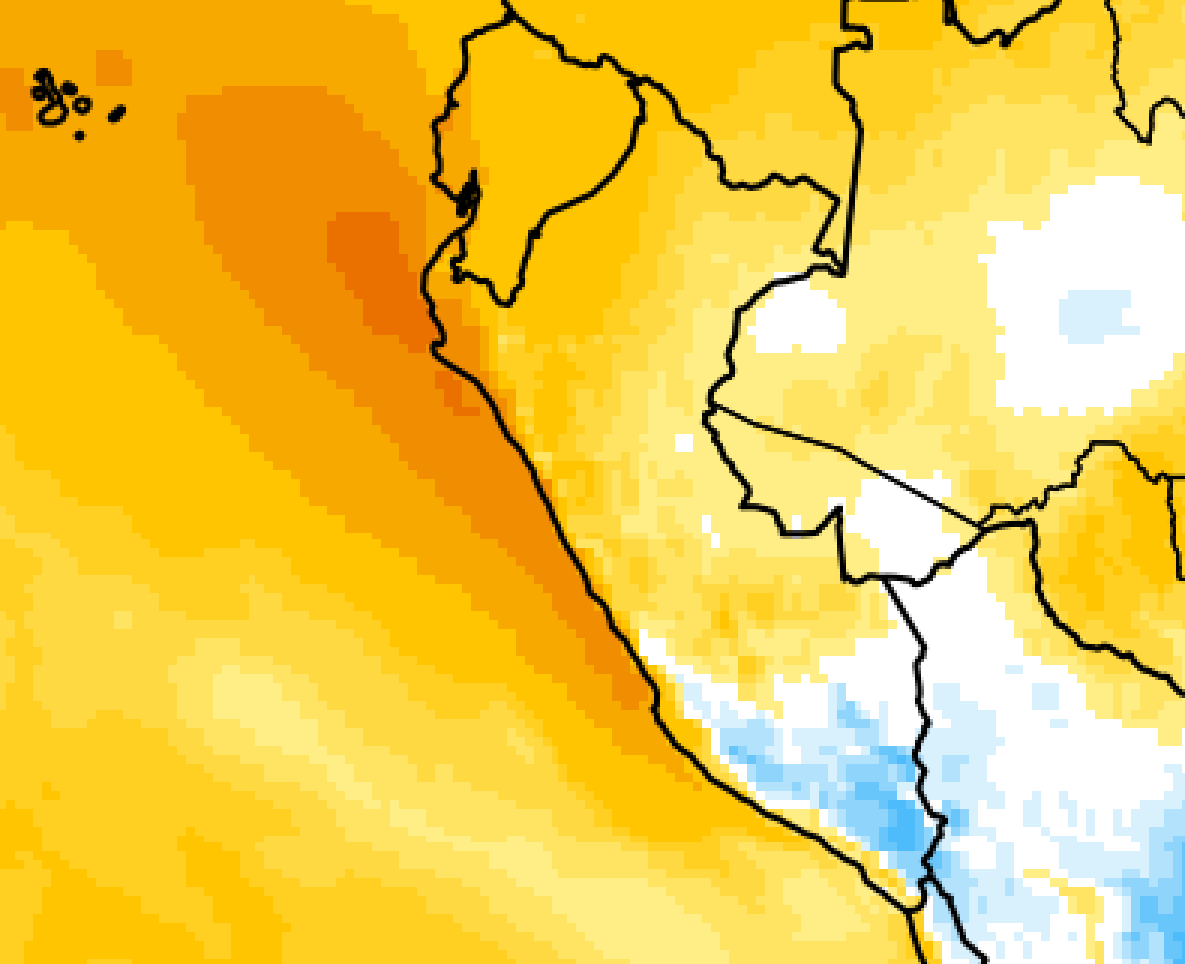
The biggest unknown is still Box 45 (coastal Peru): the toggle box is showing the box temp is comparable to ERA5 (NINO1+2 very hot indeed), but from my experience last month, because of sampling its likely going to warm further relative to ERA5 since cooler inland isn't sampled. It seems too difficult at the moment to judge manually how much warming there will be though since the ocean boxes are already very warm.
Edit: zoomed in on plots of Peru (ERA5 + last day of month is superensemble)
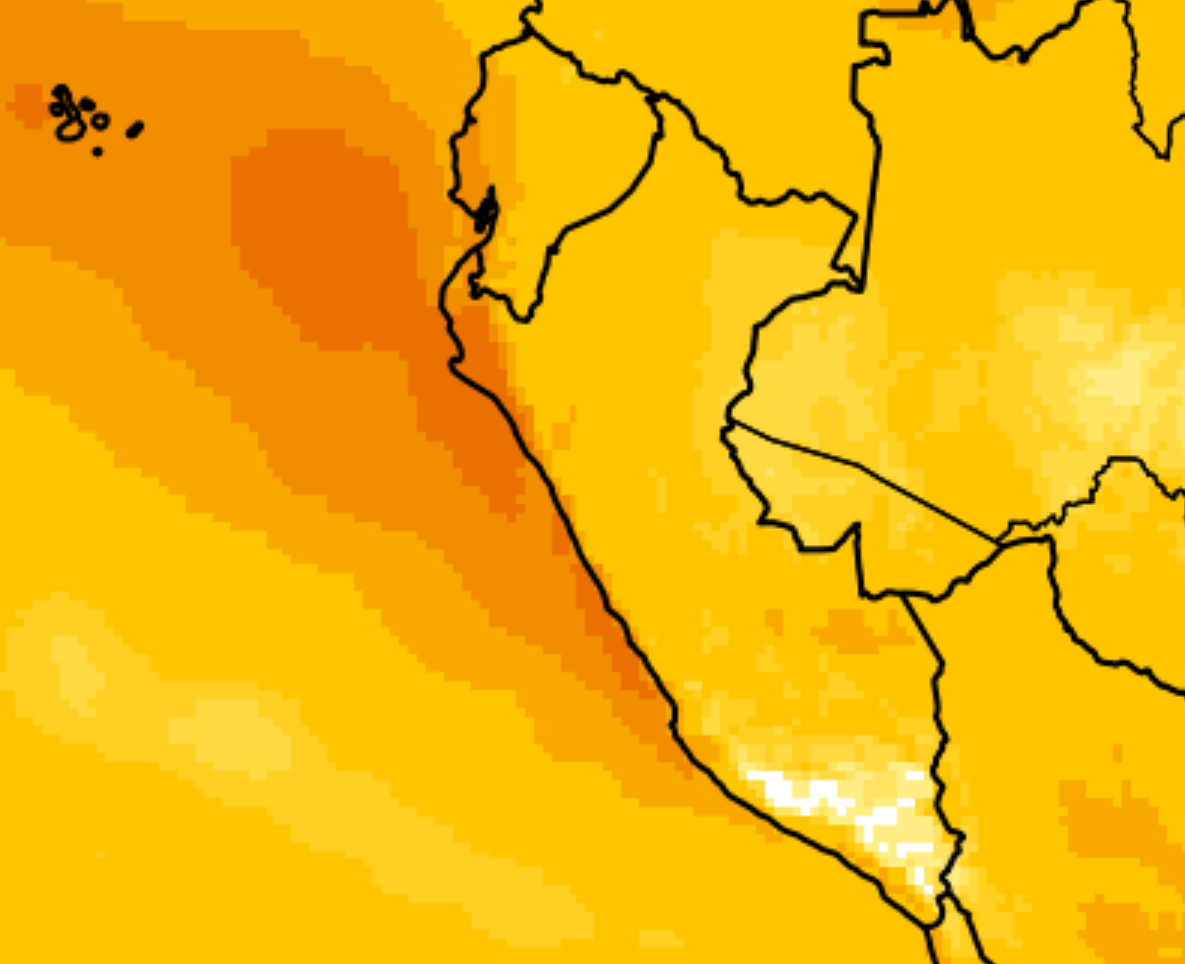
zoomed in plot of current GISTEMP Subboxes (ERSSTv6) (labeled anomalies 1991-2020) (I usually don't look at this version too often but it looks useful here):
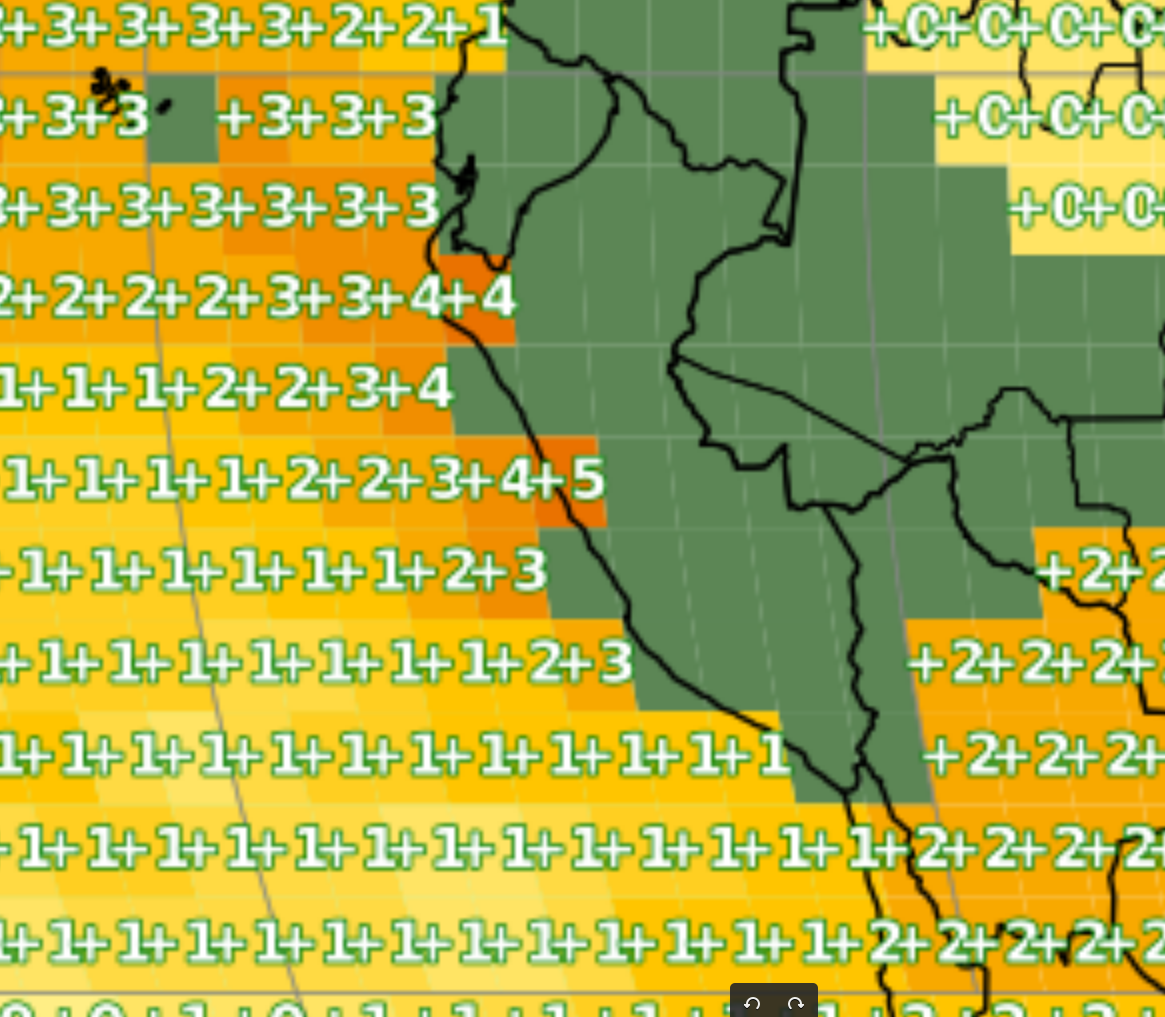
Last month's (final stations) and June plot zoom in for comparison:
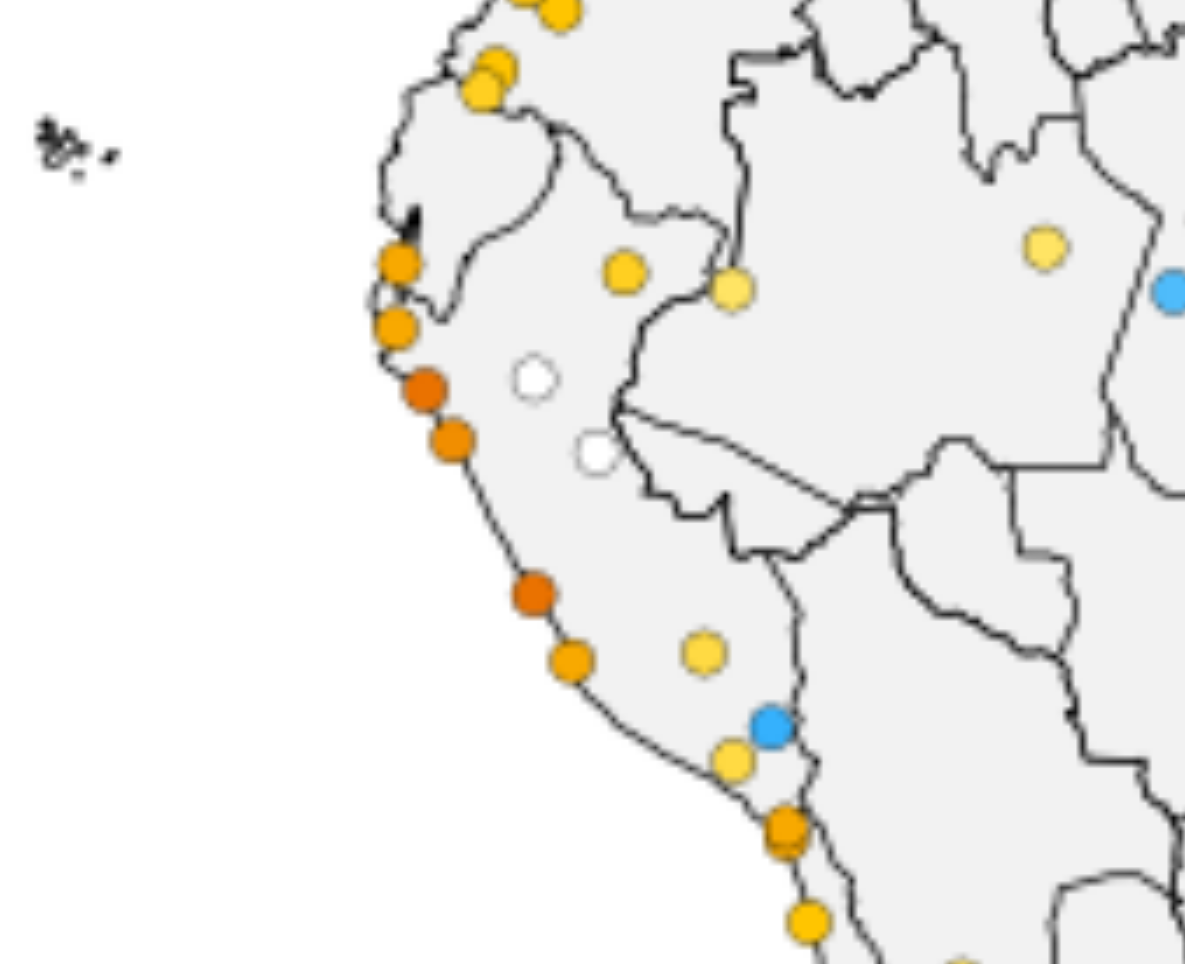
GISTEMP SUBBOXES (ERSSTv5) of June from last month's GHCNm (20260607): (interestingly v6 is slightly shows a slightly more coastal El Nino and a bit warmer along the coast)
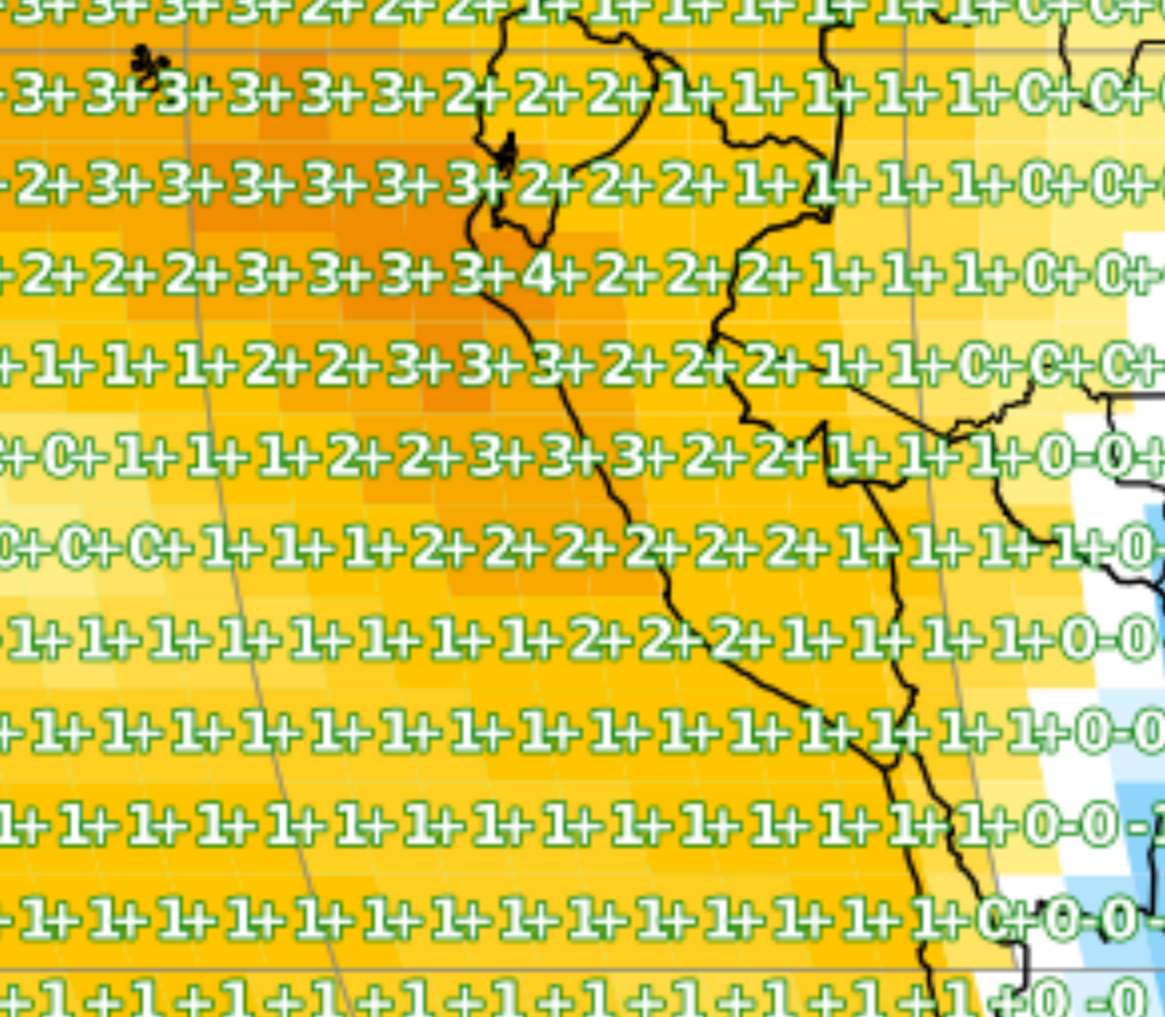
All the stations will be anomalously warmer this month given what ERA5 indicates, especially the coastal stations, but the warm anomaly along the coast has gotten stronger, and seeing how much stronger a couple of those ocean subboxes are and how they line up with the other stations means the coastal stations will likely be really much warmer relative to inland Peru, so both the PHA + GISTEMP regridding means should make it much warmer than ERA5 would suppose...
Didn't update yesterday ... going to put both updates together (older first); also new program output (for post-ERSST data) further down....
Below (mainly coverage, but analysis also), gives me good reason not to bet any further. 1.22 C is my best guess at the moment where it's going to end up
====
result_ghcnm.v4.0.1.20260805
119.64945454546101
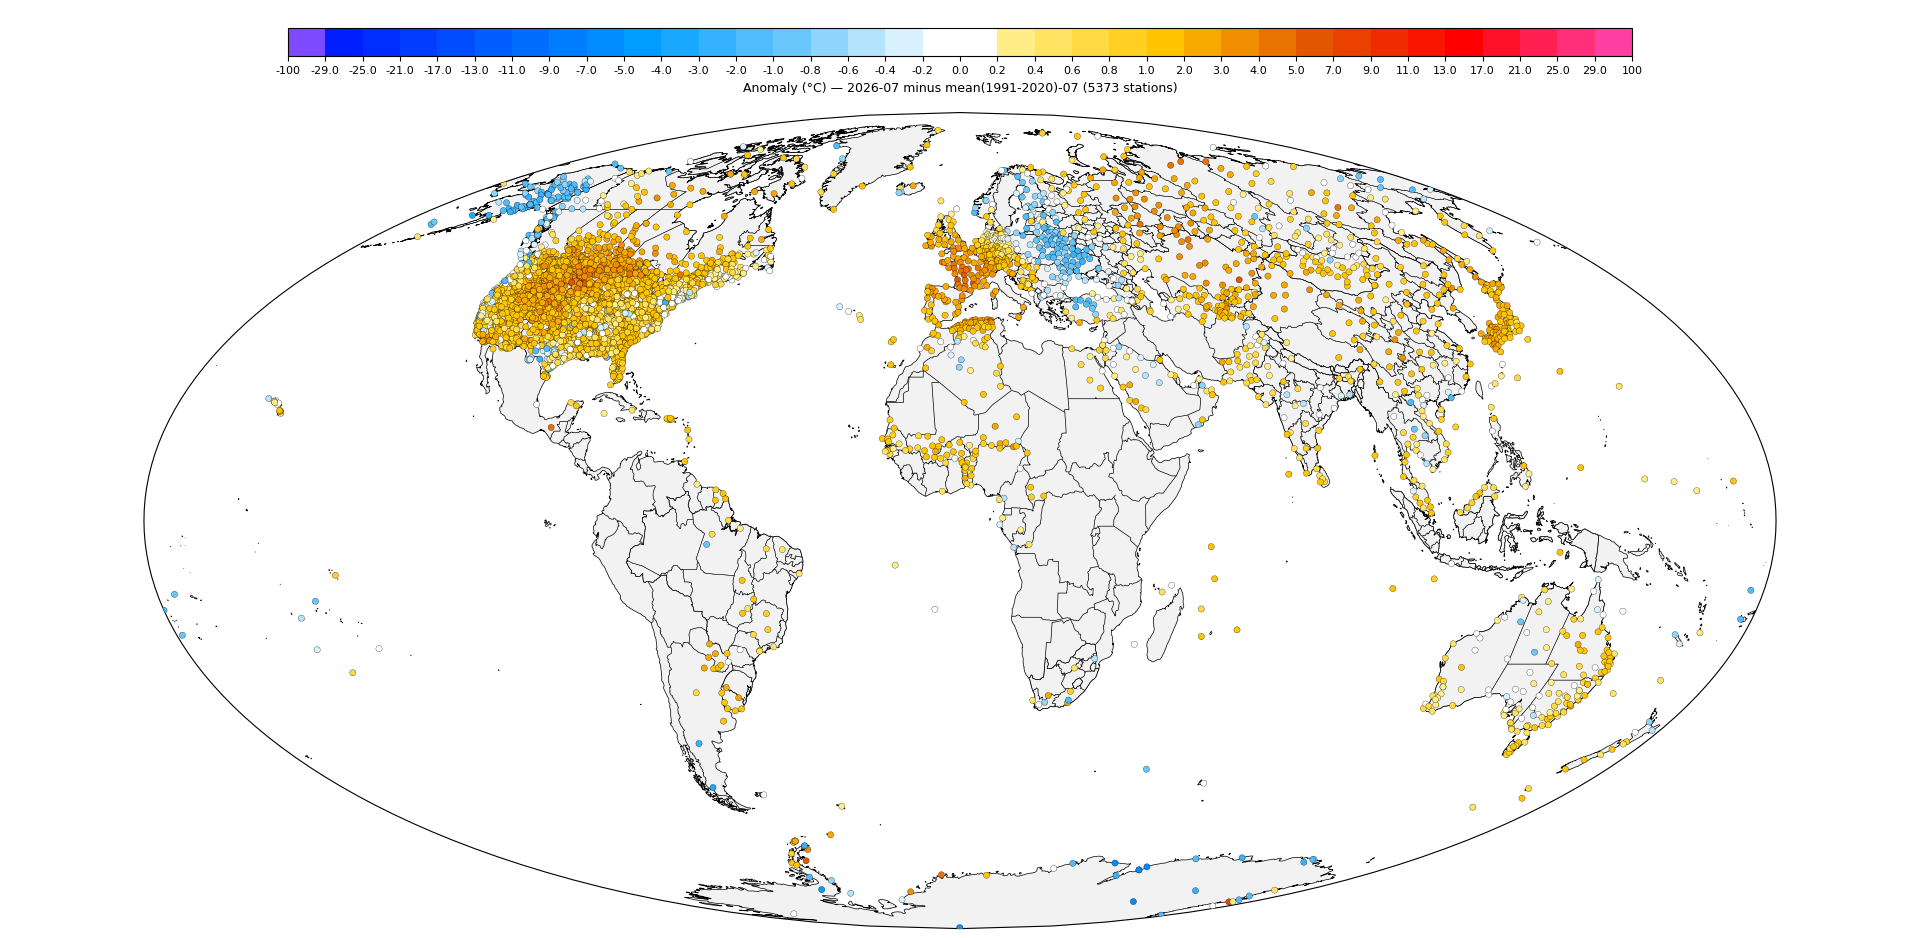
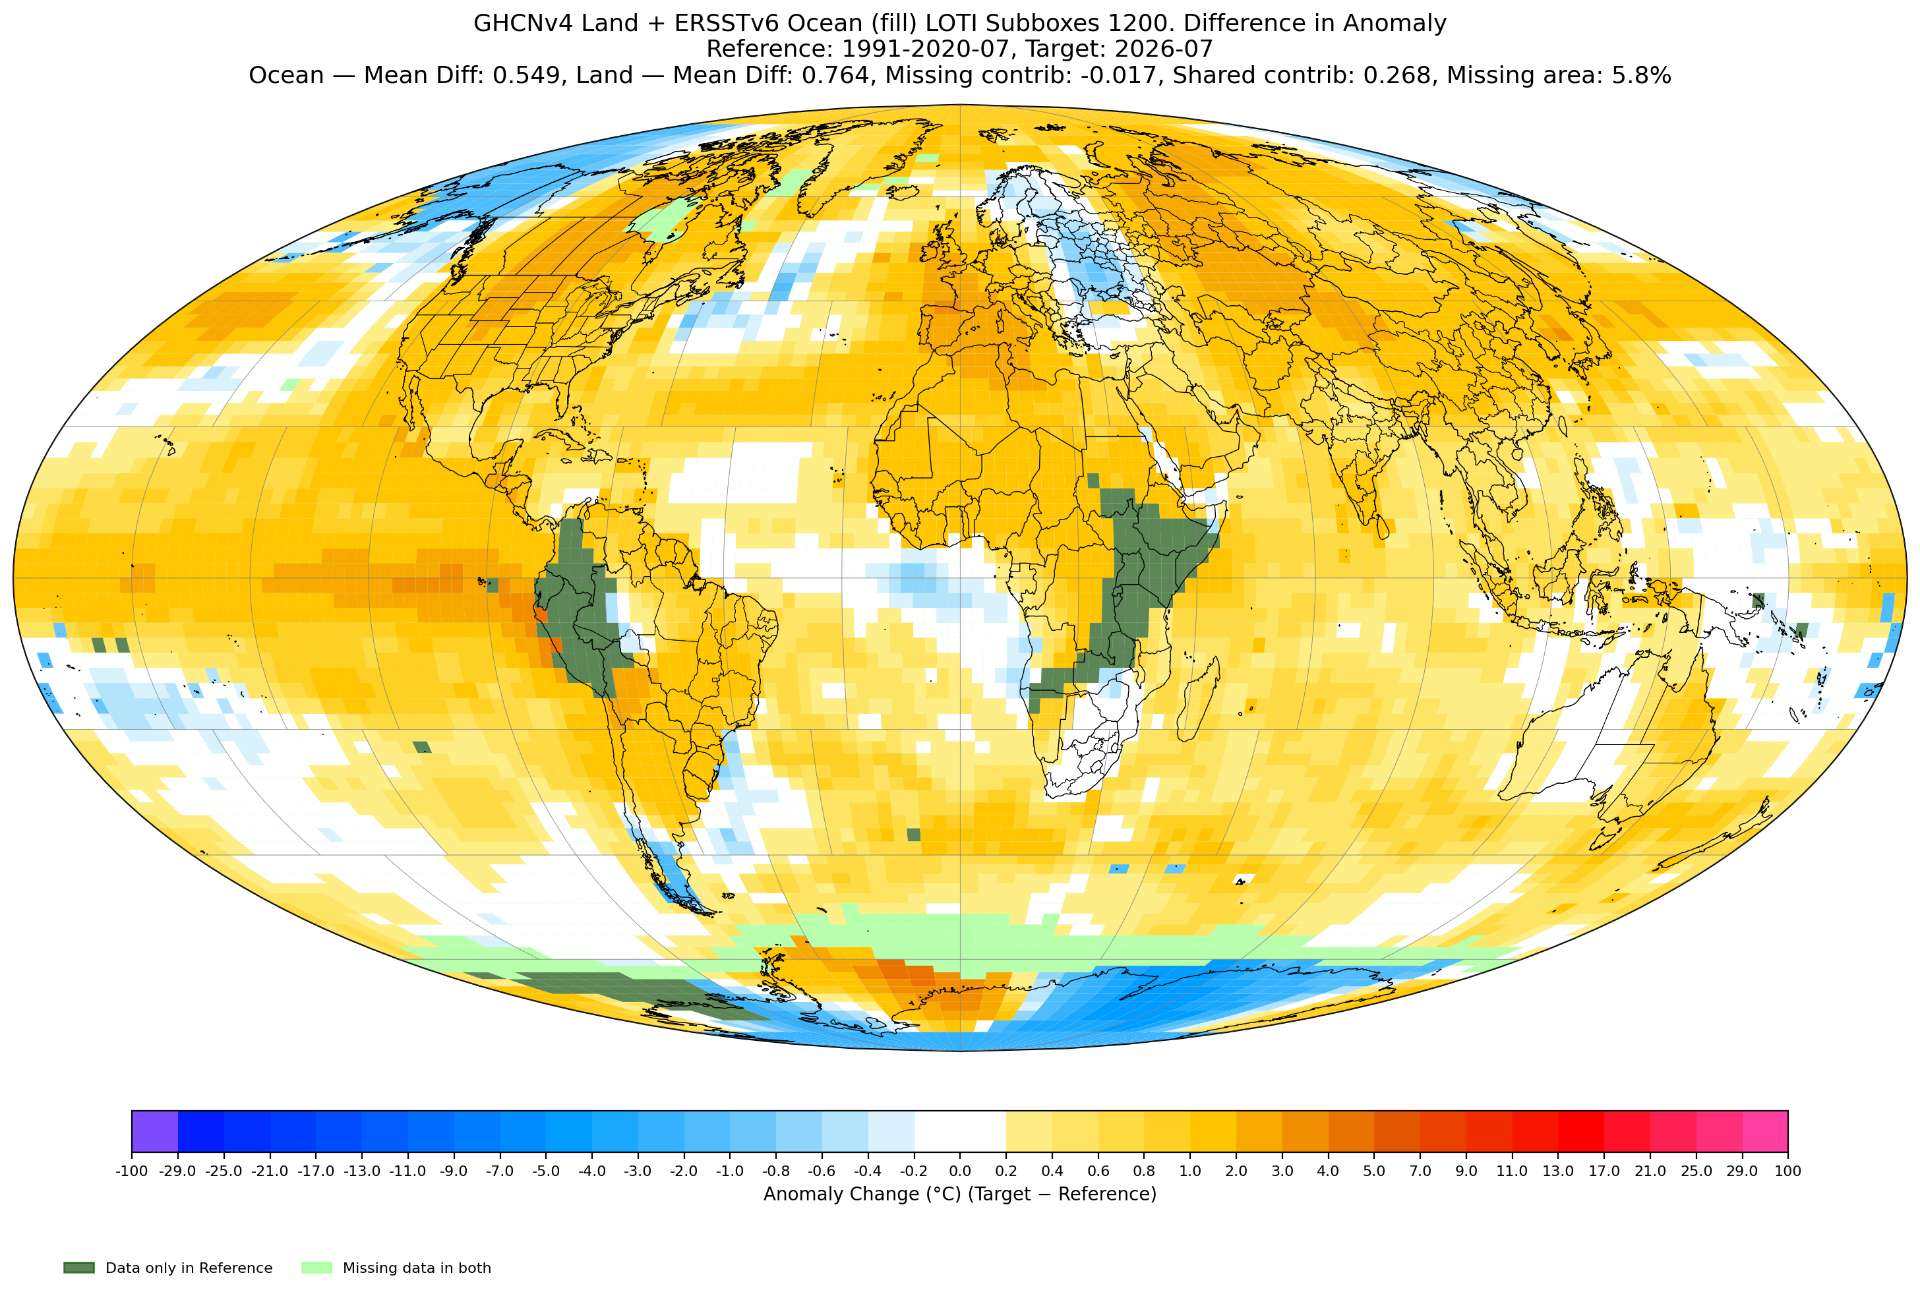
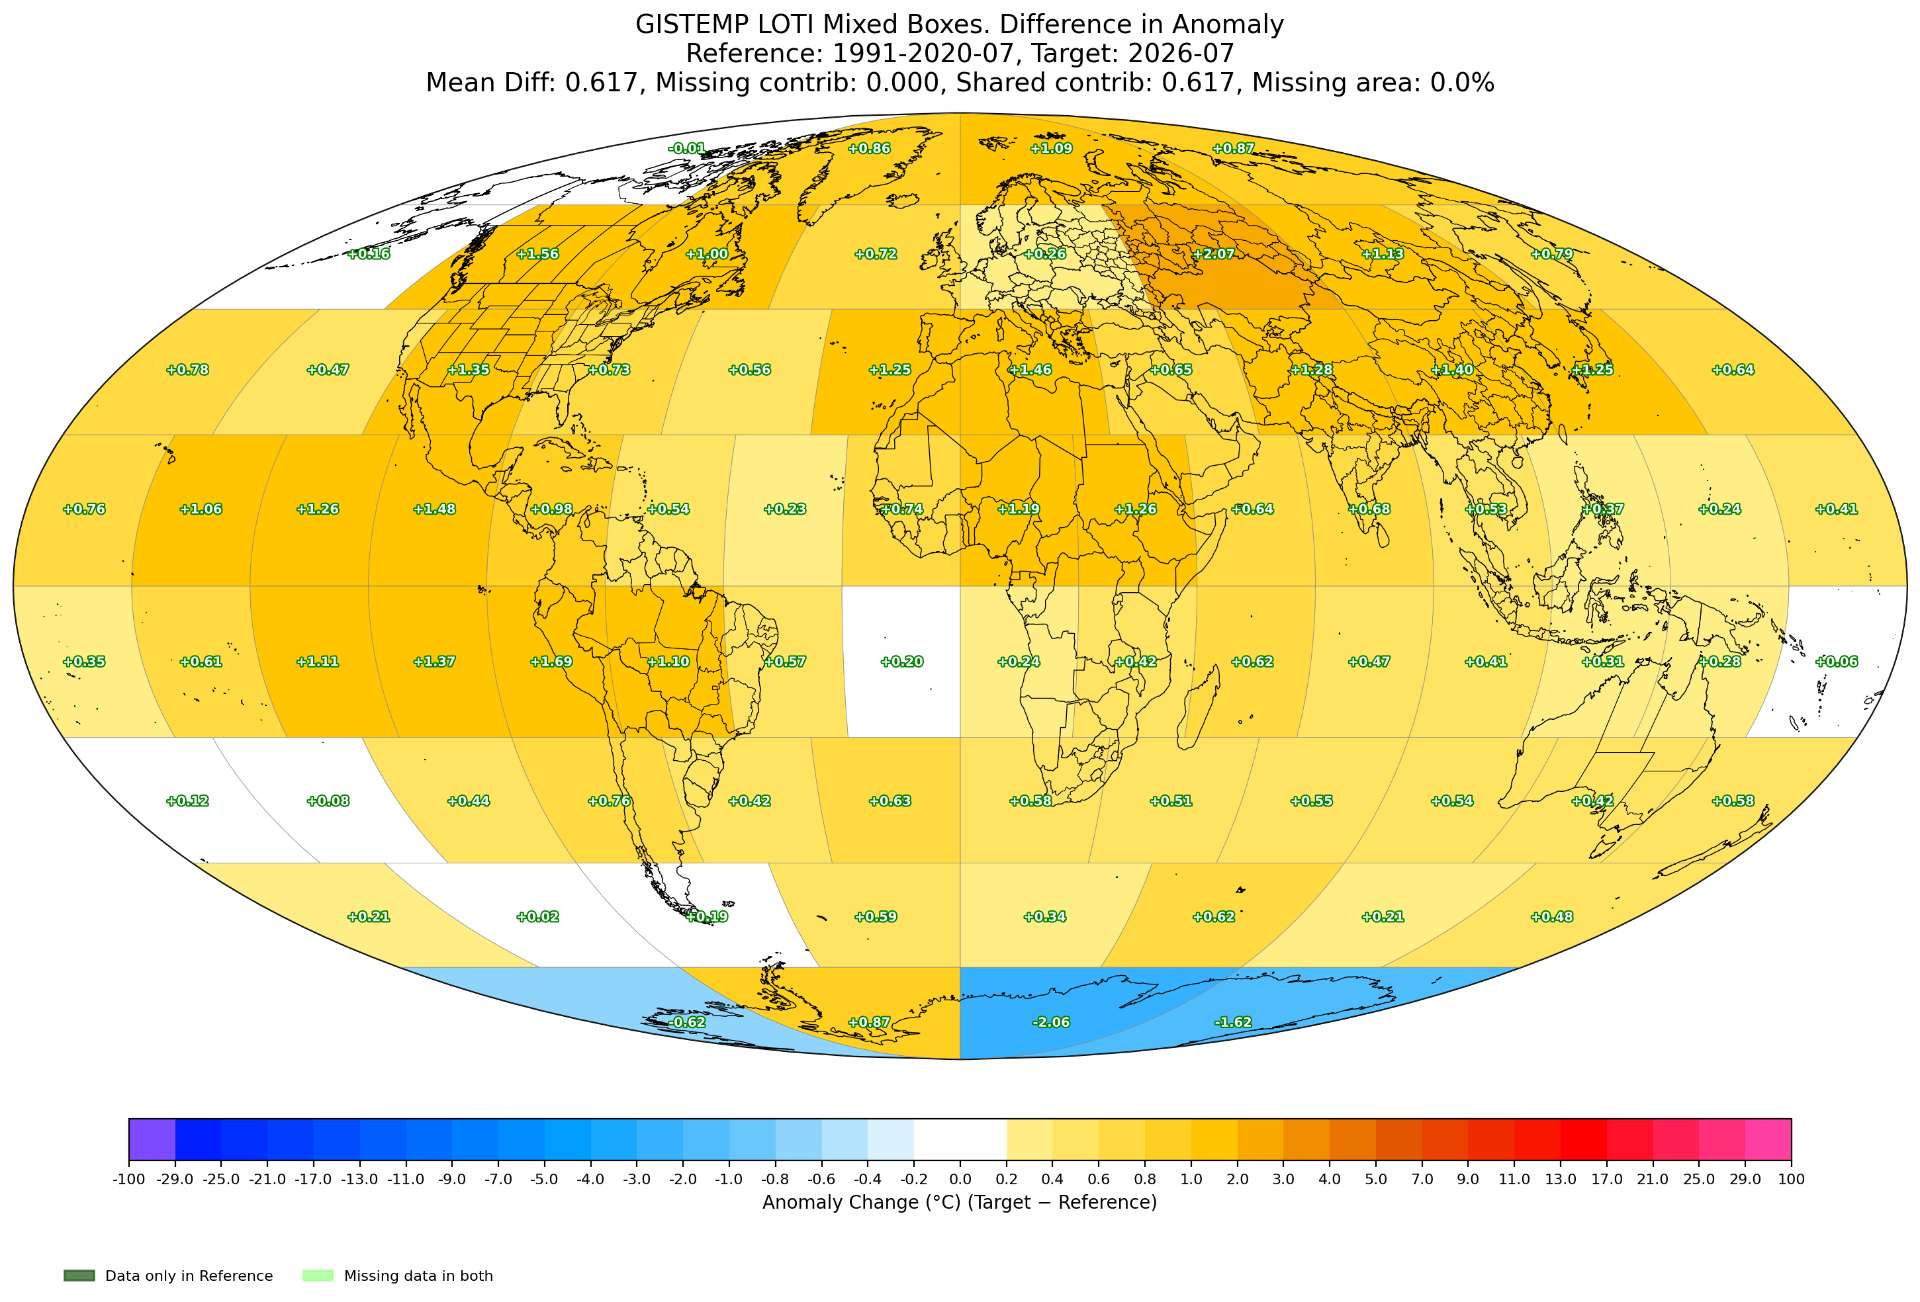
====
result_ghcnm.v4.0.1.20260806
121.02672818929794
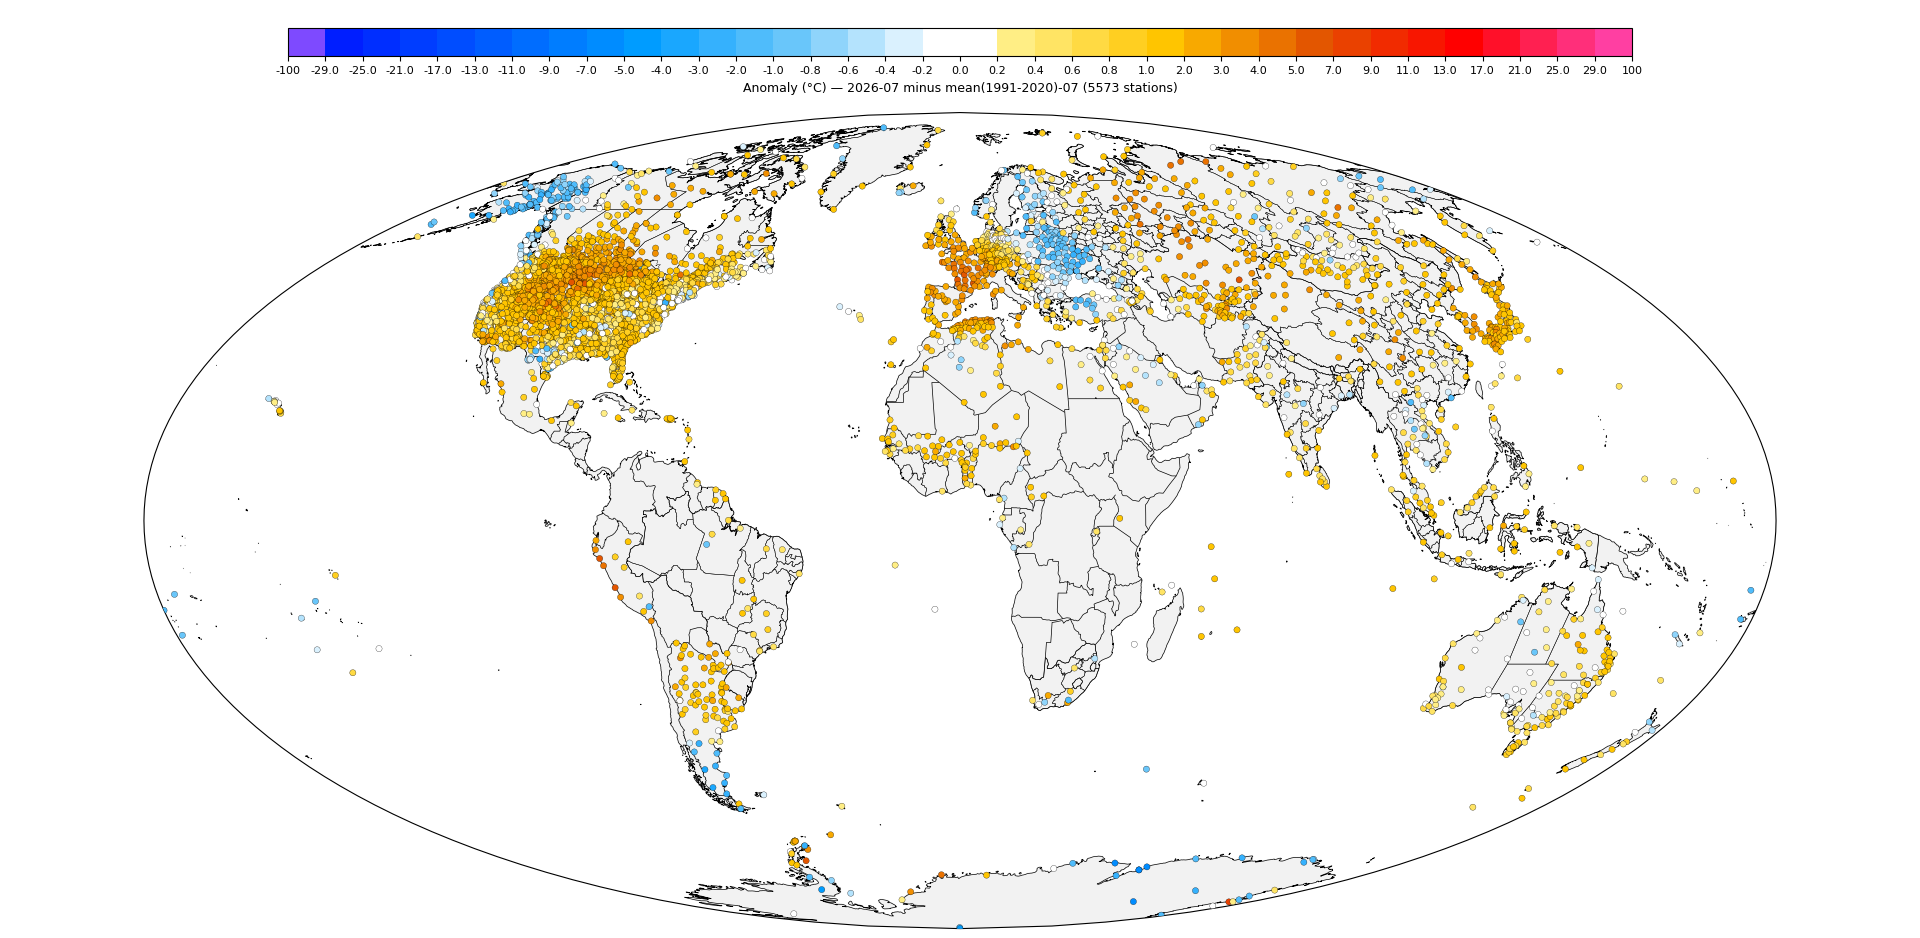
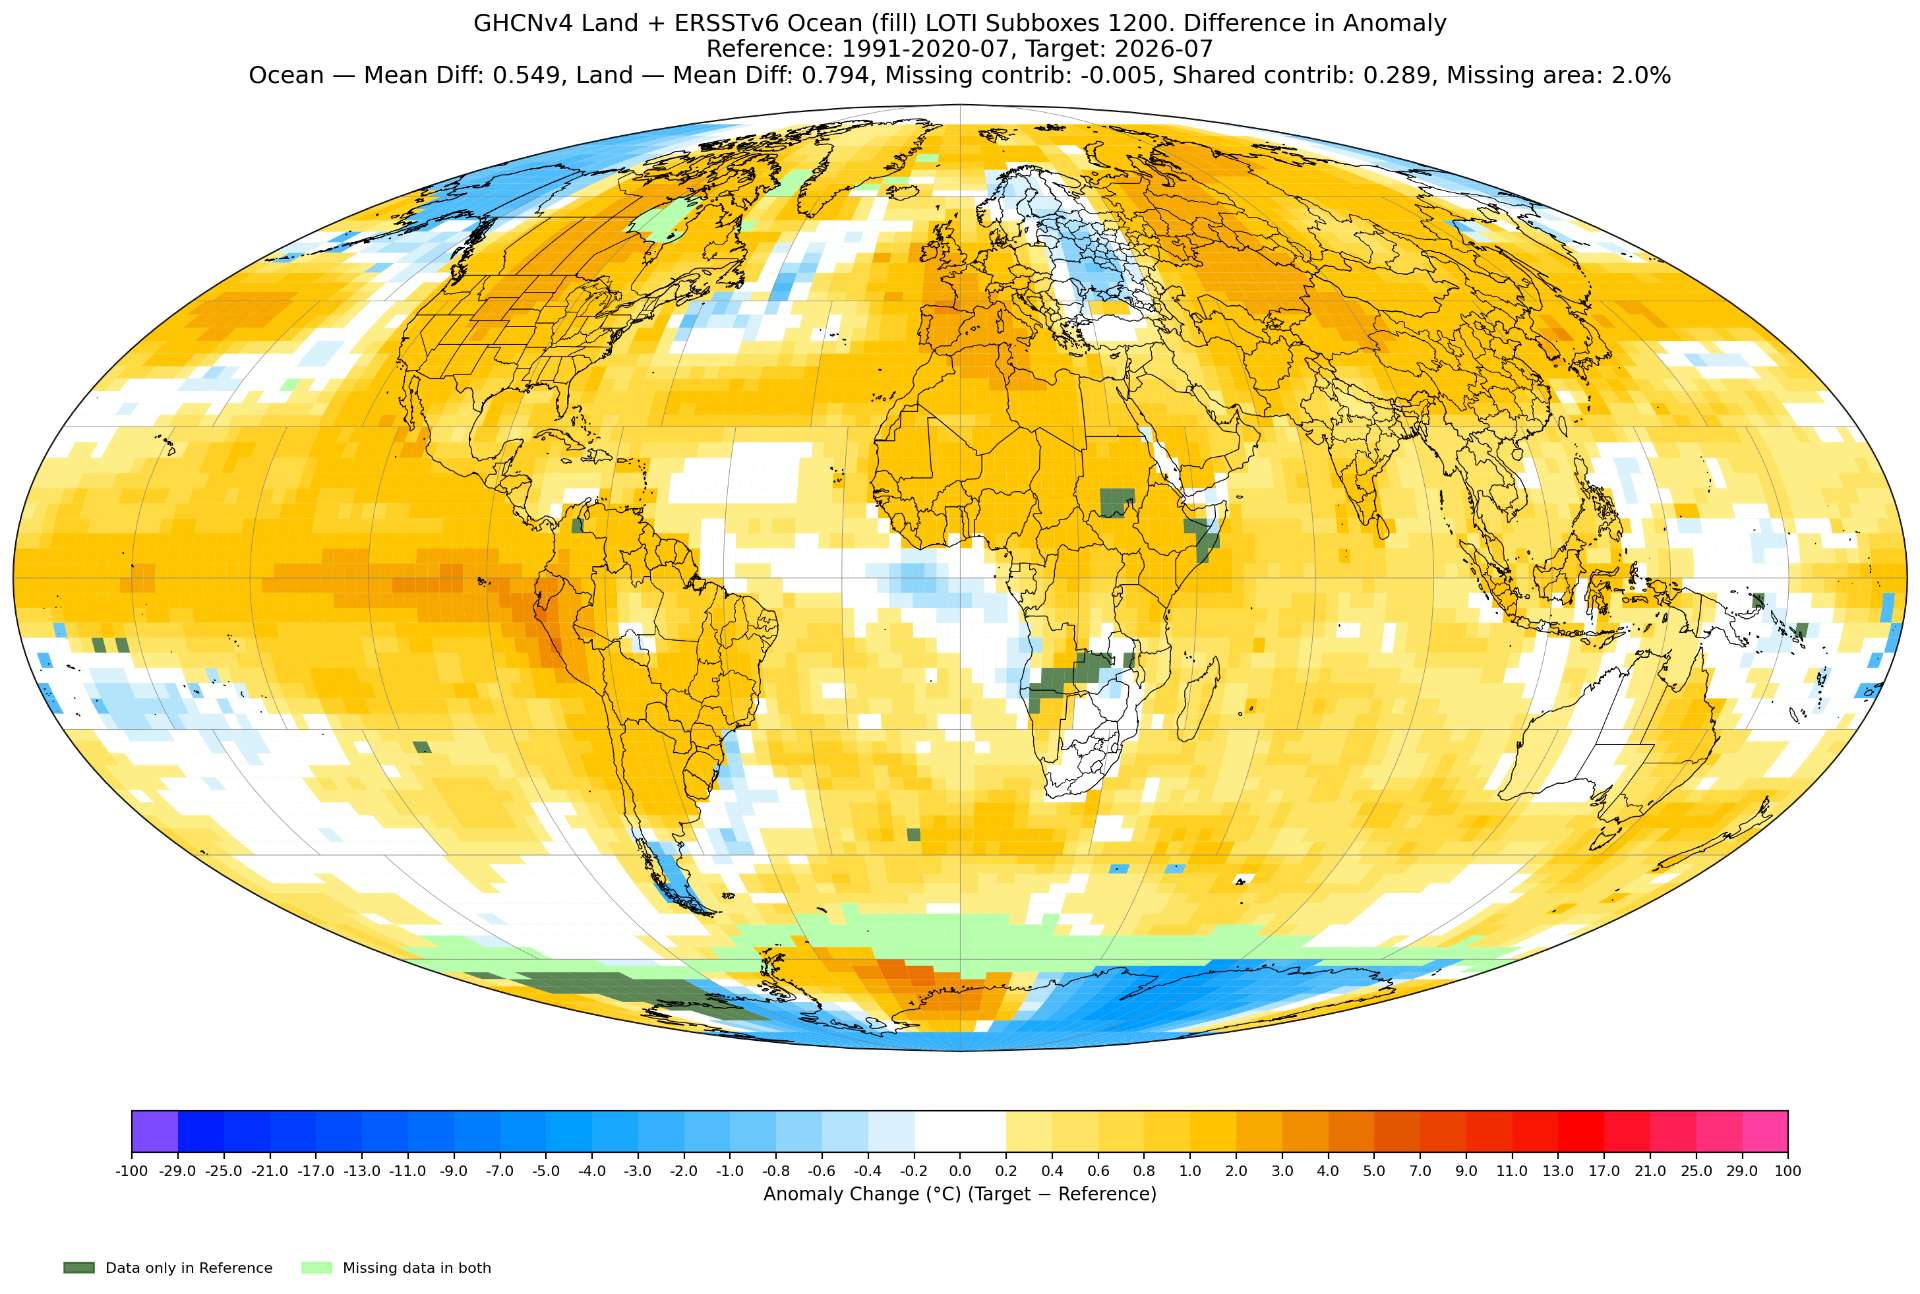
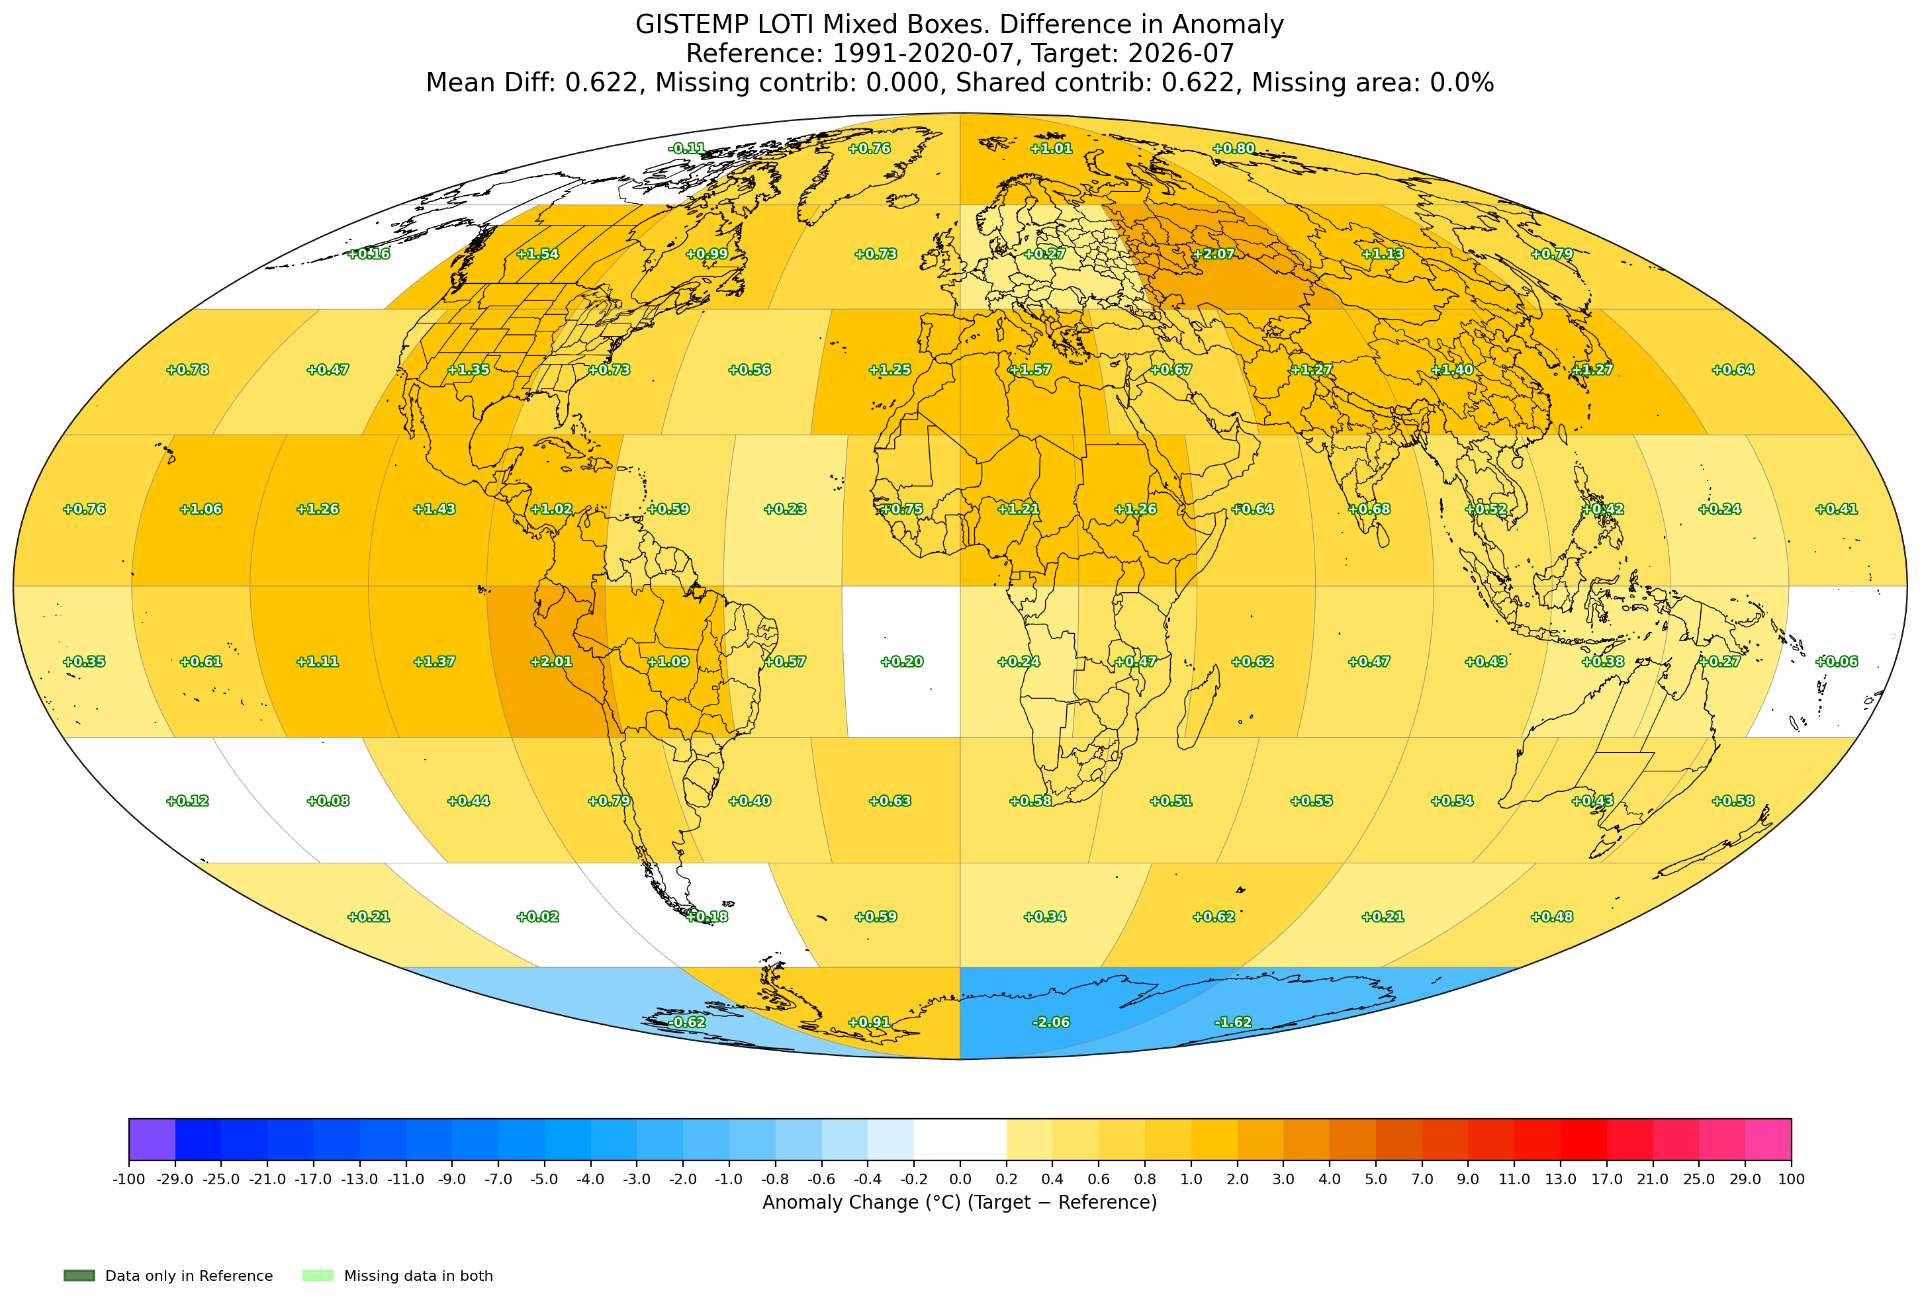
====
Kenya & Rwanda came in which gave us better coverage than we've had in a while.
Doesn't look like Peru was as extreme as I was worried about.
MINNA_BLUFF is the only station that looks a bit anomalous in the context of anomalies of neighboring stations and fails some sketchy jackknife QC (> 2 std dev accounting for elevation/lapse rate of neighbors), but in the context of the temperature inversions and swings it doesn't seem too abnormal after all the wave trains of warmer air hitting Antarctica.
Still expecting: DOME_FUJI, Svalbard + a few other Arctic stations, Venezeula/Central America, quite a bit more Australia stations, more scattered Asia stations (especially NE russia), and a few island stations (i.e. like in SE Pacific) ...
===
My final run from yesterday for the old three models now that ERA5 gridded is completely in:
Point estimate (old, delta2 method, loti3 method) adjusted by prediction error mean: 1.2441, 1.2108 1.2145
Point estimate (mix), pre-adjusted by member prediction error mean: 1.2195
===
Final ERA5 plots for comparison:
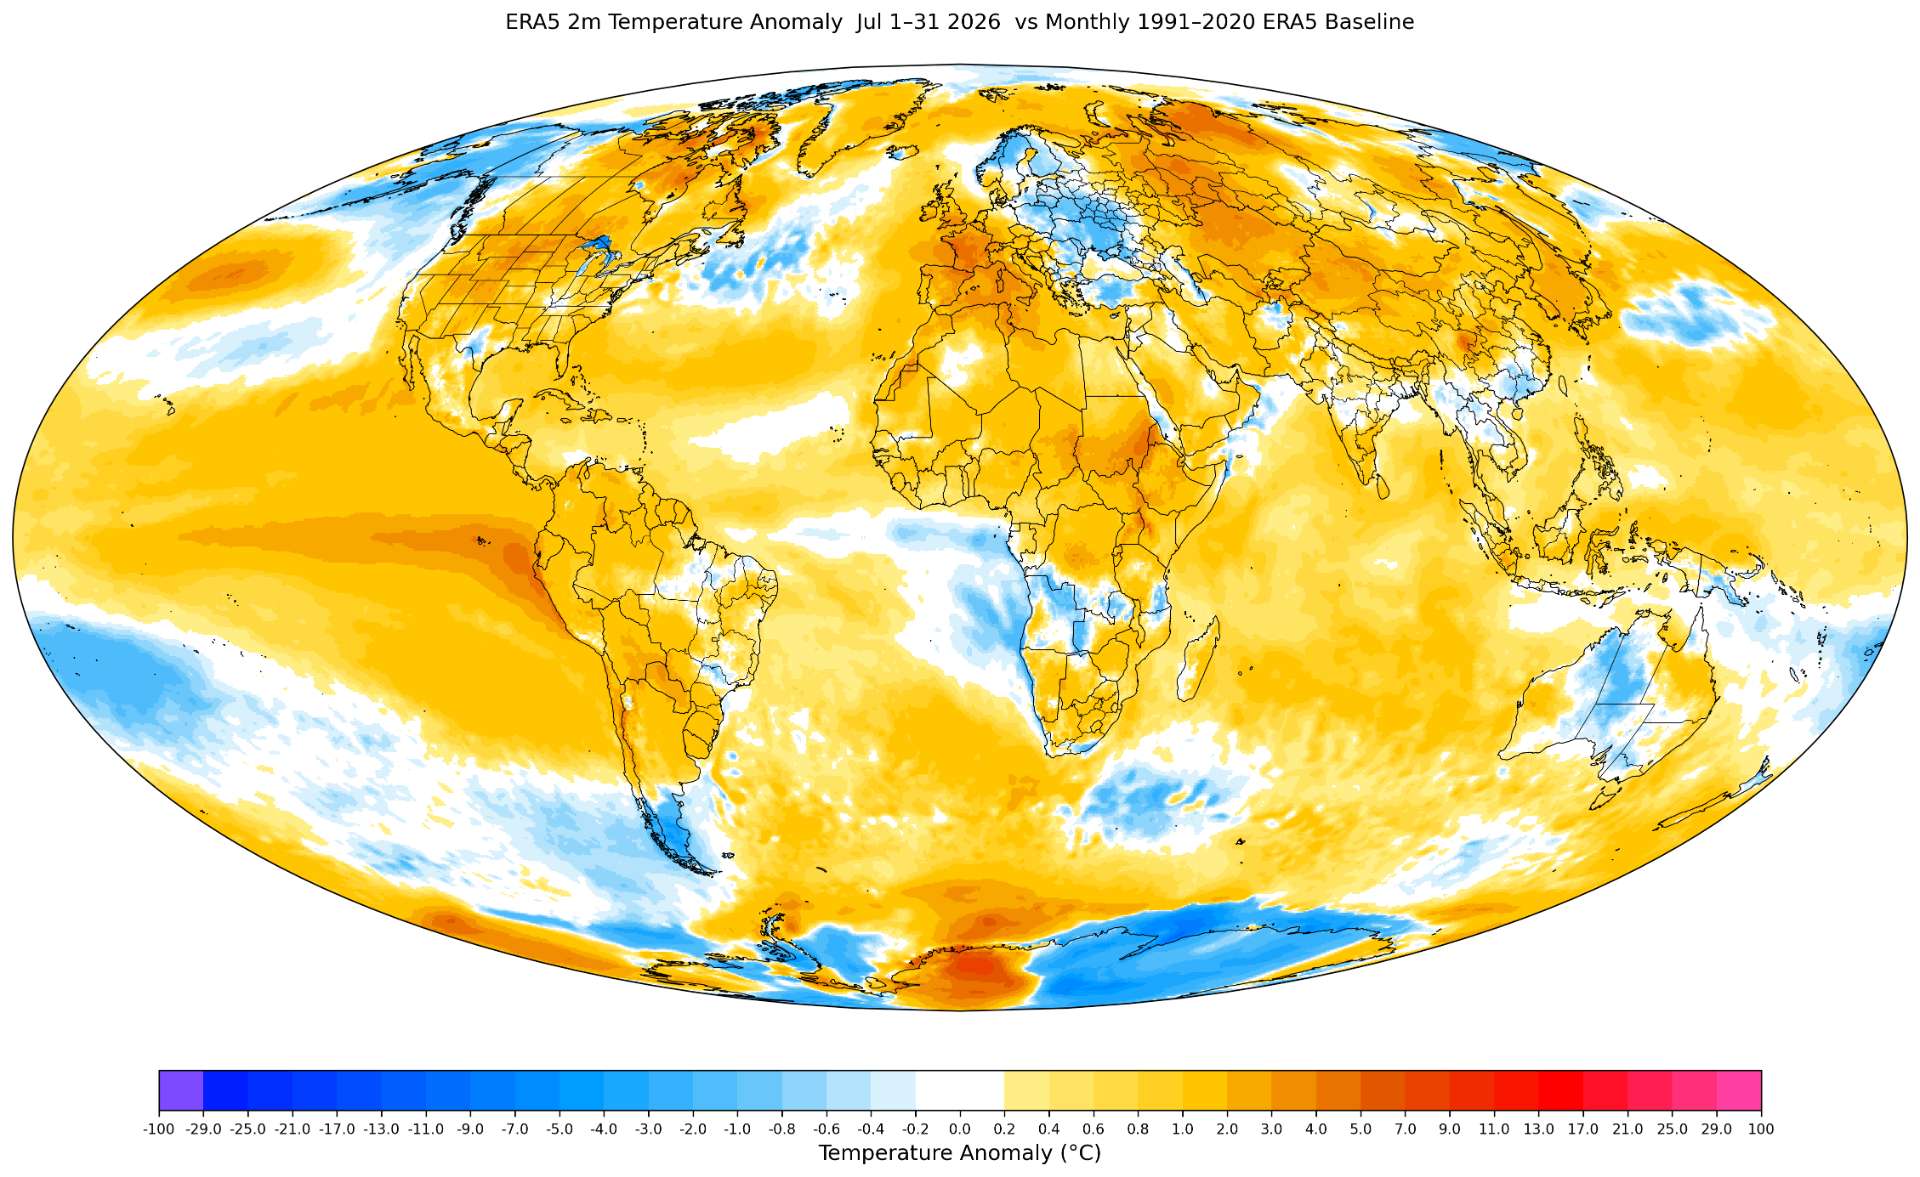
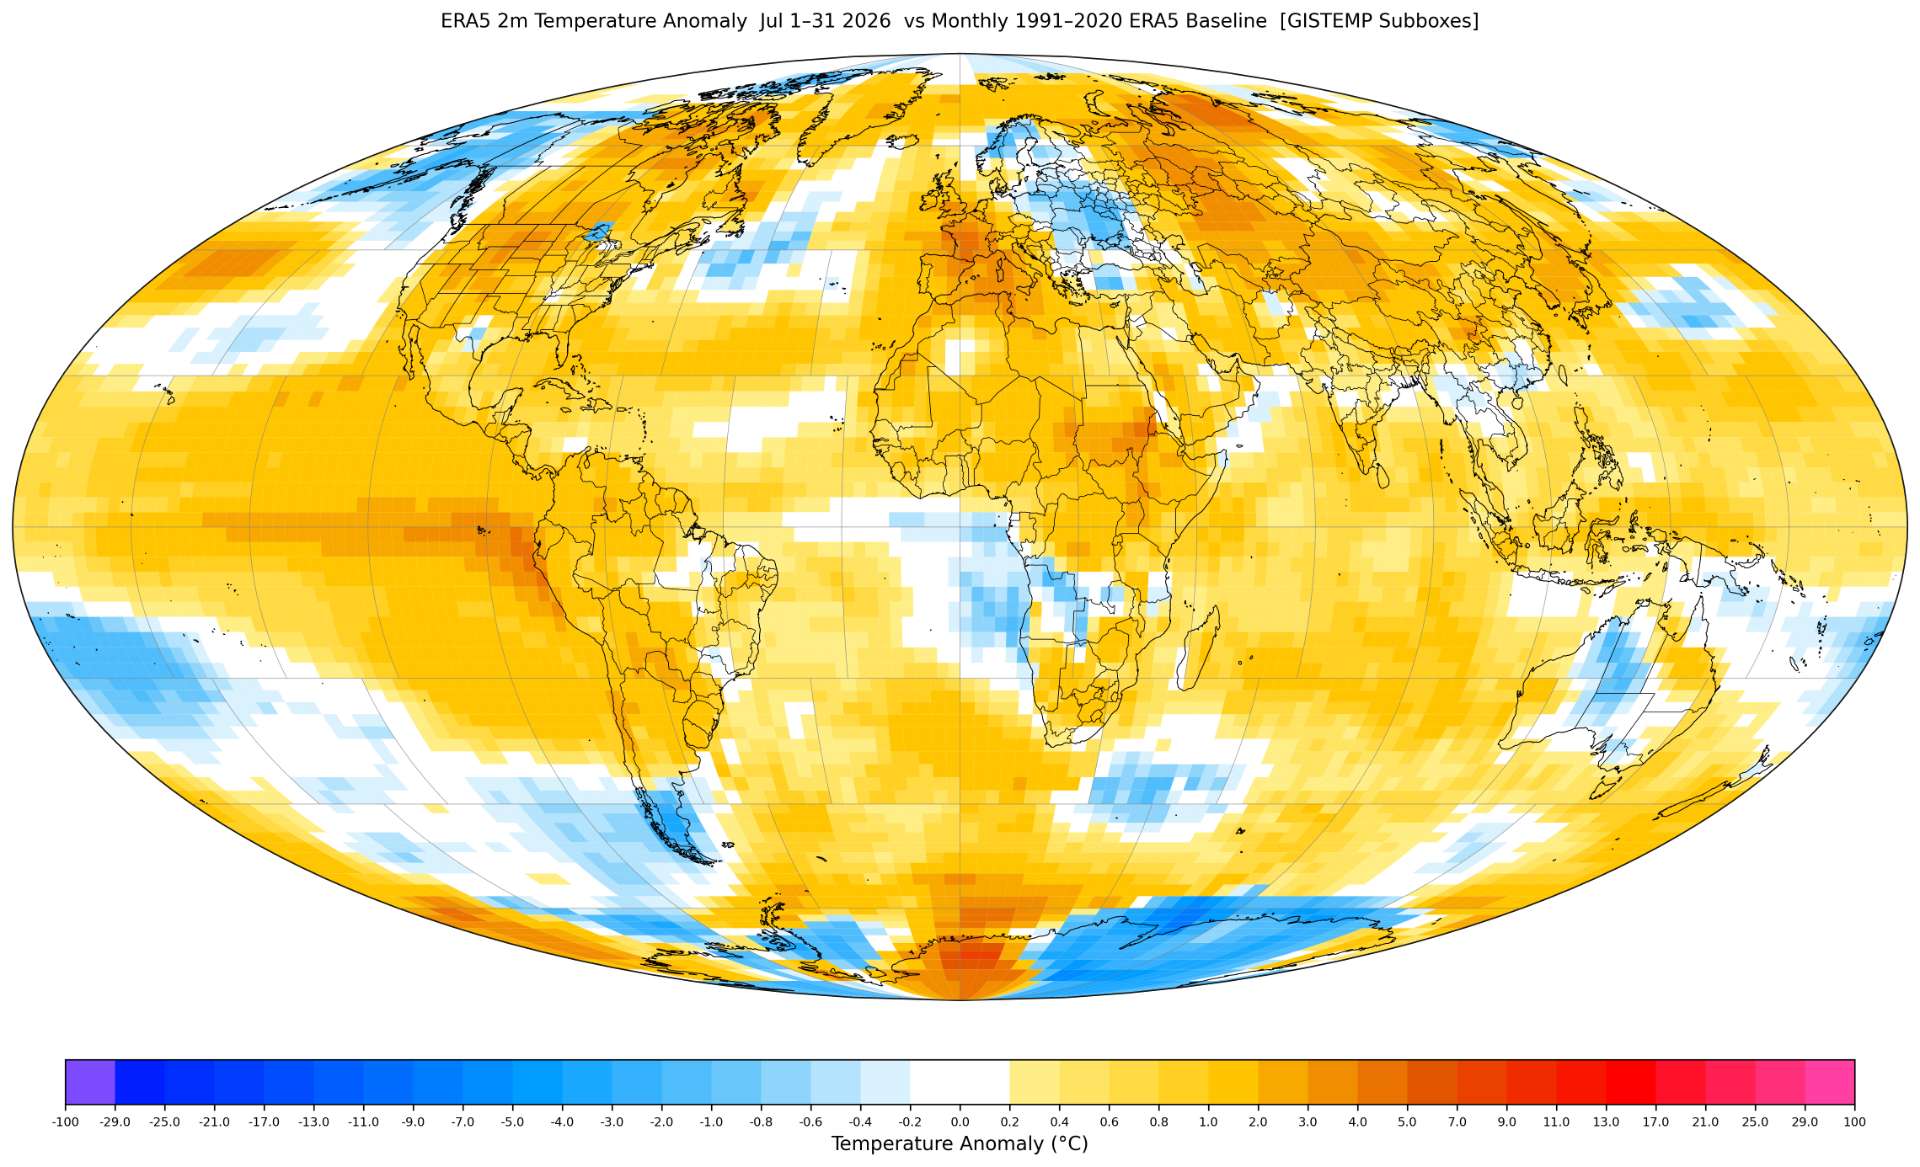
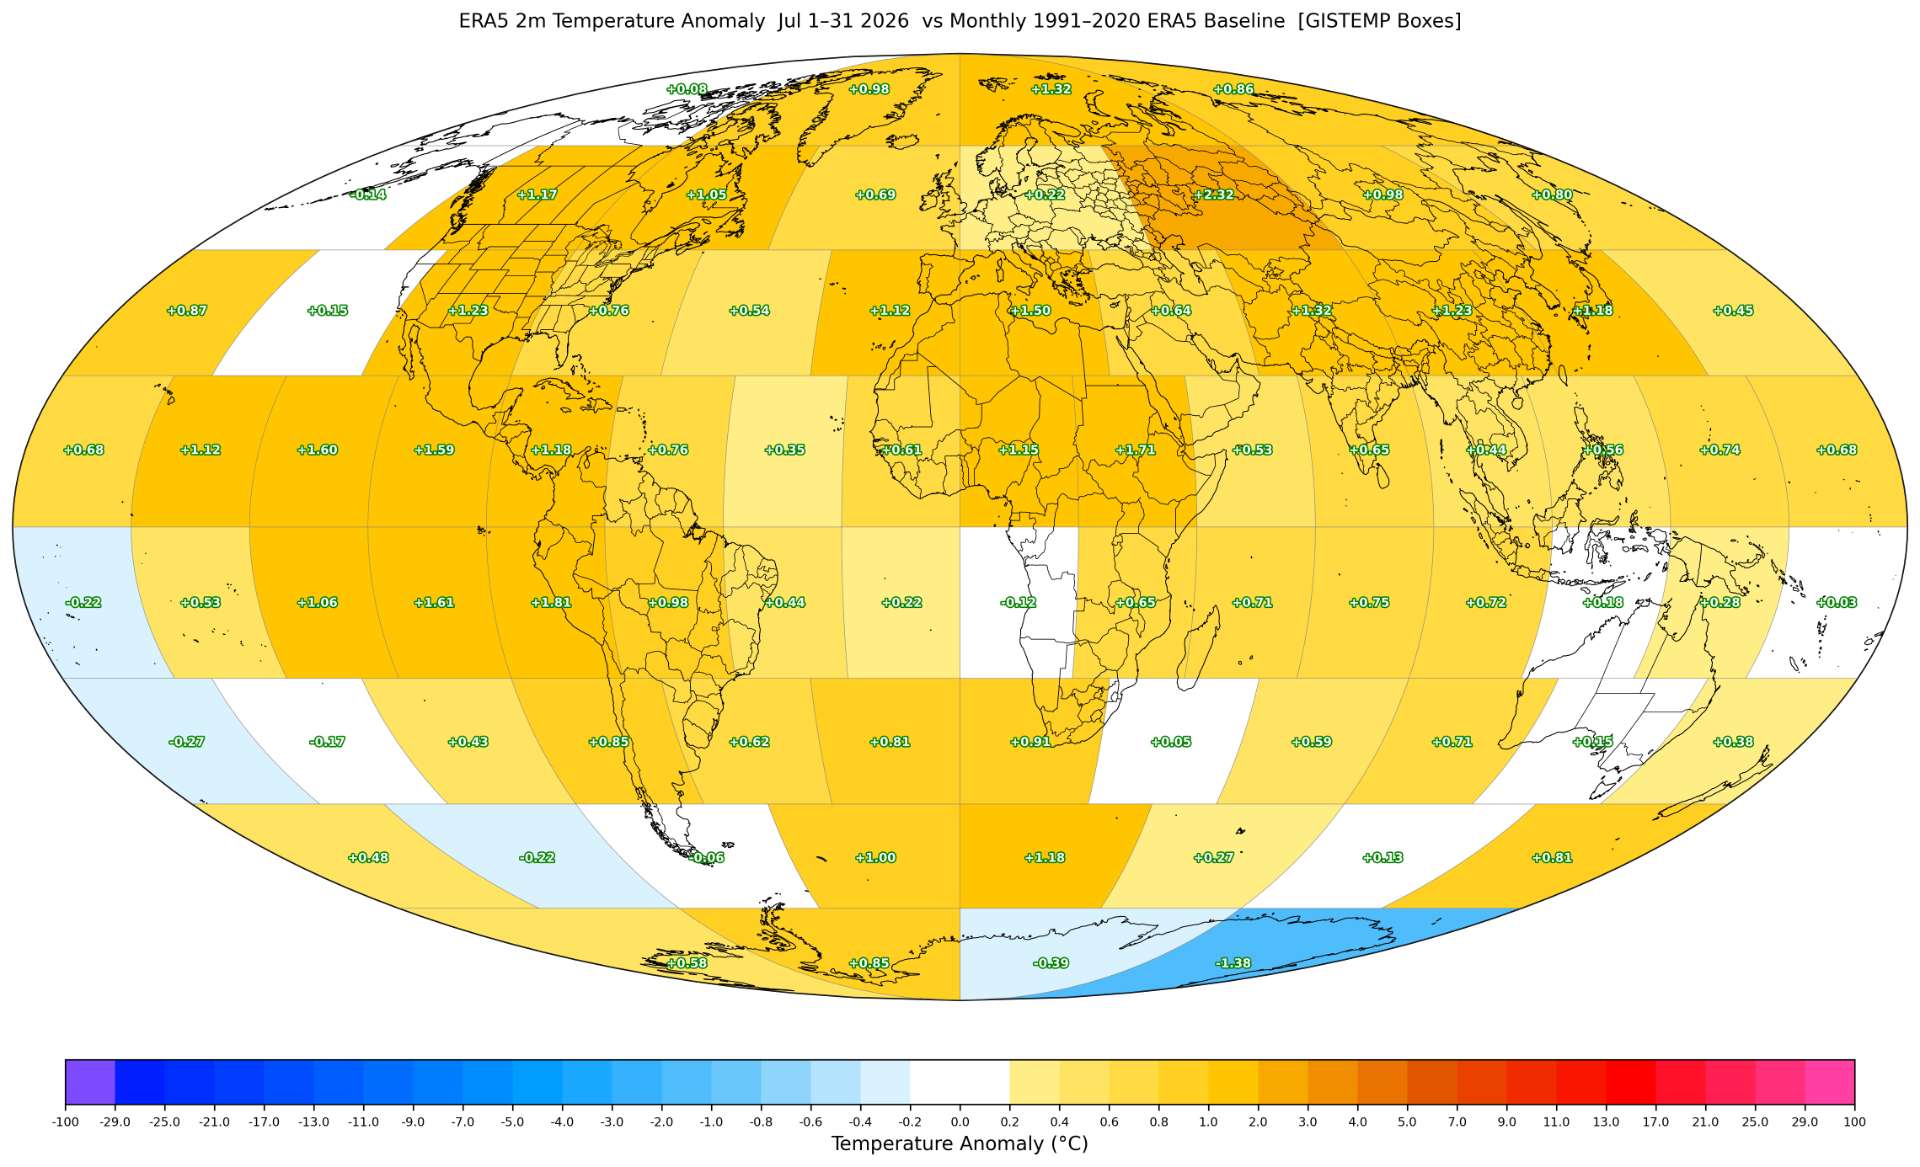
==
Yesterday I wrote a program to use some of the code from various tools/utilities/data I had laying surrounding GISTEMP/ERA5 to interpolate missing stations using the ERA5/superensemble data (now all ERA5 at this point for July). It uses the set of stations from the prior month (release date) minus set of stations of the current month, as the expected missing stations and attempts to update a mixed subbox (one generated by the modified gistemp code) by using station weights (which account for the gridding radius input operator on the subbox grid) , station month counts (used for weighting in GISTEMP), etc., from the prior release and latest release to calculate the shift (using anomaly space) in the mixed subbox temps (masking for land subboxes) using ERA5 bilinear interpolation for the specific station set. It does this while doing the process in a very similar but not exactly same manner as GISTEMP's combine (I don't recompute everything from scratch using absolute values -- just pretend that the new, fake station follows the stitching of combine afterwards); it doesn't modify/rebase any older temps other than the target month (only the station months, station counts etc). The resulting mxied subbox is fed into a alternate step5 pipeline (separate from GISTEMP's code) that perfectly reproduces past values.
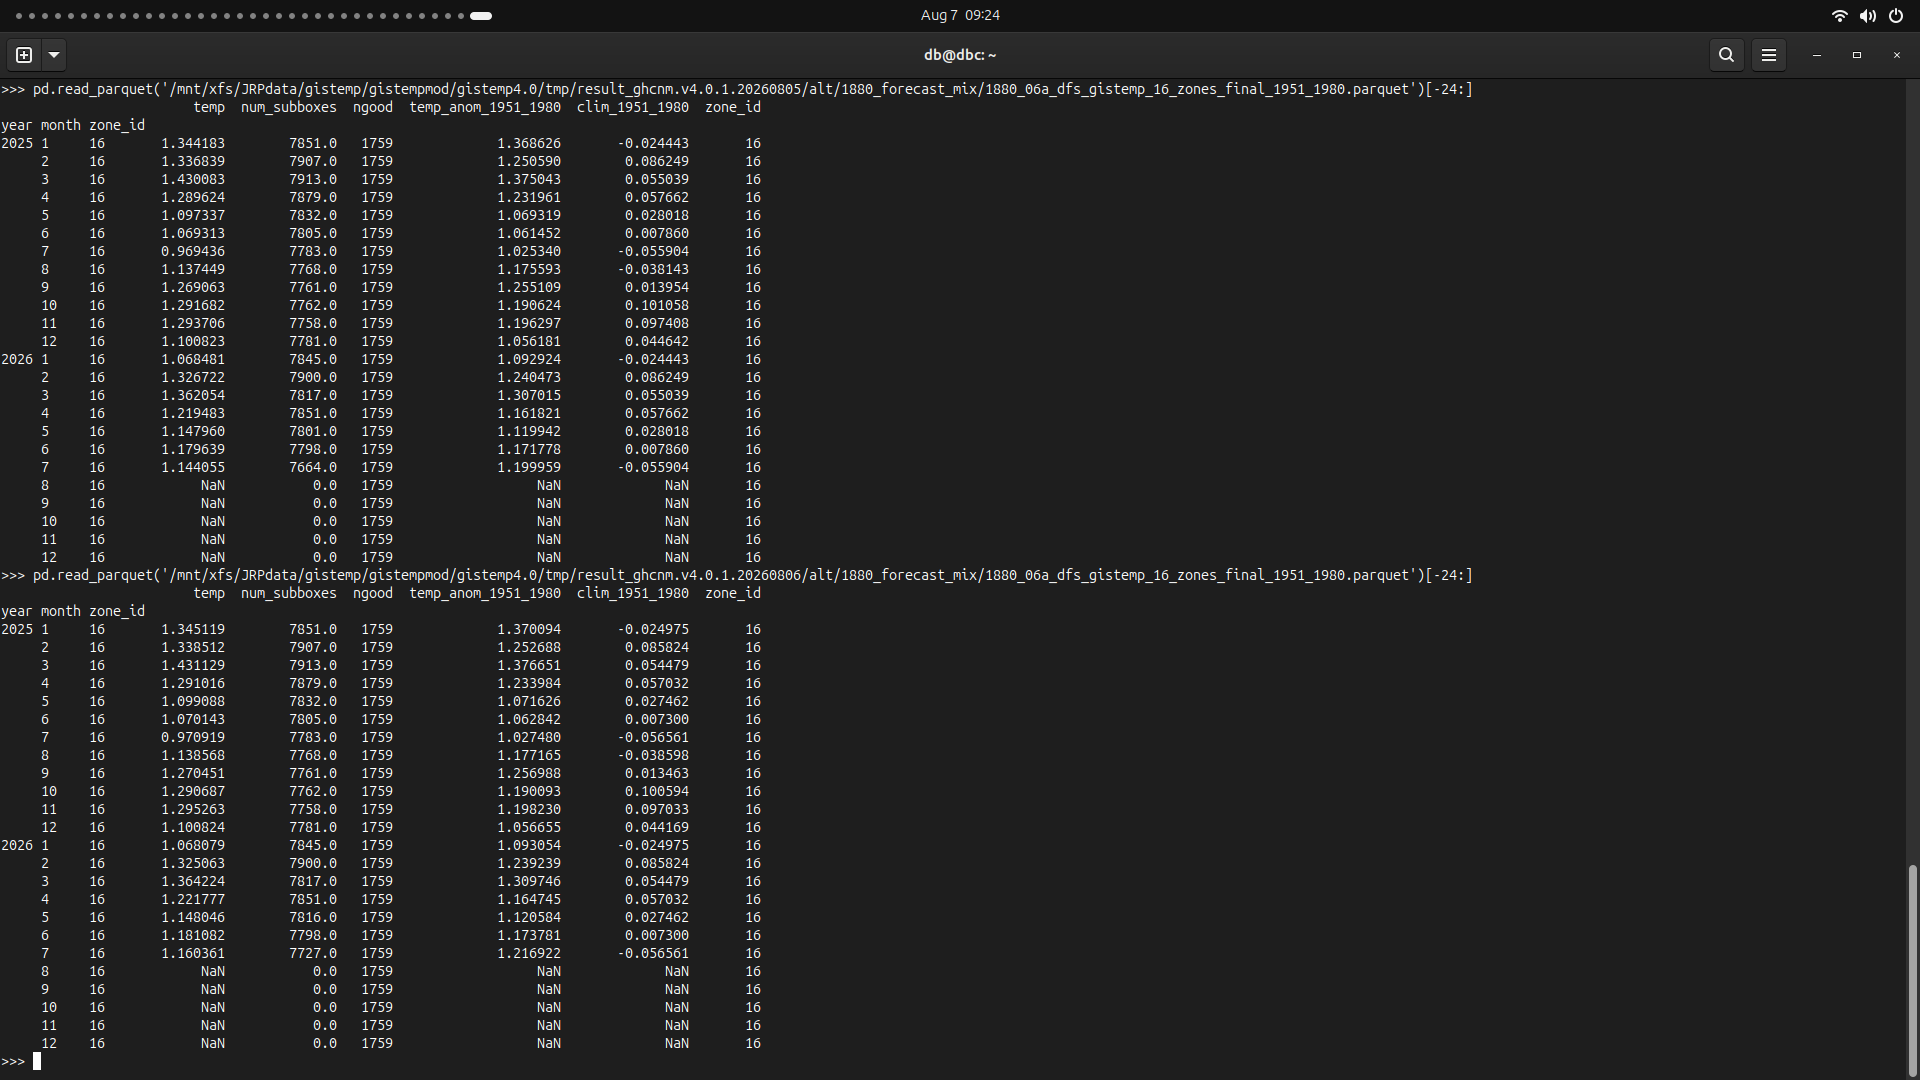
(relative to the 20260607 stations):
Yesterday's run (ghcnm.v4.0.1.20260805) it estimated the final value to be ~= 1.200
Today's run (ghcnm.v4.0.1.20260806) it estimated the final value to be ~= 1.217
(It's not predicting the next run's value each time, but essentially predicting 20260807's run since it's tied to ghcnm20260707)
Some of the variance I'm sure is for unexpected stations like Kenya/Rwanda and the usual suspects like very warm anomalies like in Peru, but it's hard to tell with so few samples how well it will do in the long run.
===
I also still ran the toggle box (but I expect this should be less reliable than the above), since the weights are much more guesswork
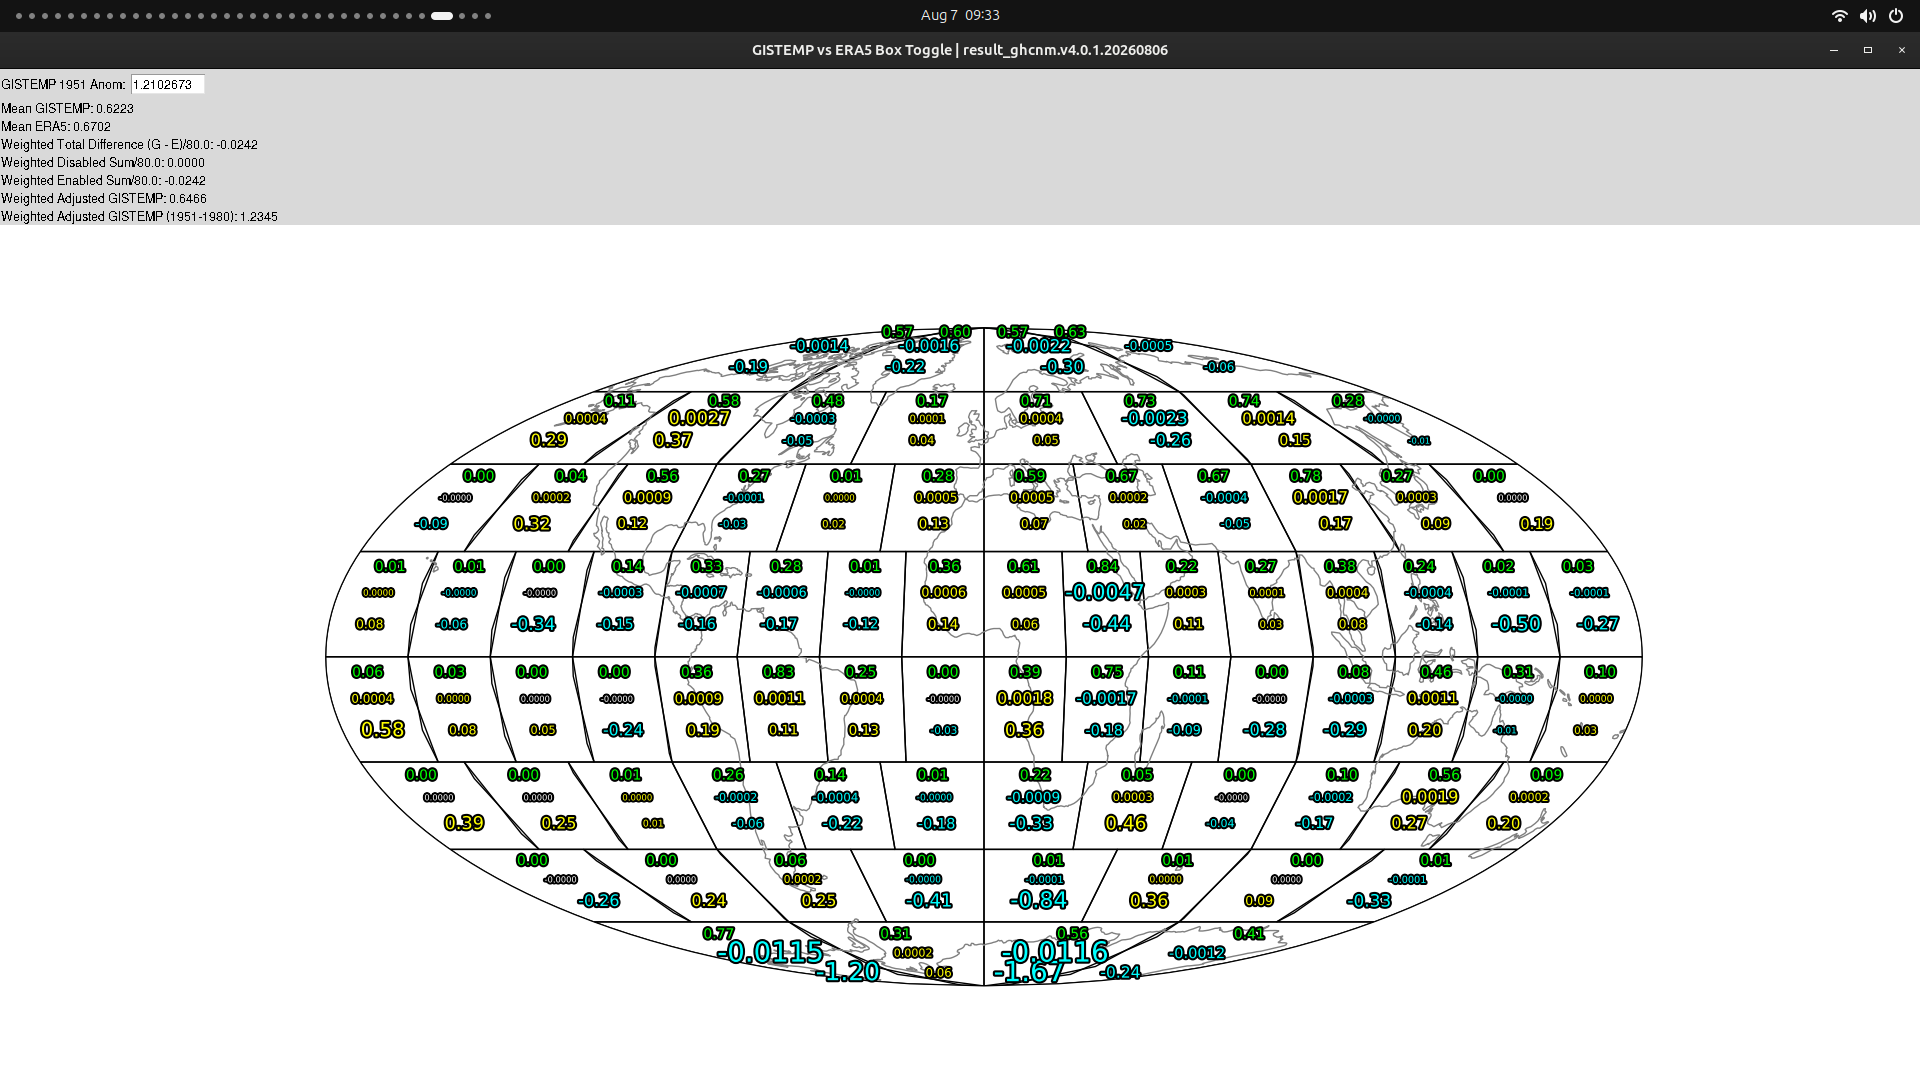
Today 1.2345 C, yesterday it was 1.2399 (and I was wondering whether I should put some more mana on the higher bin!). However with the other new forecasting (shifted) mixed subbox + alt step 5, and that now lining up with the ensemble of the other three statistical members, it seems like 1.20 is the most likely value, especially with all the coverage we currently have.
===
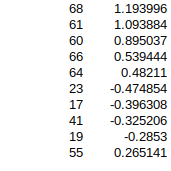
The following is the box break down (expected shift) for the new tool:
box_id
1 0.104954
2 0.053340
3 0.108669
4 -0.019863
5 -0.034763
6 -0.013014
7 -0.038002
8 -0.090496
9 0.006082
10 0.005269
11 0.028744
12 -0.052330
14 -0.026146
15 -0.000436
16 -0.064853
17 -0.396308
18 -0.115948
19 -0.285300
20 -0.093715
21 0.060226
22 -0.028449
23 -0.474854
25 -0.178534
26 -0.040060
28 -0.156409
29 0.015566
30 0.051751
31 0.046226
32 -0.062065
33 -0.025729
34 0.043588
35 0.026072
36 0.012250
37 -0.063228
38 -0.106820
40 -0.071167
41 -0.325206
45 0.039024
46 0.063337
47 -0.008728
49 0.000934
50 0.118043
53 0.230677
54 0.066931
55 0.265141
56 -0.076015
60 0.895037
61 1.093884
63 0.216567
64 0.482110
66 0.539444
67 -0.078345
68 1.193996
71 0.047375
72 0.029509
78 -0.006038
79 0.239837
80 0.023788
Name: norm_anom_shift_per_box, dtype: float64
Shift total:
3.1755548848328146
It's only useful for gauging which boxes are expected to have the biggest changes, which are
boxes:
sorting by abs magnitute, boxes:
68, 61, 60, 66, 64 (band 6)
23, 17 (band 3)
41 (band 4),
19 (band 3),
55 (band 5)
In band 6: Australia (already noted), and Argentina and South Africa (both of which I missed in my initial inspection). Looks like South Africa has about 3 more stations now than last month, but 2 of them aren't present currently (based on the ERA5 plot I suppose it estimates the southeast station of CEDARA will warm the currently neutral subboxes up a bit).
In band 3: 23 is the slightly lower density asian stations not yet present. In box 17 I notice now there are a few stations in Canada (i.e. Newfoundland) still outstanding that might affect marginally effect it.
Box 41 looks like its pointing towards Tutilia (American Samoa) or possibly some further islands contributing also on the other side of the antimeridian.
Box 19 is Africa / Europe (yes missing some stations there -- France + Libya).
Box 55 is NE Australia..
result_ghcnm.v4.0.1.20260807
121.60250875410024
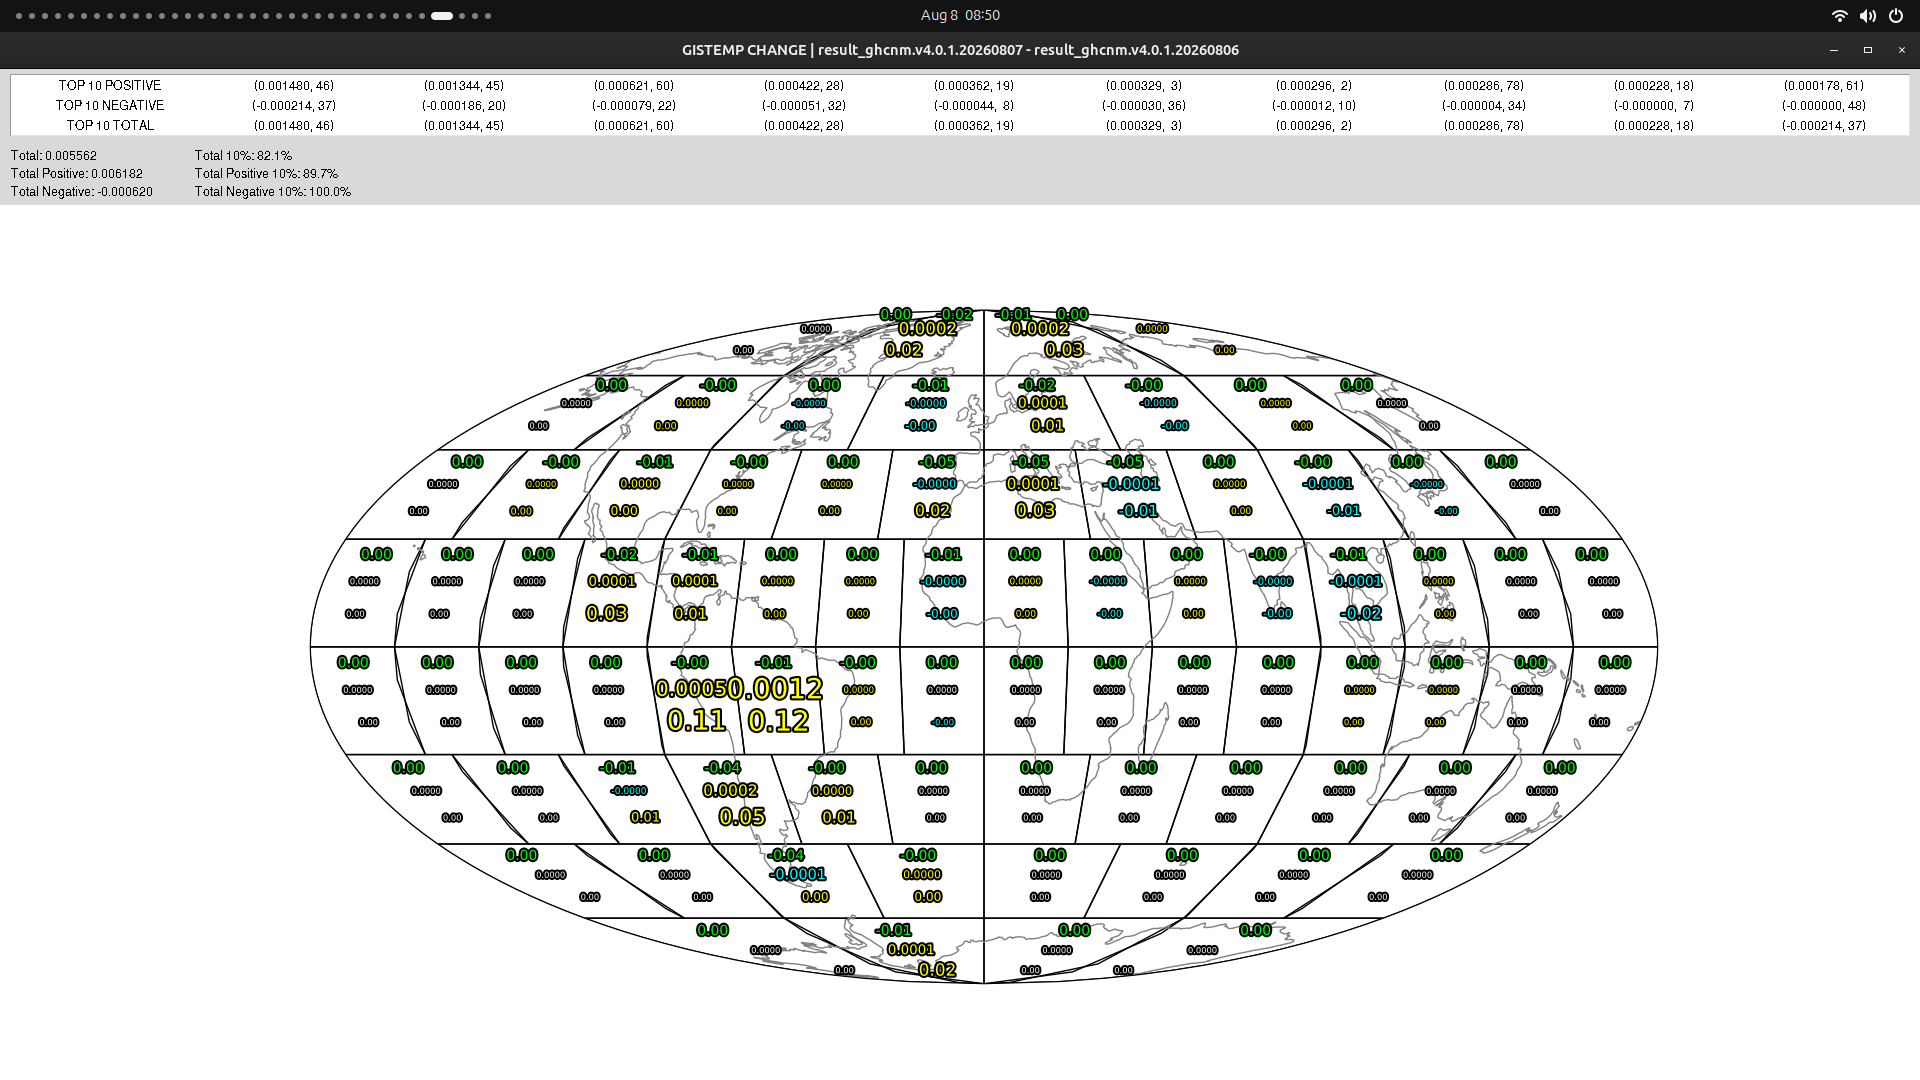
Roughly couple hundred stations added. Anomaly is around about where I expect it to stay.
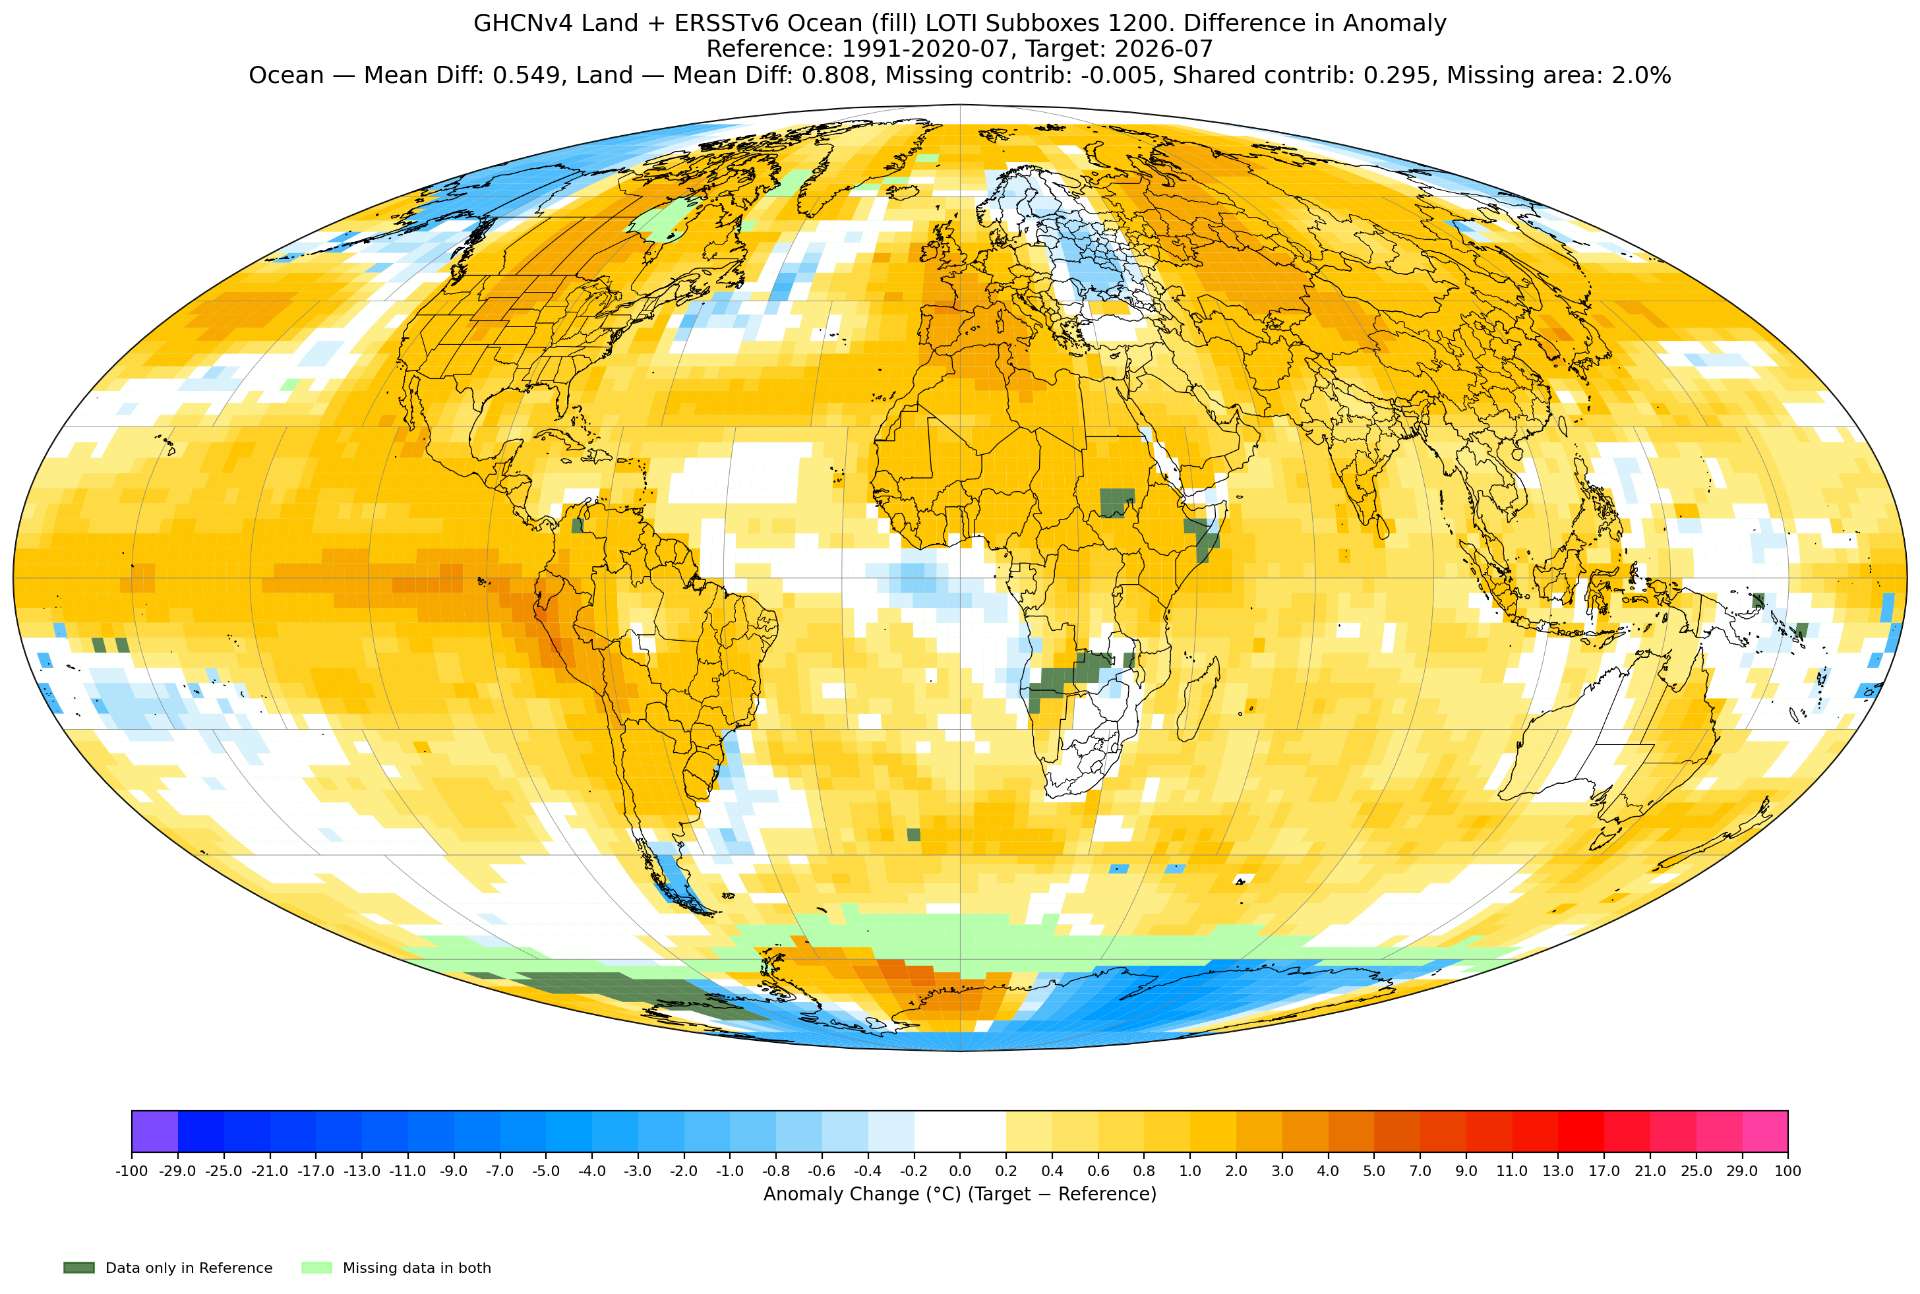
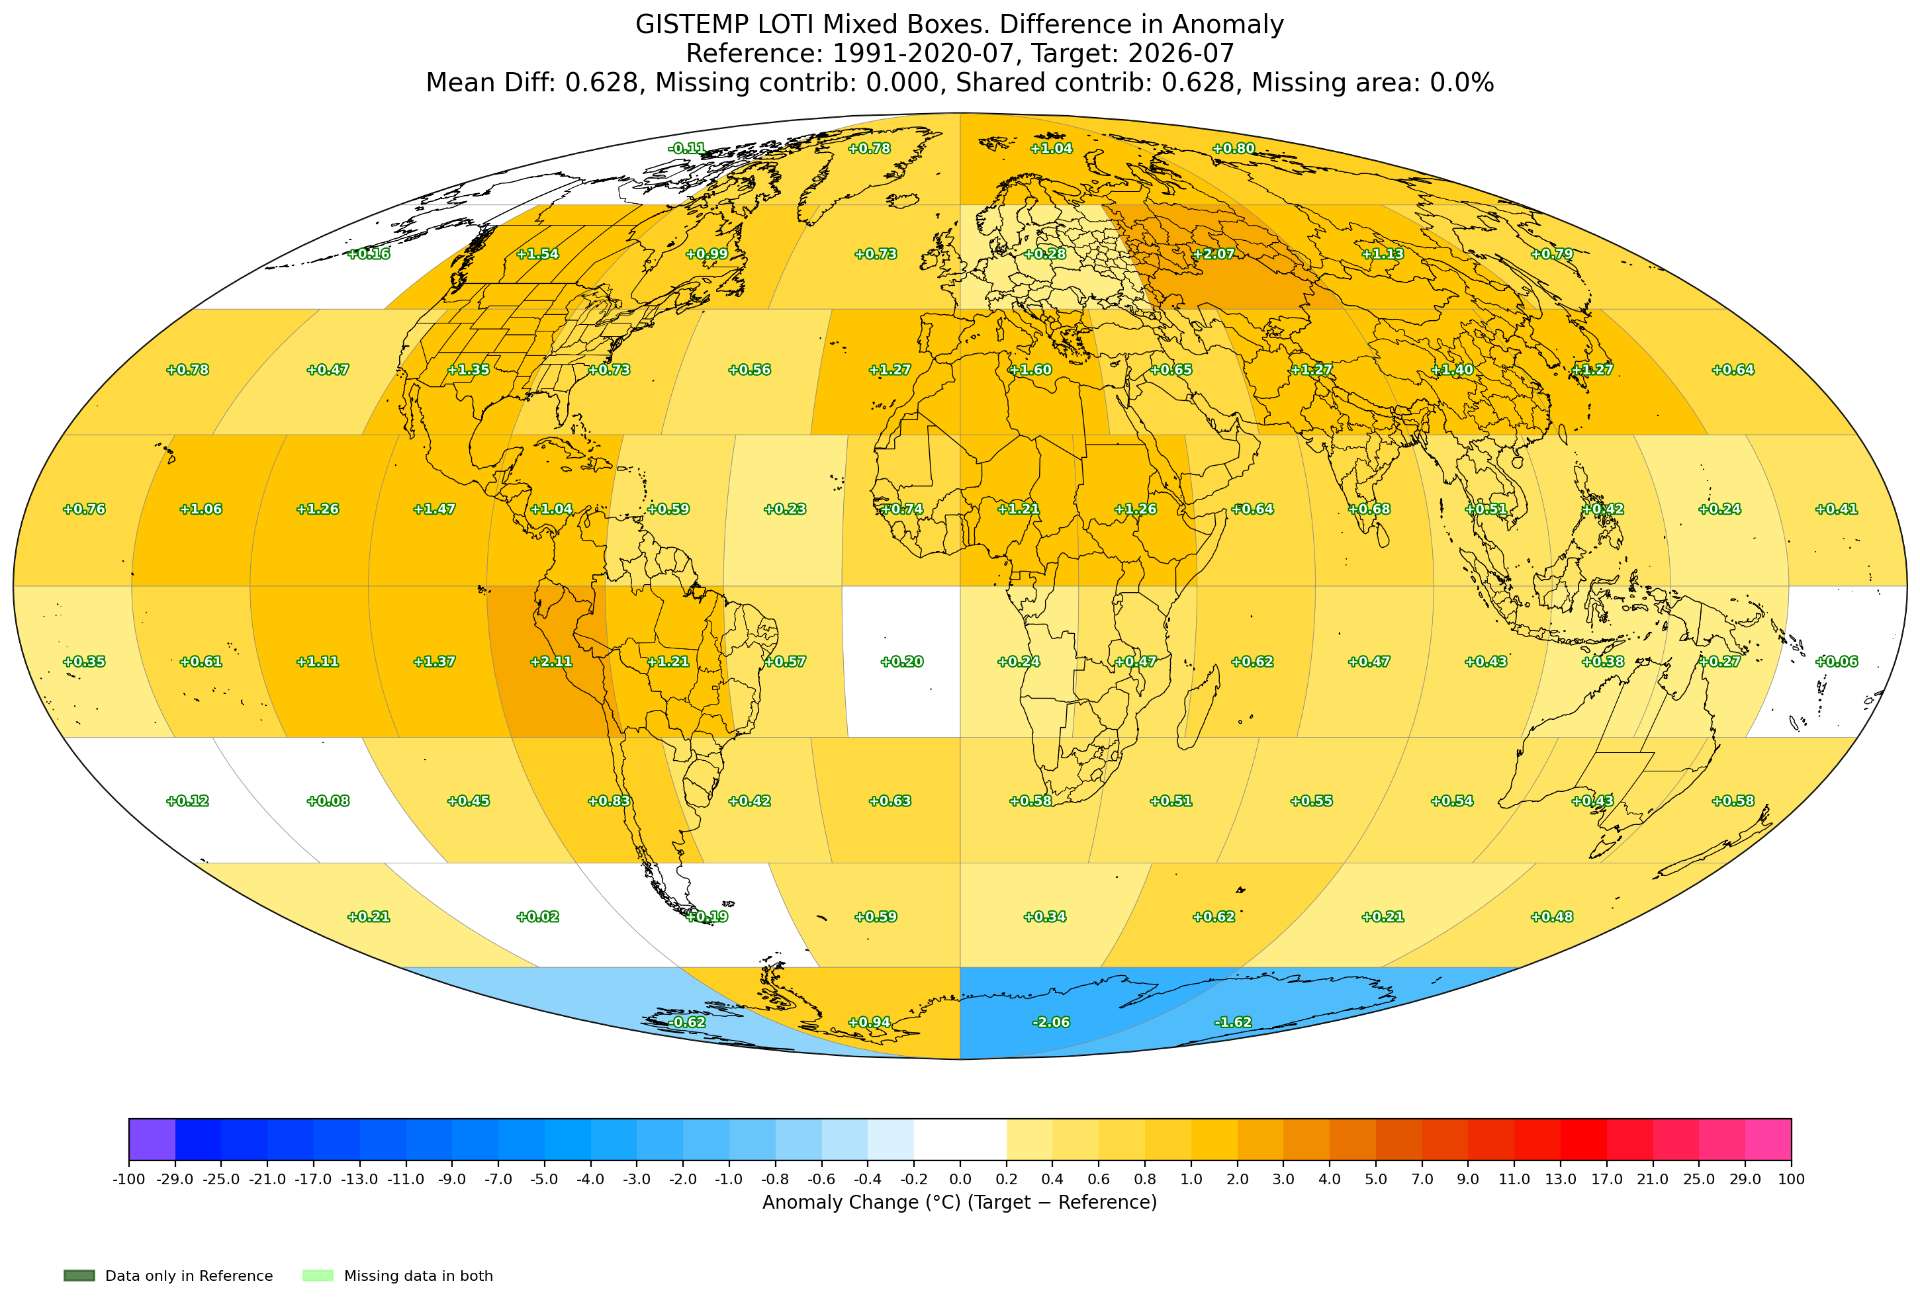
===
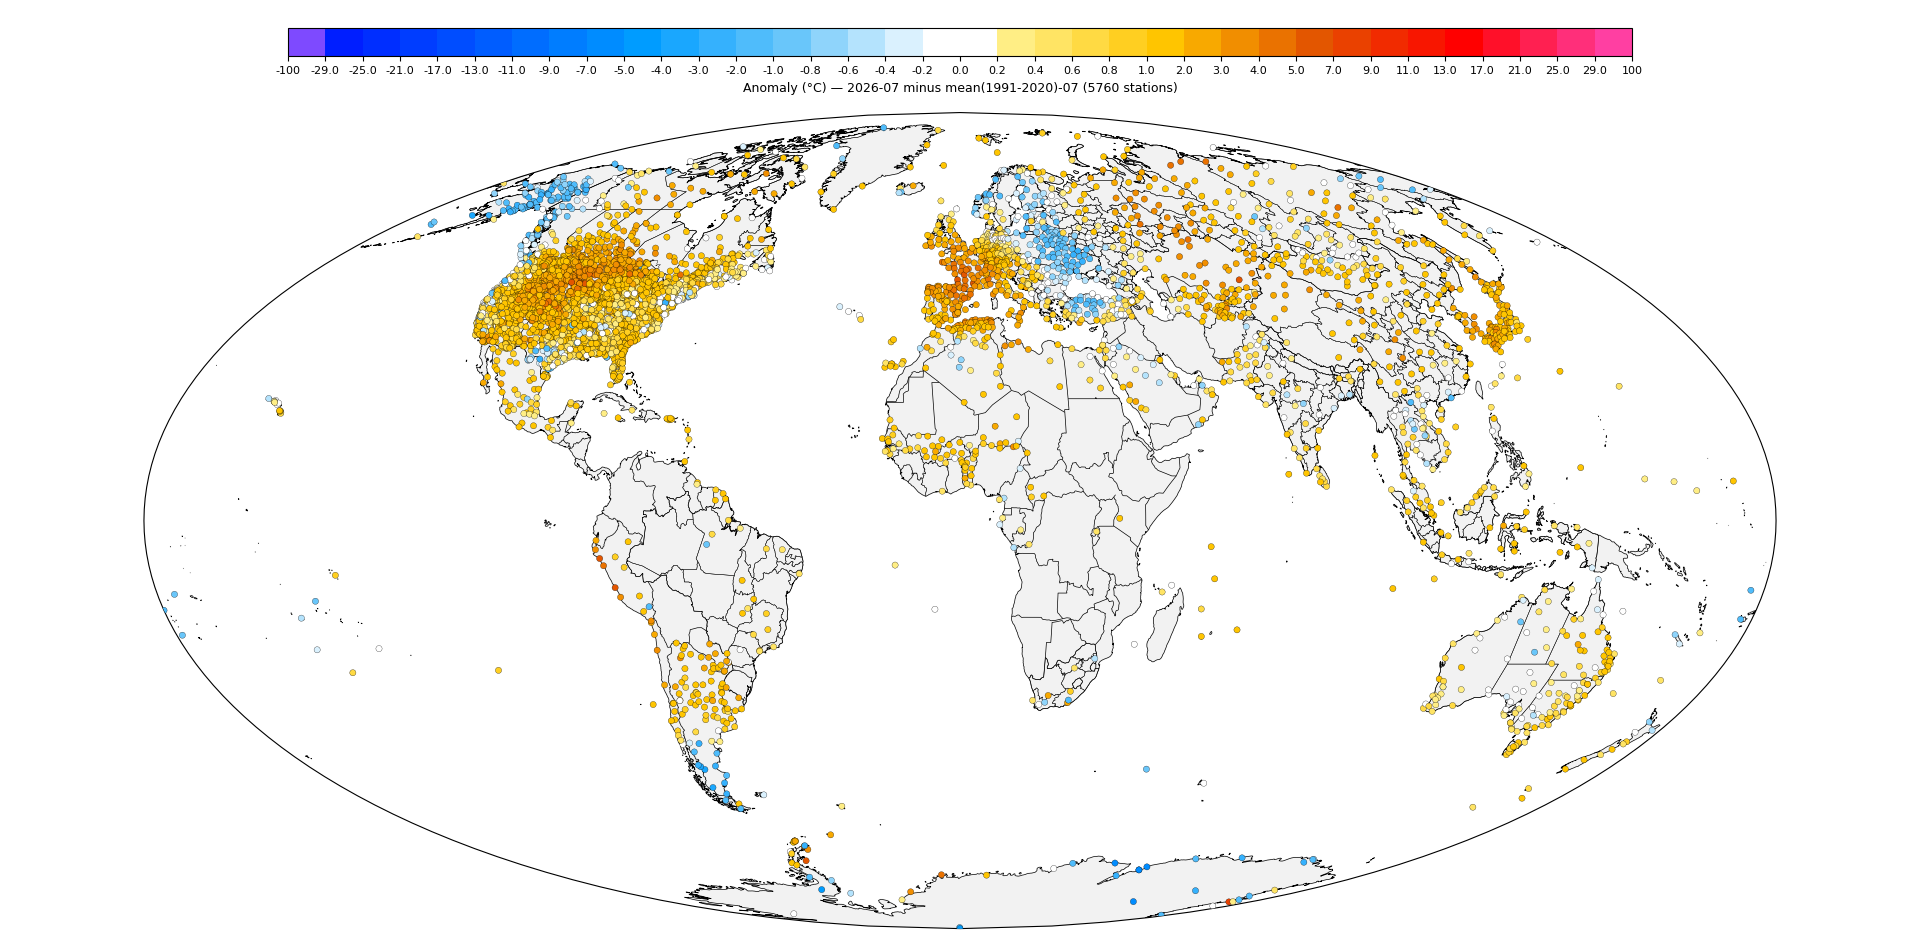
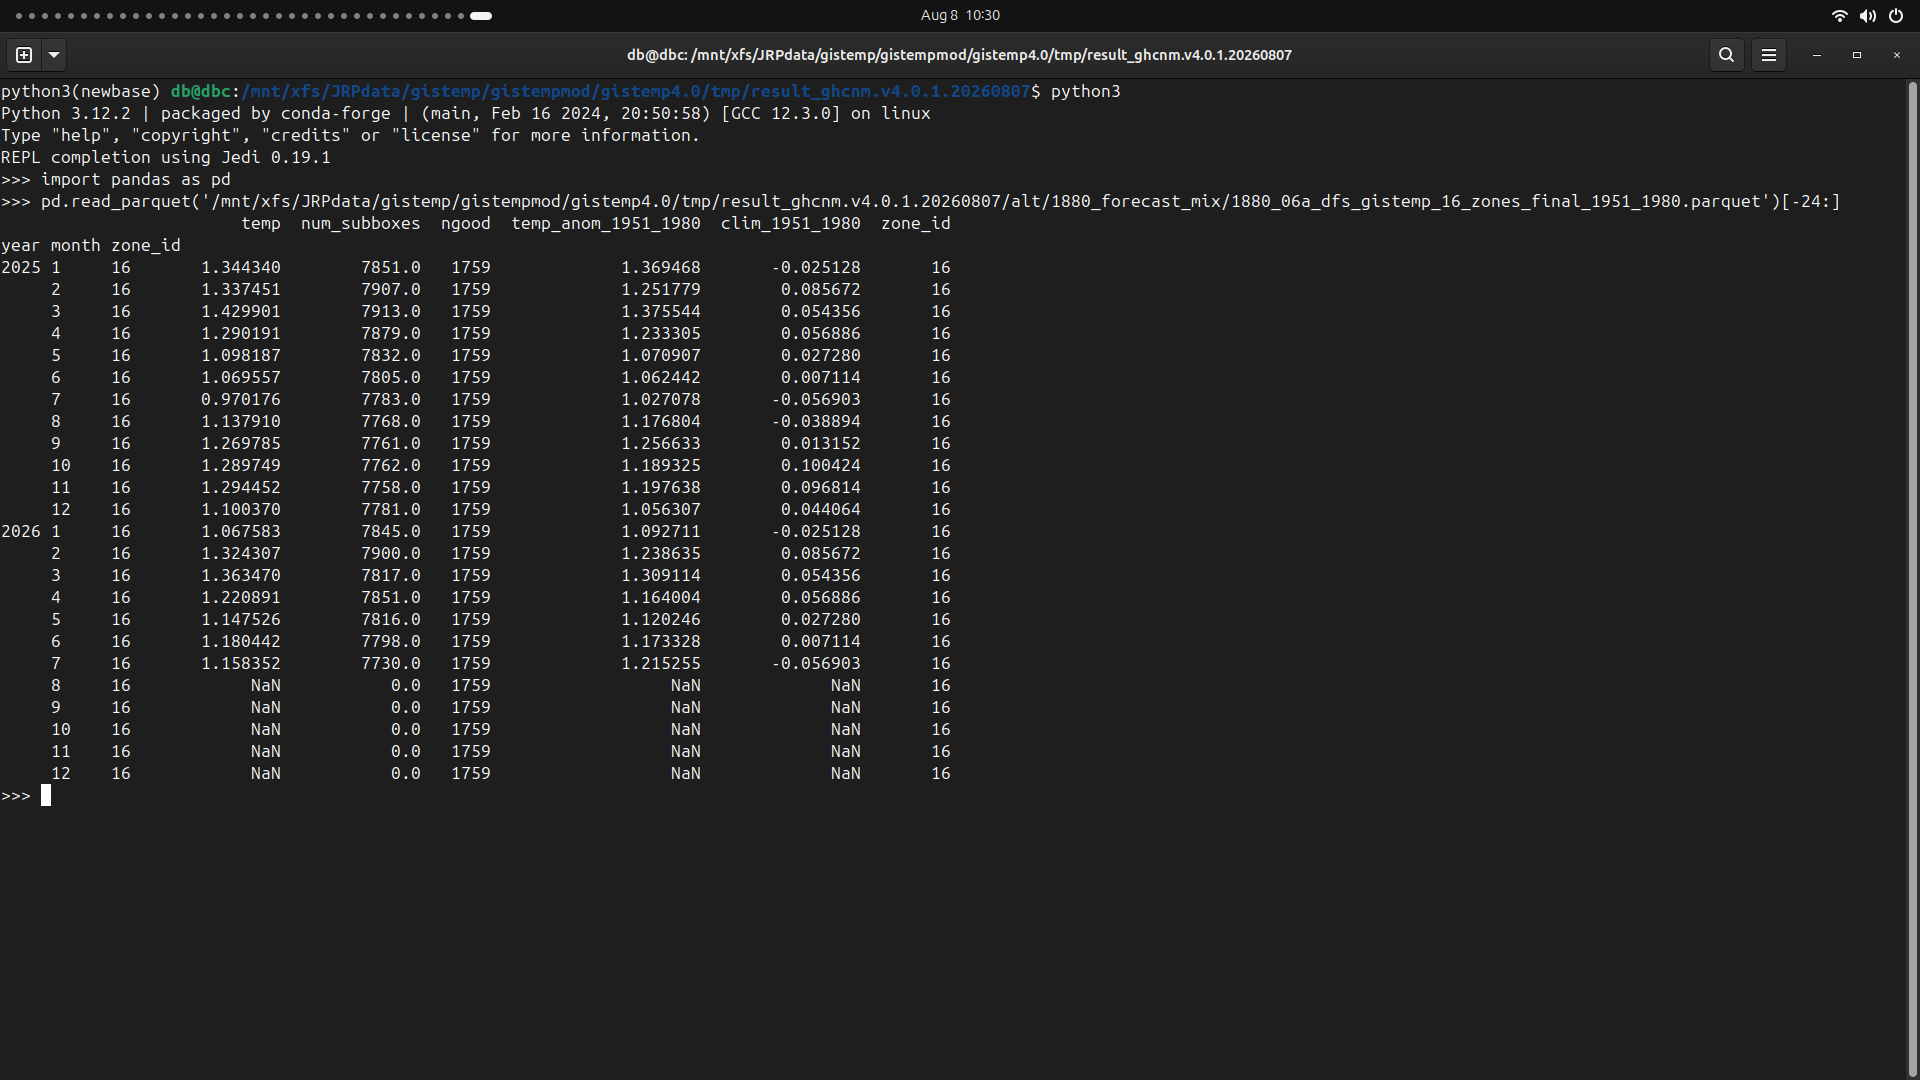
New product now suggests 1.215255 (very close to today's value, and yesterday's prediction is also around the current value of 1.216). Looks like it will still end up rounded to 1.22.
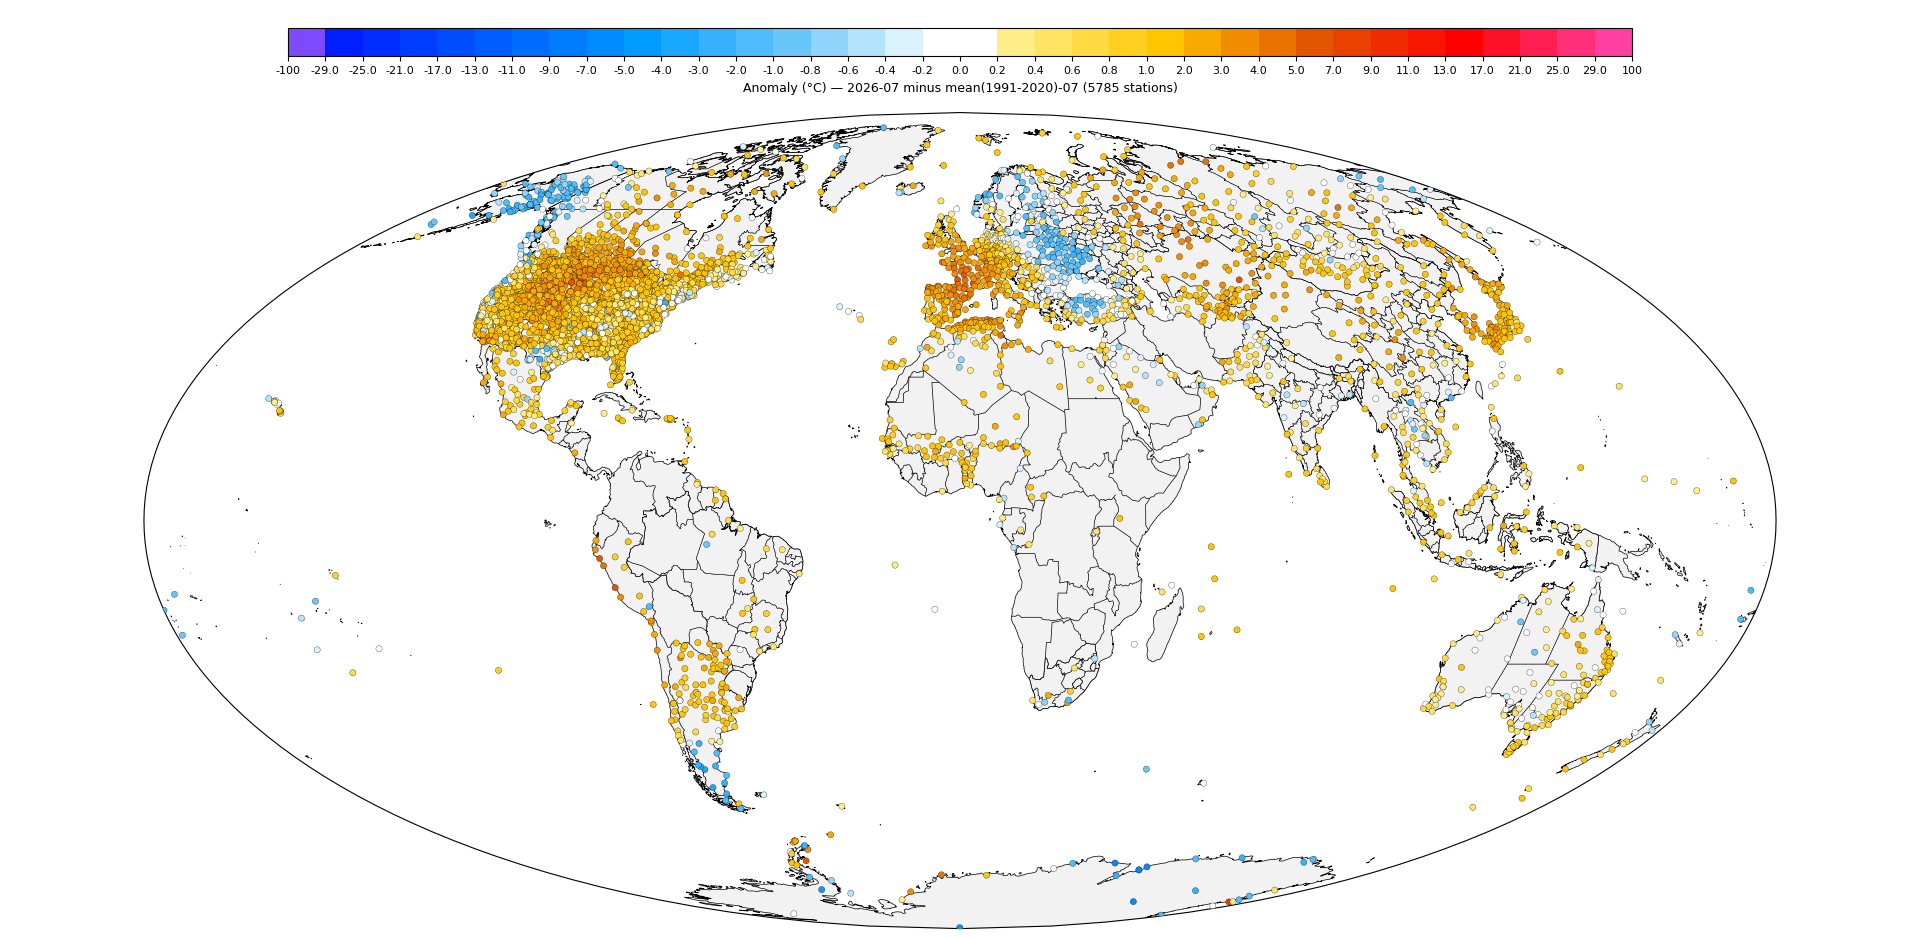
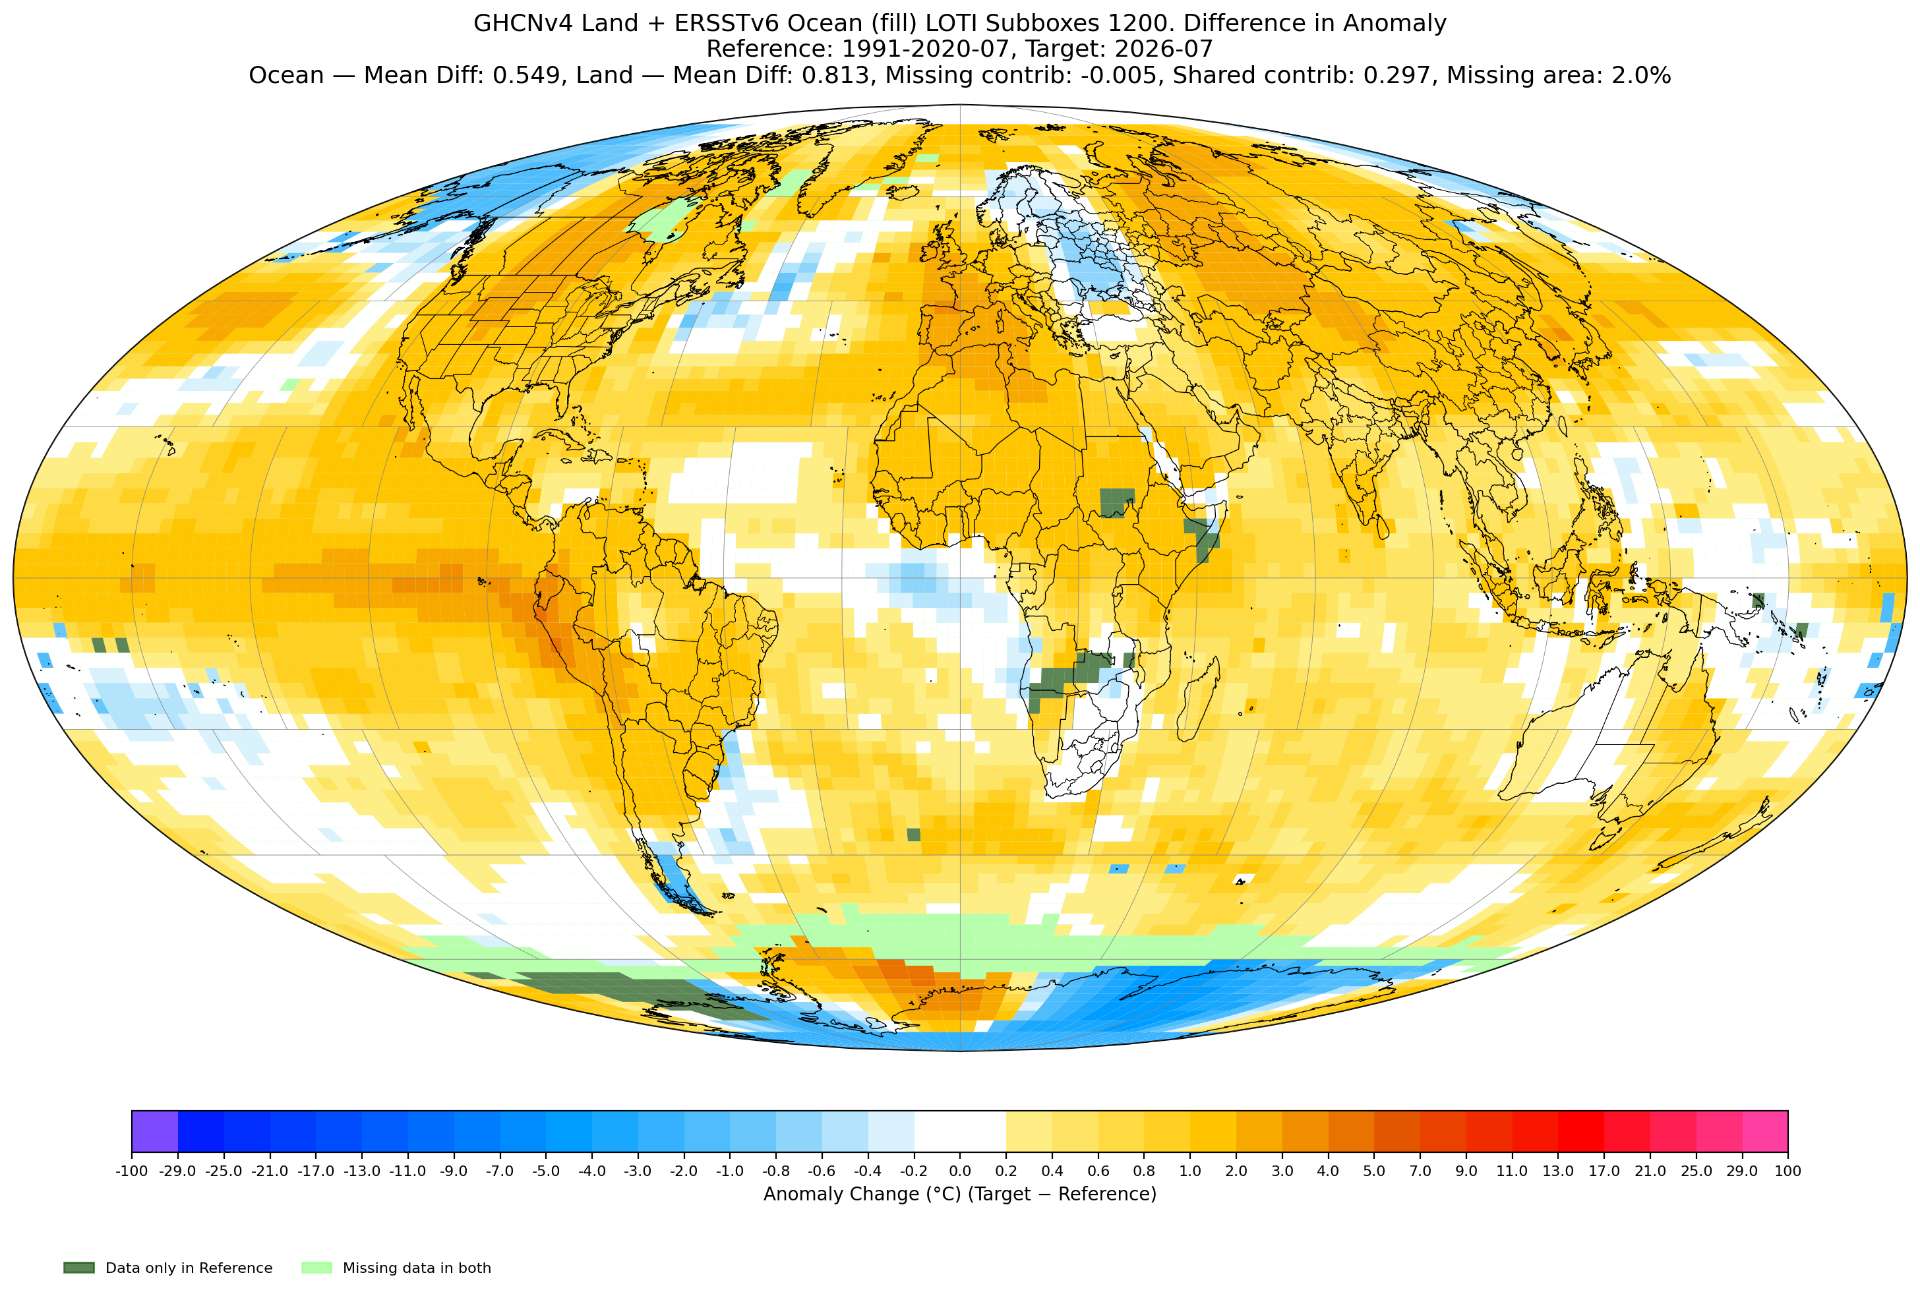
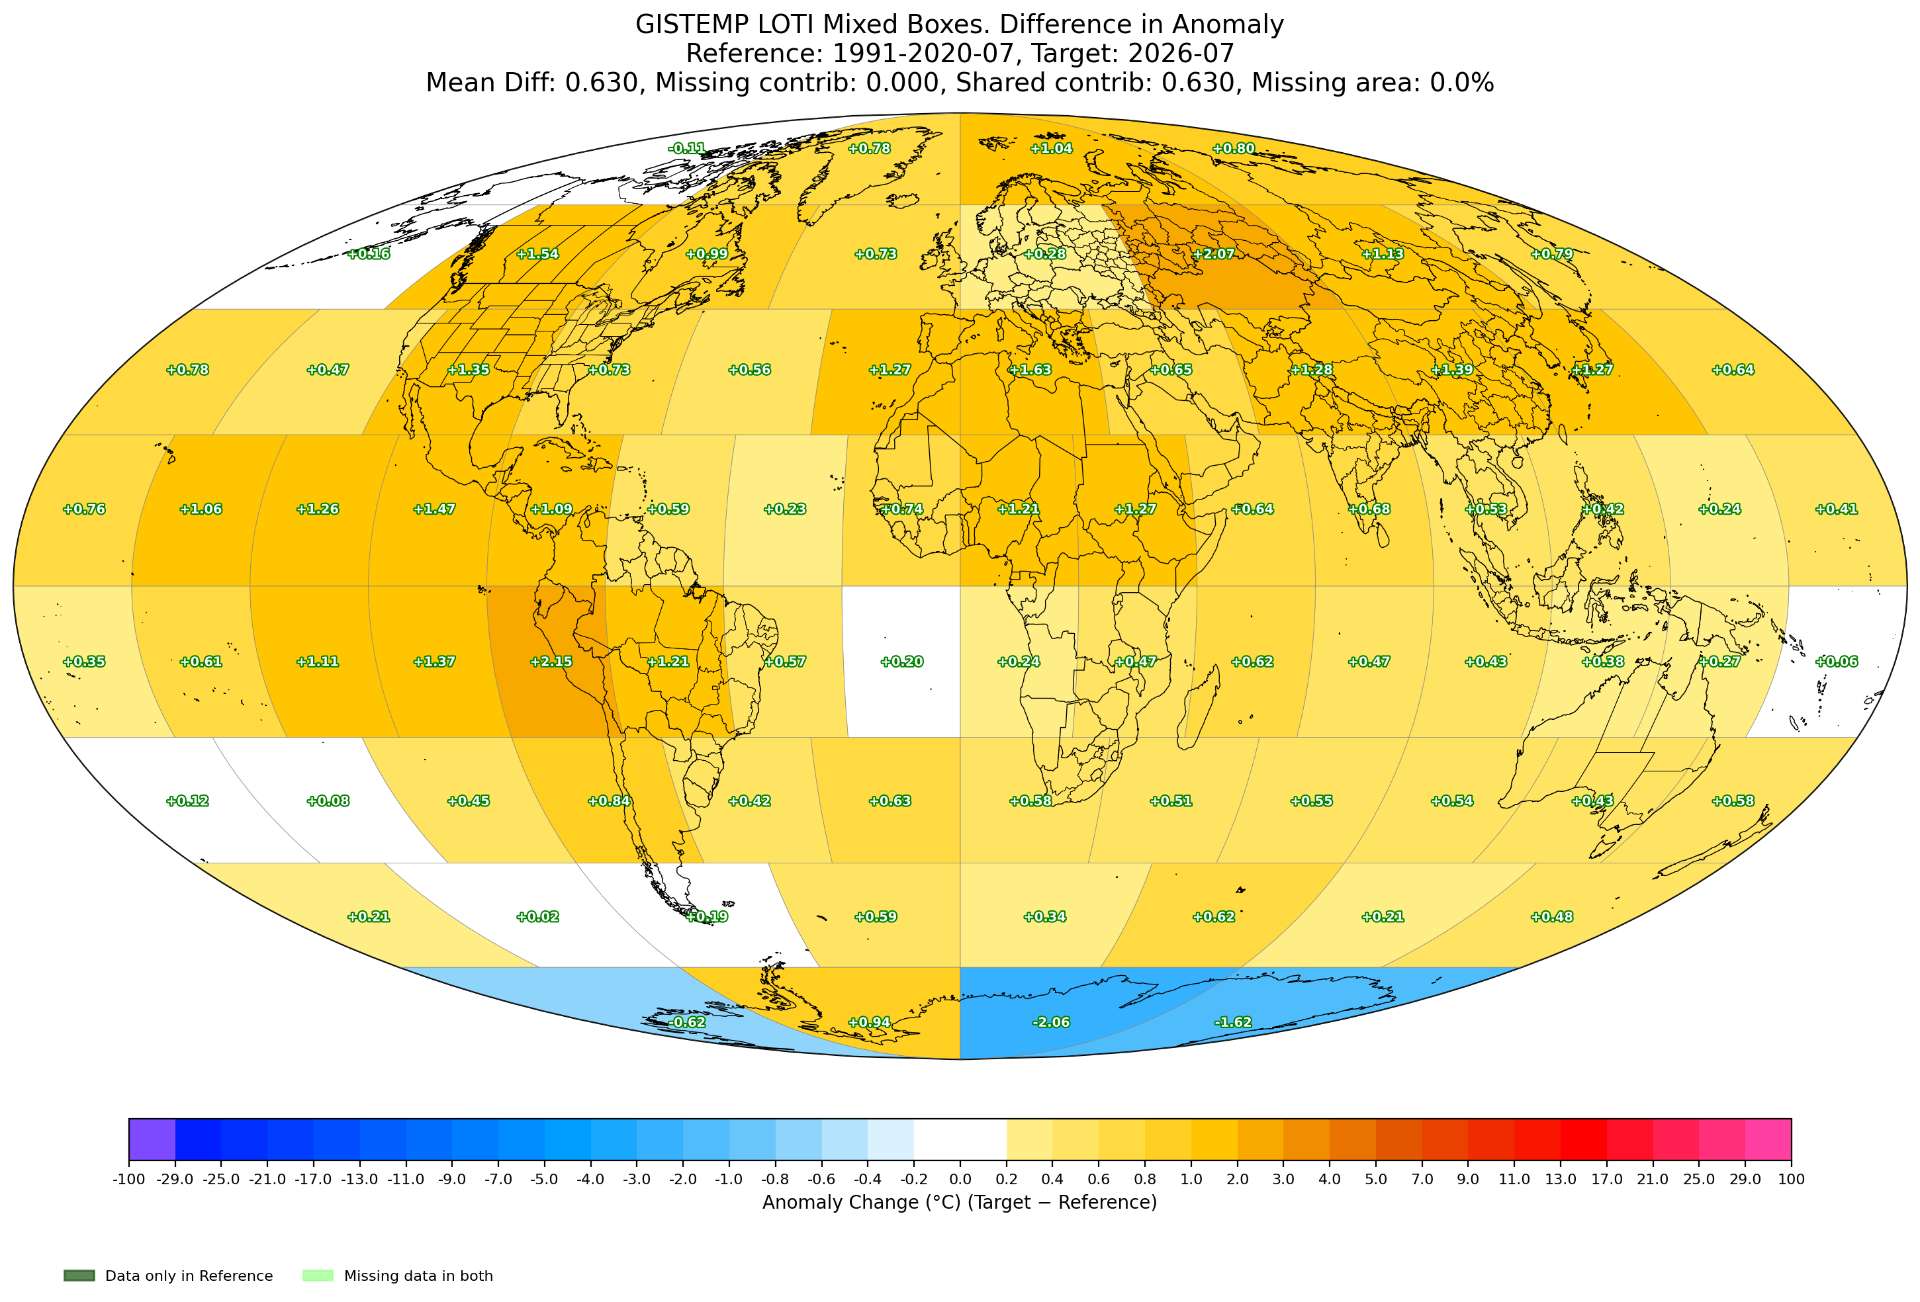
The older toggle product indicates almost all of the warming (0.006) came from the newly added stations from Chile and a couple new stations in Paraguay, warming the Brazil box further. It also wants to raise the global temp quite a bit higher (but still in the bin) to 1.2379, but its fairly obvious the weights are overdone for several places (a result of not basing it on the leading month's incomplete status, and expectating more stations in box 77 that aren't going to likely come in the next 2 days -- only maybe DOME_FUJI for box 79).
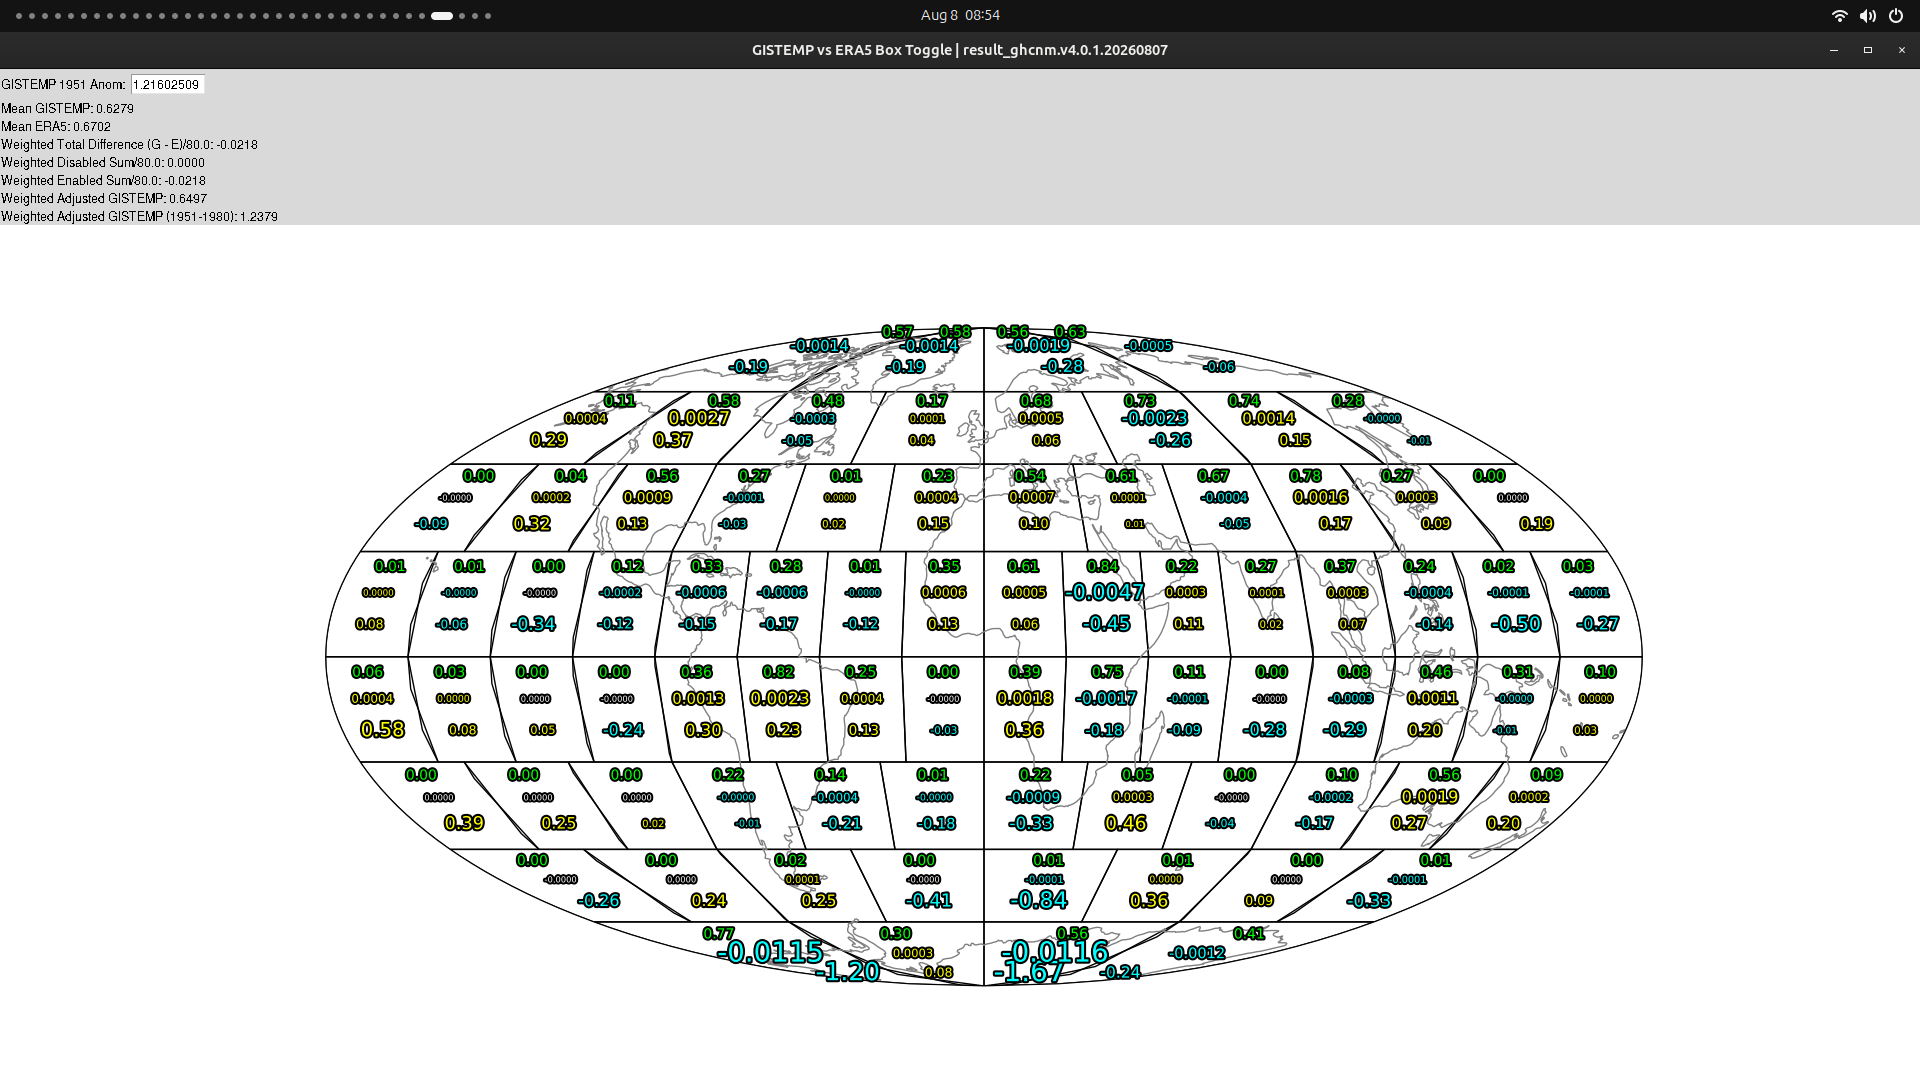
Change dialog (comparing today - yesterday boxes, holding ERA5 steady) (change in weights, change in global weighted value, change in box anom delta (change in G-E from yesterday)):
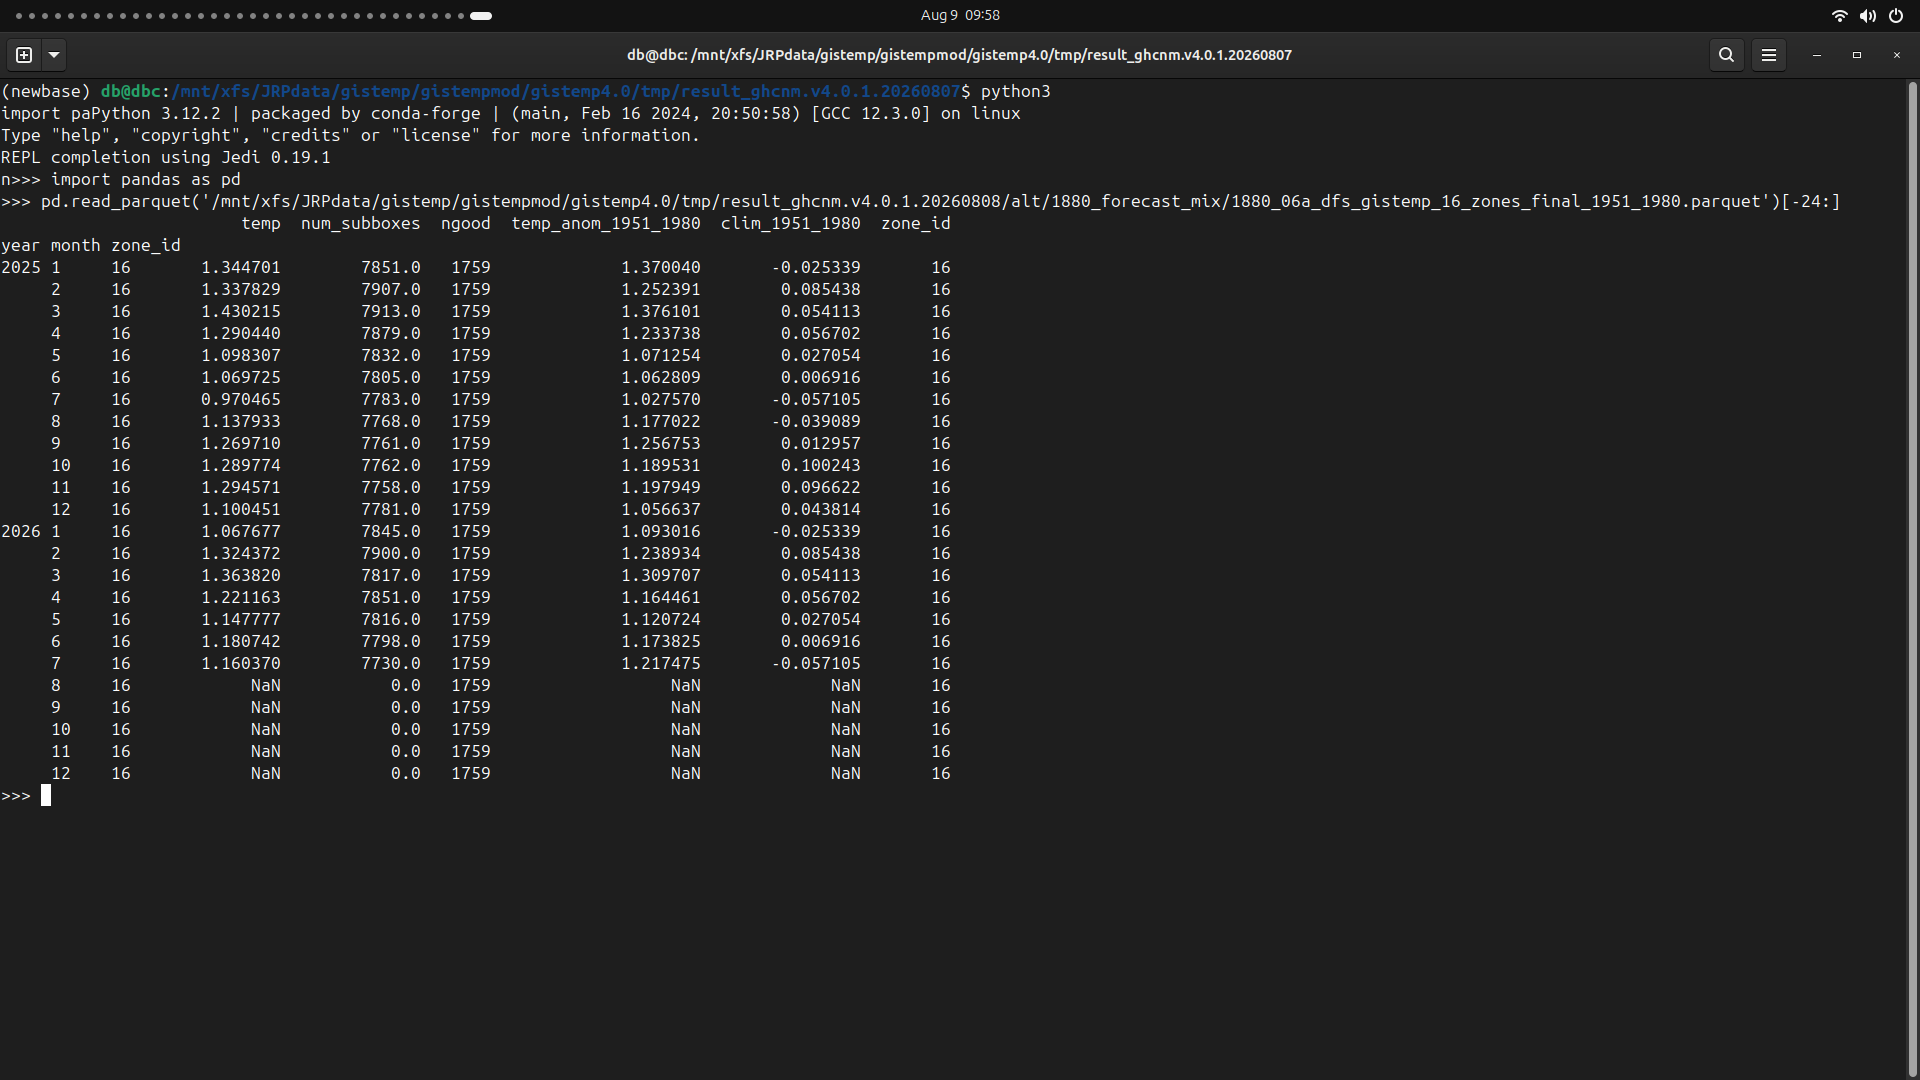
result_ghcnm.v4.0.1.20260809
121.8218417267427
==
Looks like no new stations, only revisions. Likely the final ghcnm used and final value (1.22) (assuming they go with this run and do switch to ERSSTV6).


edit:
I went back and did a hindcast using the new forecasting product using 20260805 to forecast 20260809.
The final value came out as 1.204402 rather than 1.189725. (So an error of 0.0138 rather than 0.0284). Obviously reducing the number of incorrect stations forecasted (as happened here from ~900 or so to 400 or so) that get added to the data improves the result, but the reduction seems to stem from that the simple bilinear method to interpolate the anomaly needs more work (not just which stations need to be predicted), as some hindcast analysis of the predictions shows (forecasting stations missing from 20260805 present in 20260809):

Clear cold bias on average ( which would explain why reducing the number added improved the prediction ), and the worst in stations no where near sea level ( Mutiara being in a valley in Indonesia, so I can see how its sampling nearby mountains would do poorly). Some elevation / lapse rate correction is the next step to see if it improves further...
Below I have the rerun of ersstv5 for this month at bottom... and
A minor correction to earlier:
MINNA_BLUFF was problematic after all. (See Edit v7. CLIMAT report is also problematic (16 days of missing data)).
Looking at the GCHNh data it only has ~27% of the month and of those reports they lack adequate temporal coverage IMO (missing 10 straight days of data (second week)):
(I've rounded the reports to the nearest 6h, and aggregated them by taking the mean):

Anyway you take the mean you don't get near the -30 of ERA5 (its missing some cold days):

I'm not sure how this passed GHCNm quality control etc given how much data is missing. I really need to look at the source code if I end up going this route of incorporating raw station data after all since I won't know what stations to include/exclude ...
~
I did this as some tests of testing the ERA5->raw station data predictions (using 3d corrections (now with climatological lapse rates, and further ghcnm corrections using simple bias correction over a climatological period)), and as part of that I ended up downloading the ghcnh data for Mina Bluff and Amundsen Scott.
Amundsen Scott was fine (only missing a single report) (although I learned it only reports at synoptic hours, not hourly, so this may contribute to some of the difference itself, since the ERA5 data is an hourly mean)

~
For reference, using the above method substituting stations present in 20260809 but absent in 20260802 (i.e. keeping 20260802 station data that is not missing as is) and rerunning gistemp with ersstv5 and the modified .dat :
result_ghcnm.v4.0.1.20260802_ersstv5 (original data)
116.53162485758675
with substitutions for missing stations (1102 stations):
121.82178068963847
repeating same experiment with 0805 and ersstv5 (which is a lot closer)
original is:
121.31605401656272
with ~411 stations substituted:
122.91302390976038
recall that the final value for this month was
result_ghcnm.v4.0.1.20260809_ersstv5:
123.42581422939676
So for 20260805 the error of the forecasted became -0.0051, versus the original error of -0.0211 (worth it in this case).
But for the early run of 20260802, the error of the forecasted was -0.0160 versus the original error of -0.0689. Even though its better than the run 3 days later, its probably still not good enough when its close to the margins and this is only one sample month.
~
TODO: In order to disentangle the PHA and the updates to the stations I still need to rerun the same couple experiments but with the 20260809 station data substituted into those for the stations I didn't predict (those updated through GHCNm PHA later on but those I didn't swap with my predictions)...
Edit (1):
With the 1102 station predictions (1102 stations missing from 0802) replacing the 0809 data:
122.55052445896087
leaving an error of -0.0088 (so a reduction of about 0.007 C).
Edit (2-4) (collapsed corrections):
Replacing all the station data (forecasting all stations in 0809)
121.80676036681038
Differencing the subboxes reveals better where alot of the errors are (blue=GISTEMP cooler than predicted == model predicted too warm)....

(rounded values):

The aggregate boxes/bands/zones have cancellations so they are less useful here.
Looking at some diagnostics in the historical period... I corrected the the lat/lon/elevation for Ojibwe too see if there was any improvement (it was negligible)..

So, the Michigan station (Ojibwe) continued to stand out. After investigating, I realized despite the incorrect metadata lat/lon/elevation a bit off (in the water), that the source of the variance, bias and error is the microclimate on that Island in Lake Superior, since the neighboring t2m points in the ERA5 grid are going to be much cooler than the land temp on the island (Isle Royale National Park)). I did check with the synoptic data to verify it did have good temporal coverage this July (121/124 periods).
===
I tried a variant of the 3d interpolation that used the LSM to pick different points when the land fraction is low (pick nearby neighbors that are have a larger land fraction). This does appear to take care of island stations in lakes given that that station then disappeared afterwards in calculating the worst biases...

aggregate statistics before:

after:
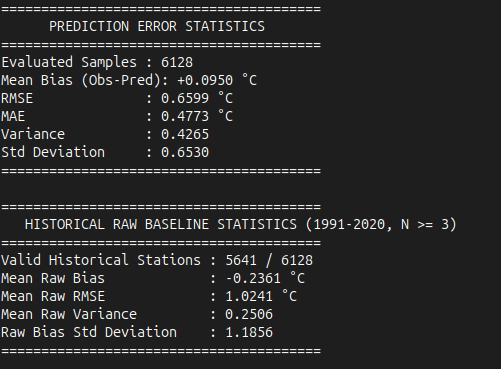
The RMSE change was negligible; but the bias did decrease in the prediction month, but it worsened over the climatological period...
~~~~
Edit (5):
Since I have the station weights I can now plot the contributions from the stations globally (this is not the true contribution as that is not possible, but it is a very good proxy since it is weighted by summing the actual contributions for each subbox using the prediction error from ERA5->GISTEMP using the interpolation described above.
This is a plot I've been wanting to have done for a long time ...
It is just for July 2026 (remember its the leading preliminary month, with less contributing stations: 6128)

(Blue again means ERA5 station prediction is warm relative to GISTEMP (color from BIAS = GISTEMP-ERA5 prediction ).
This matches what we see from the above subbox plots but reveals which particular stations are contributing (for instance the Rwanda station is outsized as expected, and so are the two northern most SA stations (although with different biases). Outside of these Antarctica as expected is the largest contributors to why the ERA5 is too warm in these areas. There is also a large warm bias in ERA5 prediction sitting in Brazil.
However the global prediction is on the cool side... Several Antarctica stations are also on the cool side on the Peninsula.
Outside of this, in Japan we can see a clump of individually smaller, warm contributors but in aggregate they are biasing that whole box too cold. The Arctic (Greenland and a couple Russian stations are also having a large influence). Overall there is alot of bias even for the less biased (in terms of magnitude) cooler stations (S. America, Australia, Canada).
Some of the Australia and Canada maybe from the PHA effects from GHCNm.
Here is a plot for reference of just the global weights (larger where there is lower station density in a station's neighborhood (the 1200km gridding radius)

~~
The above is hard to interpret in aggregate, so I aggregate them by country next (with the marker centroid for abs error and centroid by global weight using a 3d geocentric cartesian method).
Since it's centered and sized appropriately its much clearer in the first plot (with it's centroid based on the weighted_abs_error, i.e. the marker ends up where most of the mass of the error was relative to stations influence over subboxes). The coloring is the summation within the country's grouping, and its bias value is multiplied by 100.
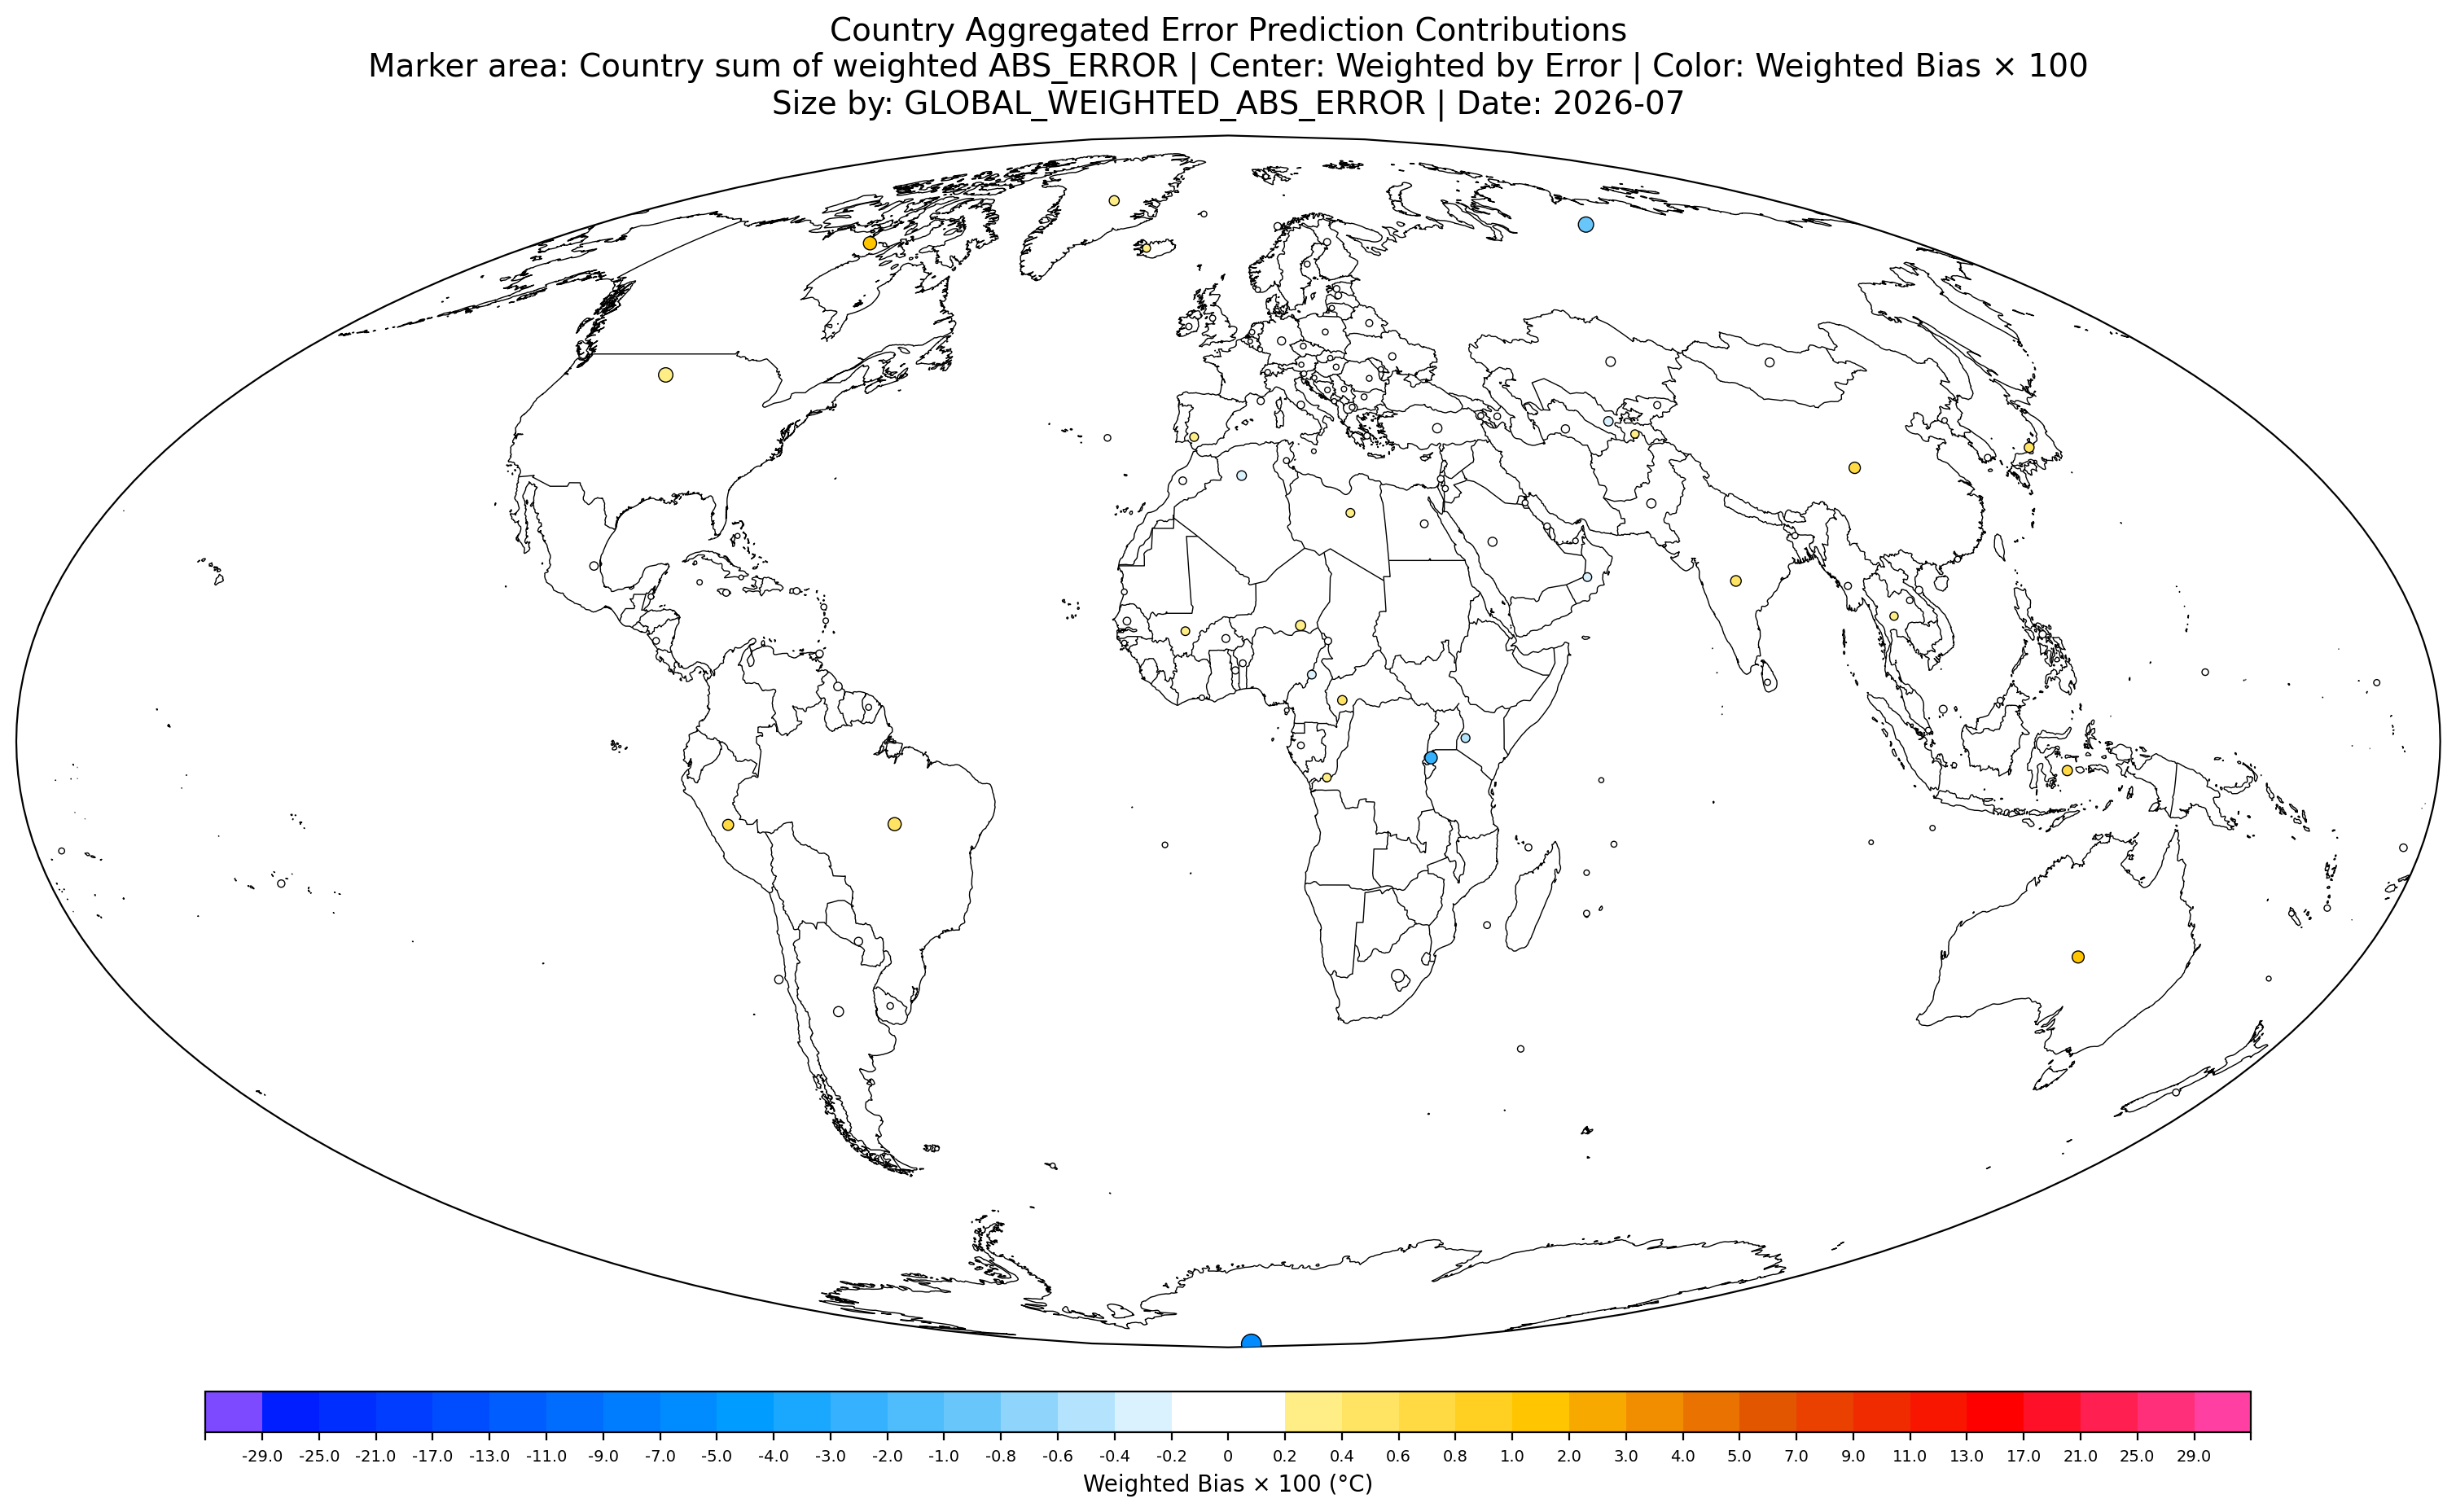
Antarctica, Rwanda, Russia are the only countries where in aggregate we are predicting too warm. Everywhere else we are predicting too cold using ERA5.
Where the markers are neutral colored despite being larger, that means the errors are largely cancelling out within that country.
~
Global weights by country (centroid by the country's weights). This turned out to be a very interesting plot: my interpretation is that the centroid then shows the distortion that the countries weights have spatially through the GISTEMP regridding into subboxes, i.e. the high US density relative to Canada biases the subboxes in Canada (as I've complained before but now an exact plotting of this) and Canada's gradual lower station density towards the poles biases the subboxes in the Arctic unevenly more so as a result (since the Canadian subboxes closer to the US are dominated by the US themselves):

Edit (6):
Looking at the (weighted) fractional variance from the prediction errors in the climatological period (where there is overlap), aggregated by country, shows the predictions in Antarctica still are the worst (42% of the weighted global station variance from Antarctica), followed by Russia at around 9%. Looking at the cumulative sum, just 5 countries make up 2/3 of the variance: Antarctica, Russia, Canada, Pakistan, US.

~10% globally is from Minna Bluff alone, followed by 3% from D47 and Fossil Bluff...

(7)
the CLIMAT data on ogimet for MINNA BLUFF, and also archived on dwd's monitoring both show it missing 16 days of data
https://www.ogimet.com/cgi-bin/gclimat?lang=en&mode=0&ind=89768&ord=DIR&year=2026&mes=7&months=12
CLIMAT 07026
89768 111 18745 29828 31212030 412111252 5009 8001699 9000000
      333 23131 8000000
444 0118220 1130516 2116720 3131016 5411918=2026;07;89768;1;08745;2;09828;3;1;212;030;4;1;211;1;252;5;009;;;;;;;;8;00;16;9;9;9;00;00;00;;;;;;;;;;;;;;;;;;;;;;;;;;;;;;;;;;;;;;2;31;31;;;;;;;;;;;;;;;;8;00;00;00;;;;;0;1;182;20;1;1;305;16;2;1;167;20;3;1;310;16;;;;5;4;119;18;;;;;;;WMO TD 1188 describes you how to decode section 1 group 8 (the third and fourth digit after group 8 in section 1 (111) is the number of days missing) (ogimet's data does not show section 8 when its all 0 for some reason (bufr decoding issue?) even though its mandatory -- this is why the DWD data was a good check):
2.2.2.2.8 8mPmPmTmTmTxmTn
Group 8 – Numbers of days missing from the records for pressure and air
temperature parameters
The definitions given in 2.2.2.1 for the numbers of days missing from the records for the respective
month for the different pressure and air temperature parameters shall be used (mP, mT, mTx and mTn).
Group 8 shall always be included in Section 1 of a CLIMAT Report.
mPmP – Number of days missing from the record for daily mean pressure
mPmP shall be encoded as the value of mP (inclusive preceding zero, if necessary).
mTmT – Number of days missing from the record for daily mean air temperature
mTmT shall be encoded as the value of mT (inclusive preceding zero, if necessary).
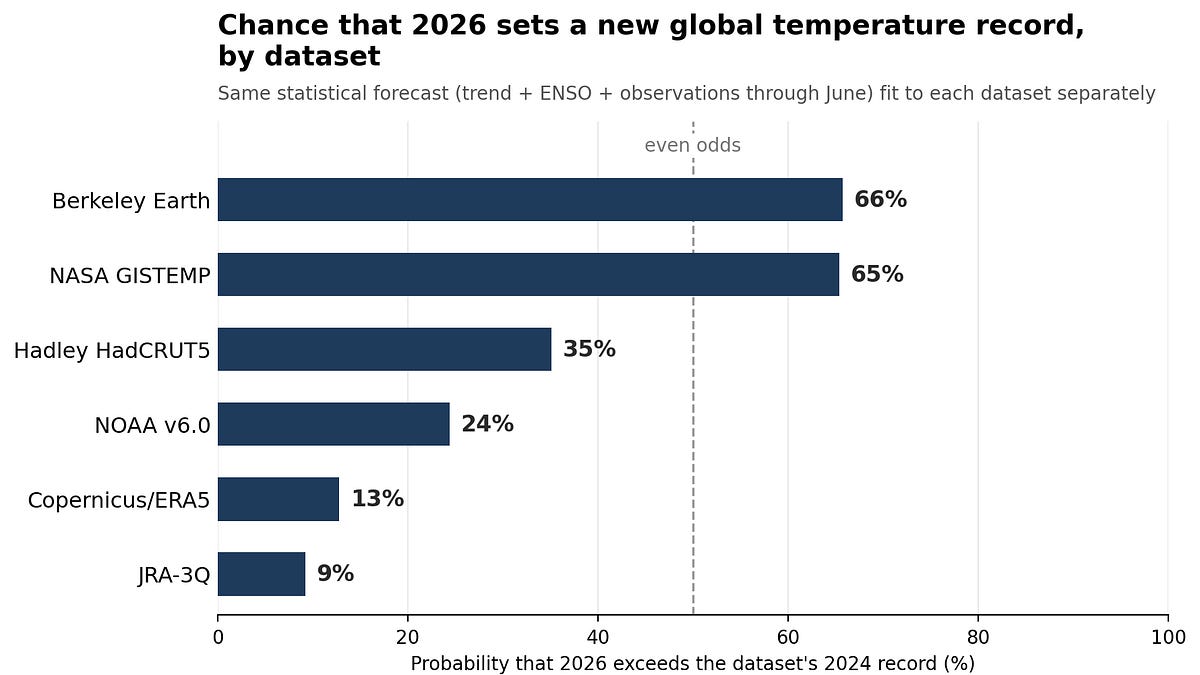
Would love an annual gistemp market like these monthlies.
https://www.theclimatebrink.com/p/why-hansen-may-end-up-being-right
August 2026 market
oops answer wrong try again now at
/ChristopherRandles/global-average-temperature-august-2-dECE9E96uA
@ChristopherRandles None of the links to the new market are correct (not in the market description nor in your post). Here is the new one..
@parhizj Strange I was sure I had edited it and tested it. Not sure if a cache issue might explain it but have edited again.
In case bettors aren't aware, ERSSTv5 has been discontinued as of this month.
(see https://psl.noaa.gov/data/notices/)
So, next month necessarily I believe GISTEMP will have to shift to ERSSTv6 (some relatively small code changes).
I had to get the fortran version of the GISTEMP ERSST -> SBBX code working finally (using NCEI's monthly .nc files) rather than using my old hacky code to generate from the existing SBBX as a reference (its much faster this way). Also had to modify my fork of GISTEMP to update to use these changes (haven't pushed any of these changes to my repo since my tree is very messy atm).
For reference, here are the parquets of the GISTEMP global means (i.e. from result/mixedGLB.Ts.ERSSTV5.GHCN.CL.PA.csv), with runs both using ghcnm.v4.0.1.20260707 (which was used for the June GISTEMP run), and one with the ERSSTv5 and ERSSTv6.
https://jrpdata.free.nf/gistemp/loti_ersstv5.parquet
https://jrpdata.free.nf/gistemp/loti_ersstv6.parquet
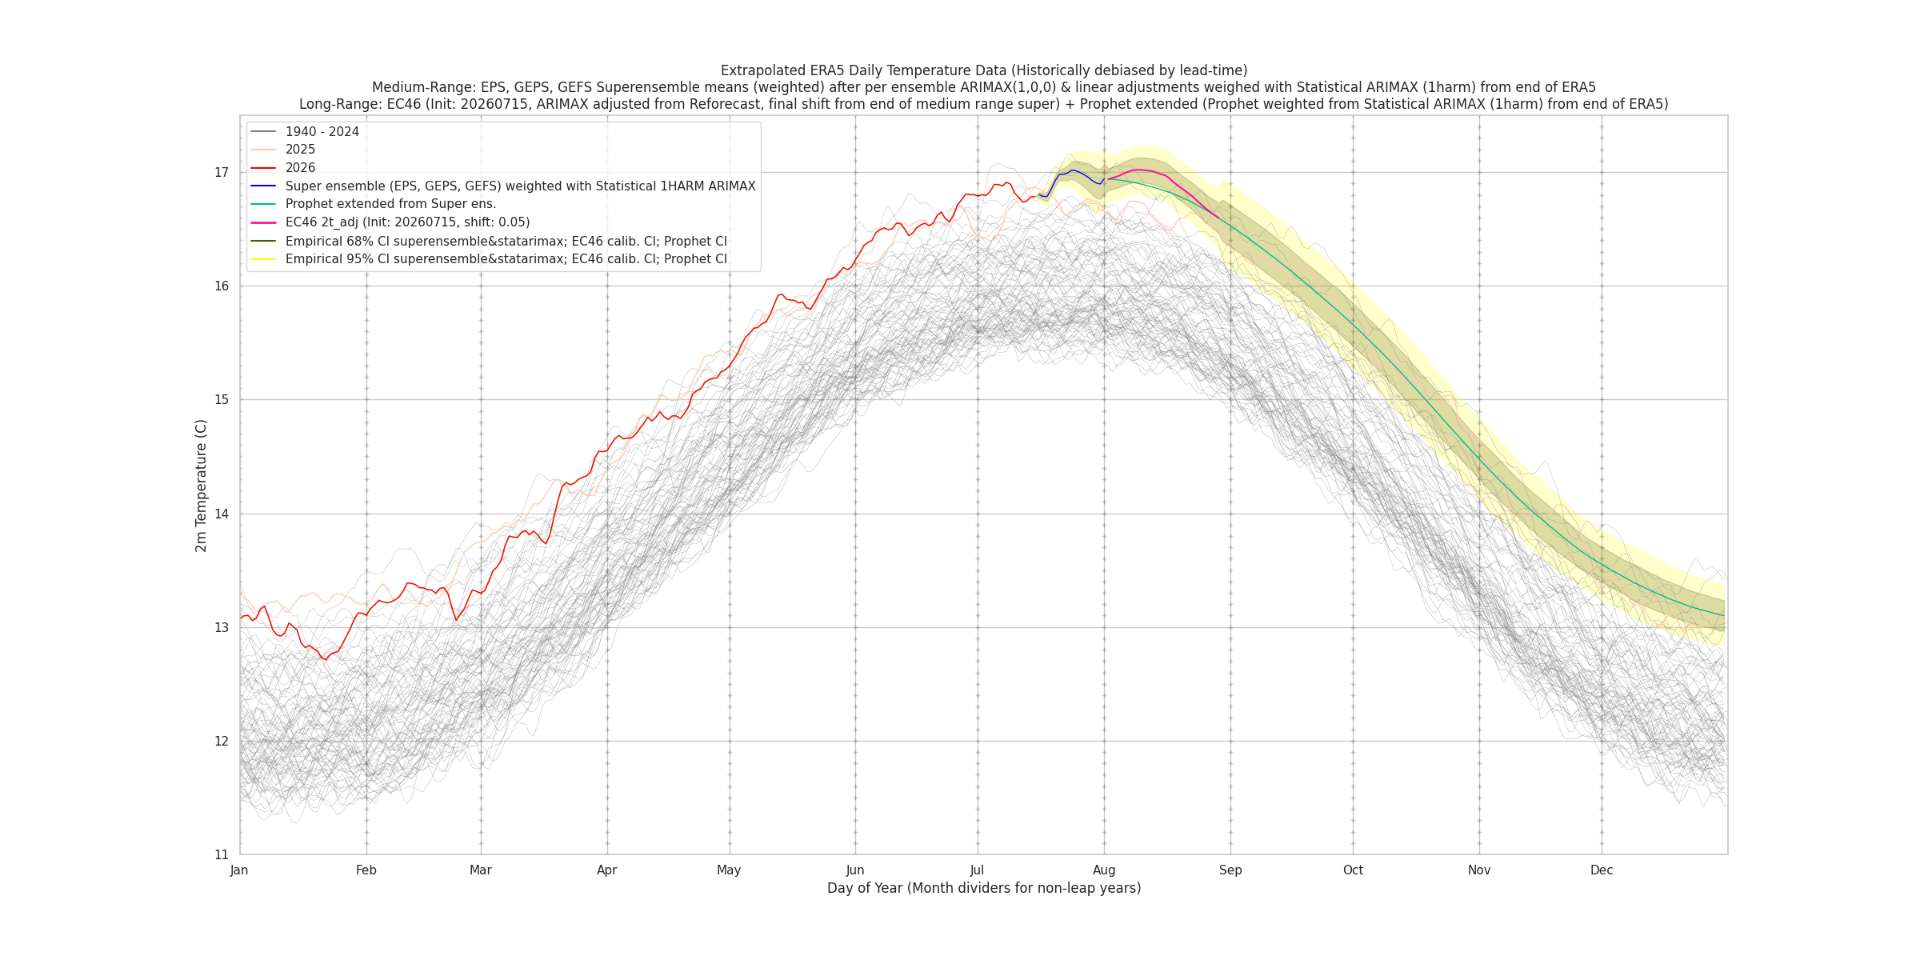
Anyway here is what I have so far for July 2026 using this new ERSSTv6:
(edit: forgot to update pipeline for delta method (recalculating the gistemp boxes; i.e. switching to ERSSTv6 dropped the 1.2502 C to 1.2244 for that method !! this also dropped the weights as well for it slightly)
weights: old, delta2 method, loti analog3 method: 0.2281, 0.4684, 0.3034
Point estimate (old, delta2 method, loti3 method) adjusted by prediction error mean: 1.2062, 1.2244 1.1946
Point estimate (mix), pre-adjusted by member prediction error mean: 1.2112
Probs (mix) with super ens var
Std. dev.: 0.0388
Bin Probability (%)
<1.095 0.1
1.095-1.145 4.3
1.145-1.195 29.4
1.195-1.245 47.0
1.245-1.295 17.6
>1.295 1.5
Thanks for sharing.
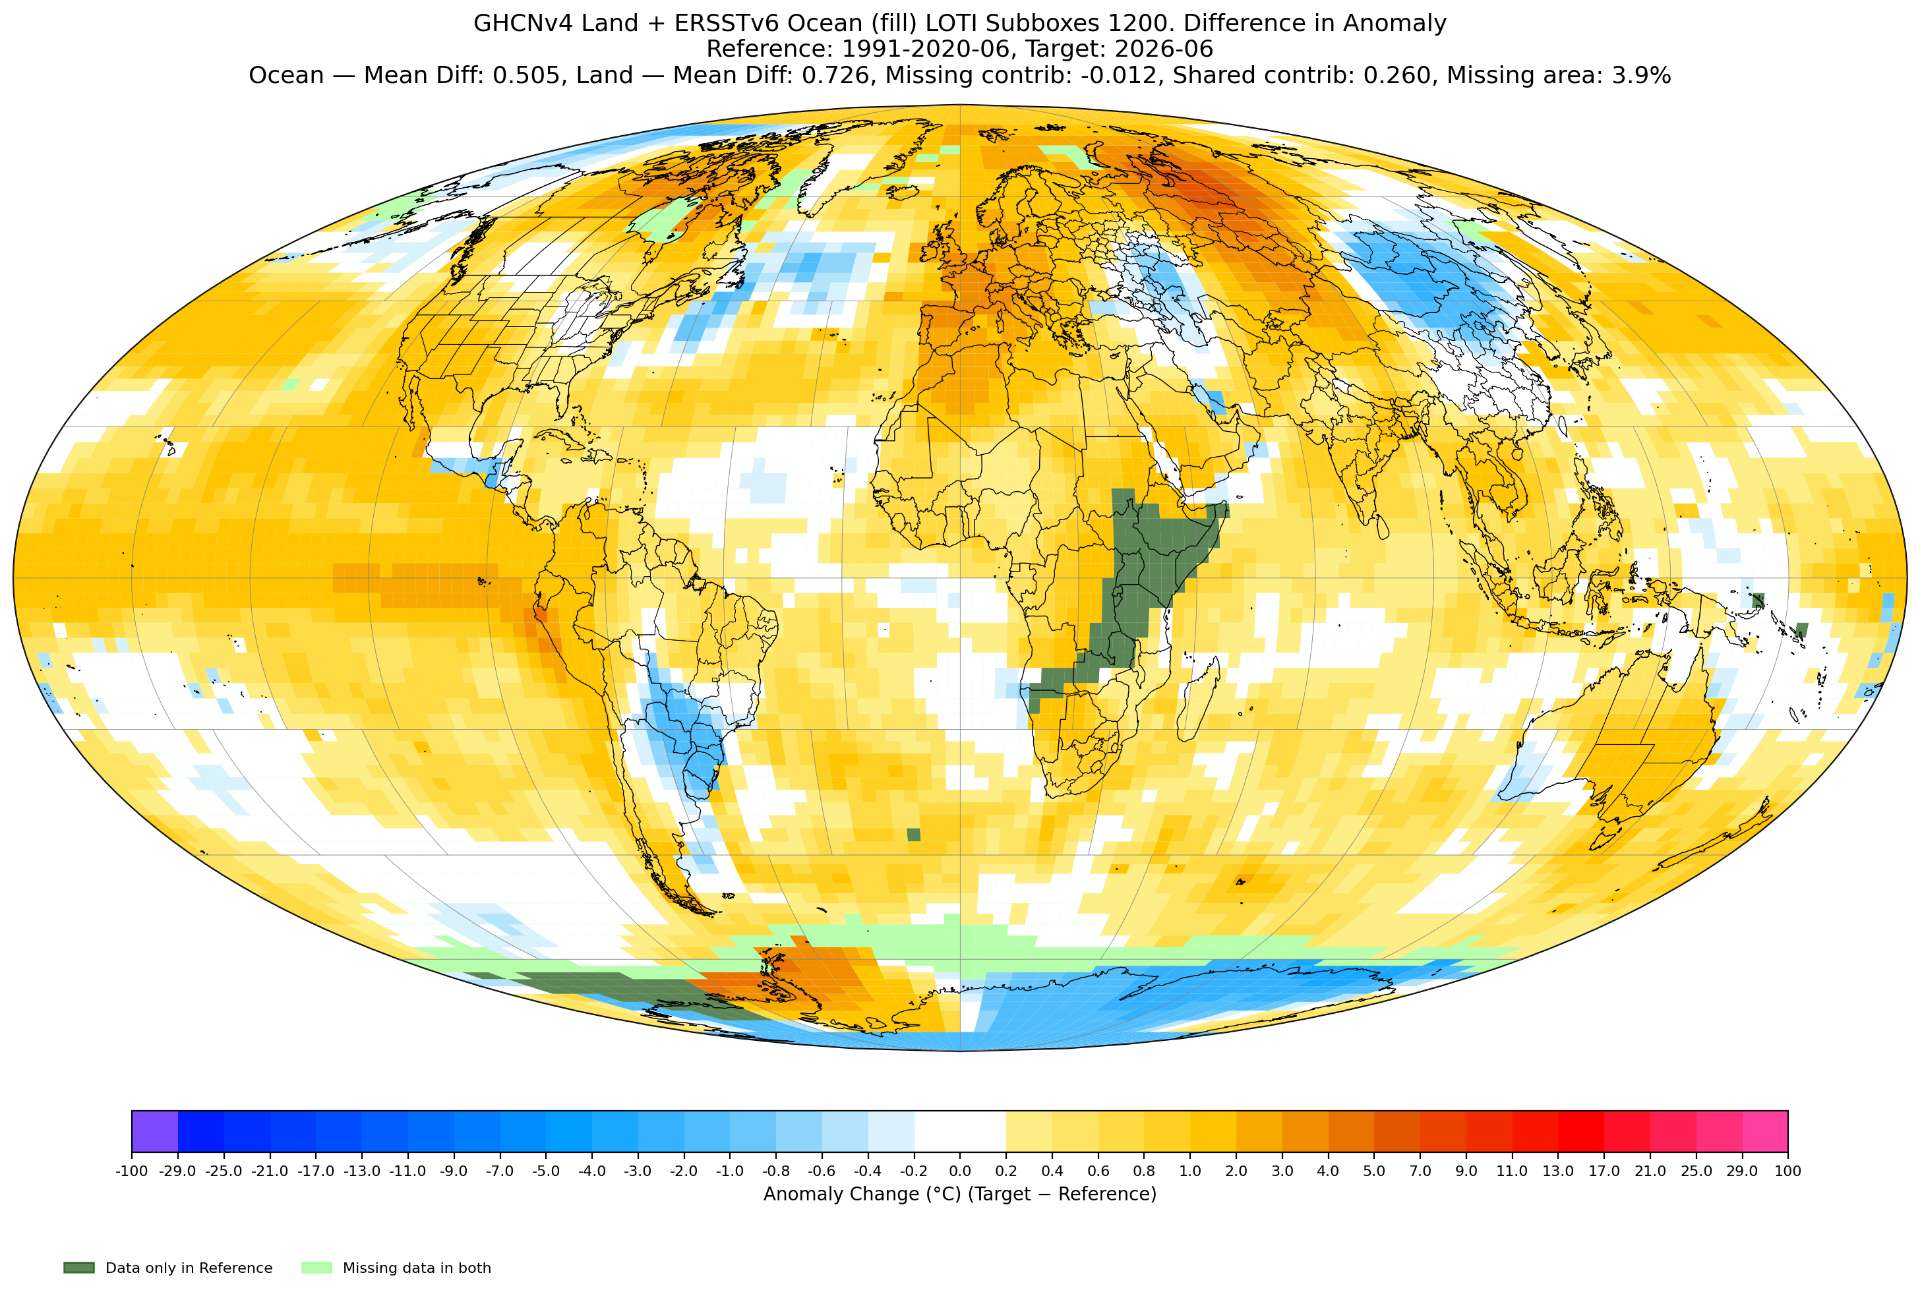
I still haven't finished reading the ERSSTv6 paper (only skimmed it) but my impression from previous work I have ongoing that I could visually analyze is that this shift is more likely contributions from the GISTEMP clim. period warming up a bit relative to afterwards. There's also some more HF signal now that they've dropped the 3-month persistence.
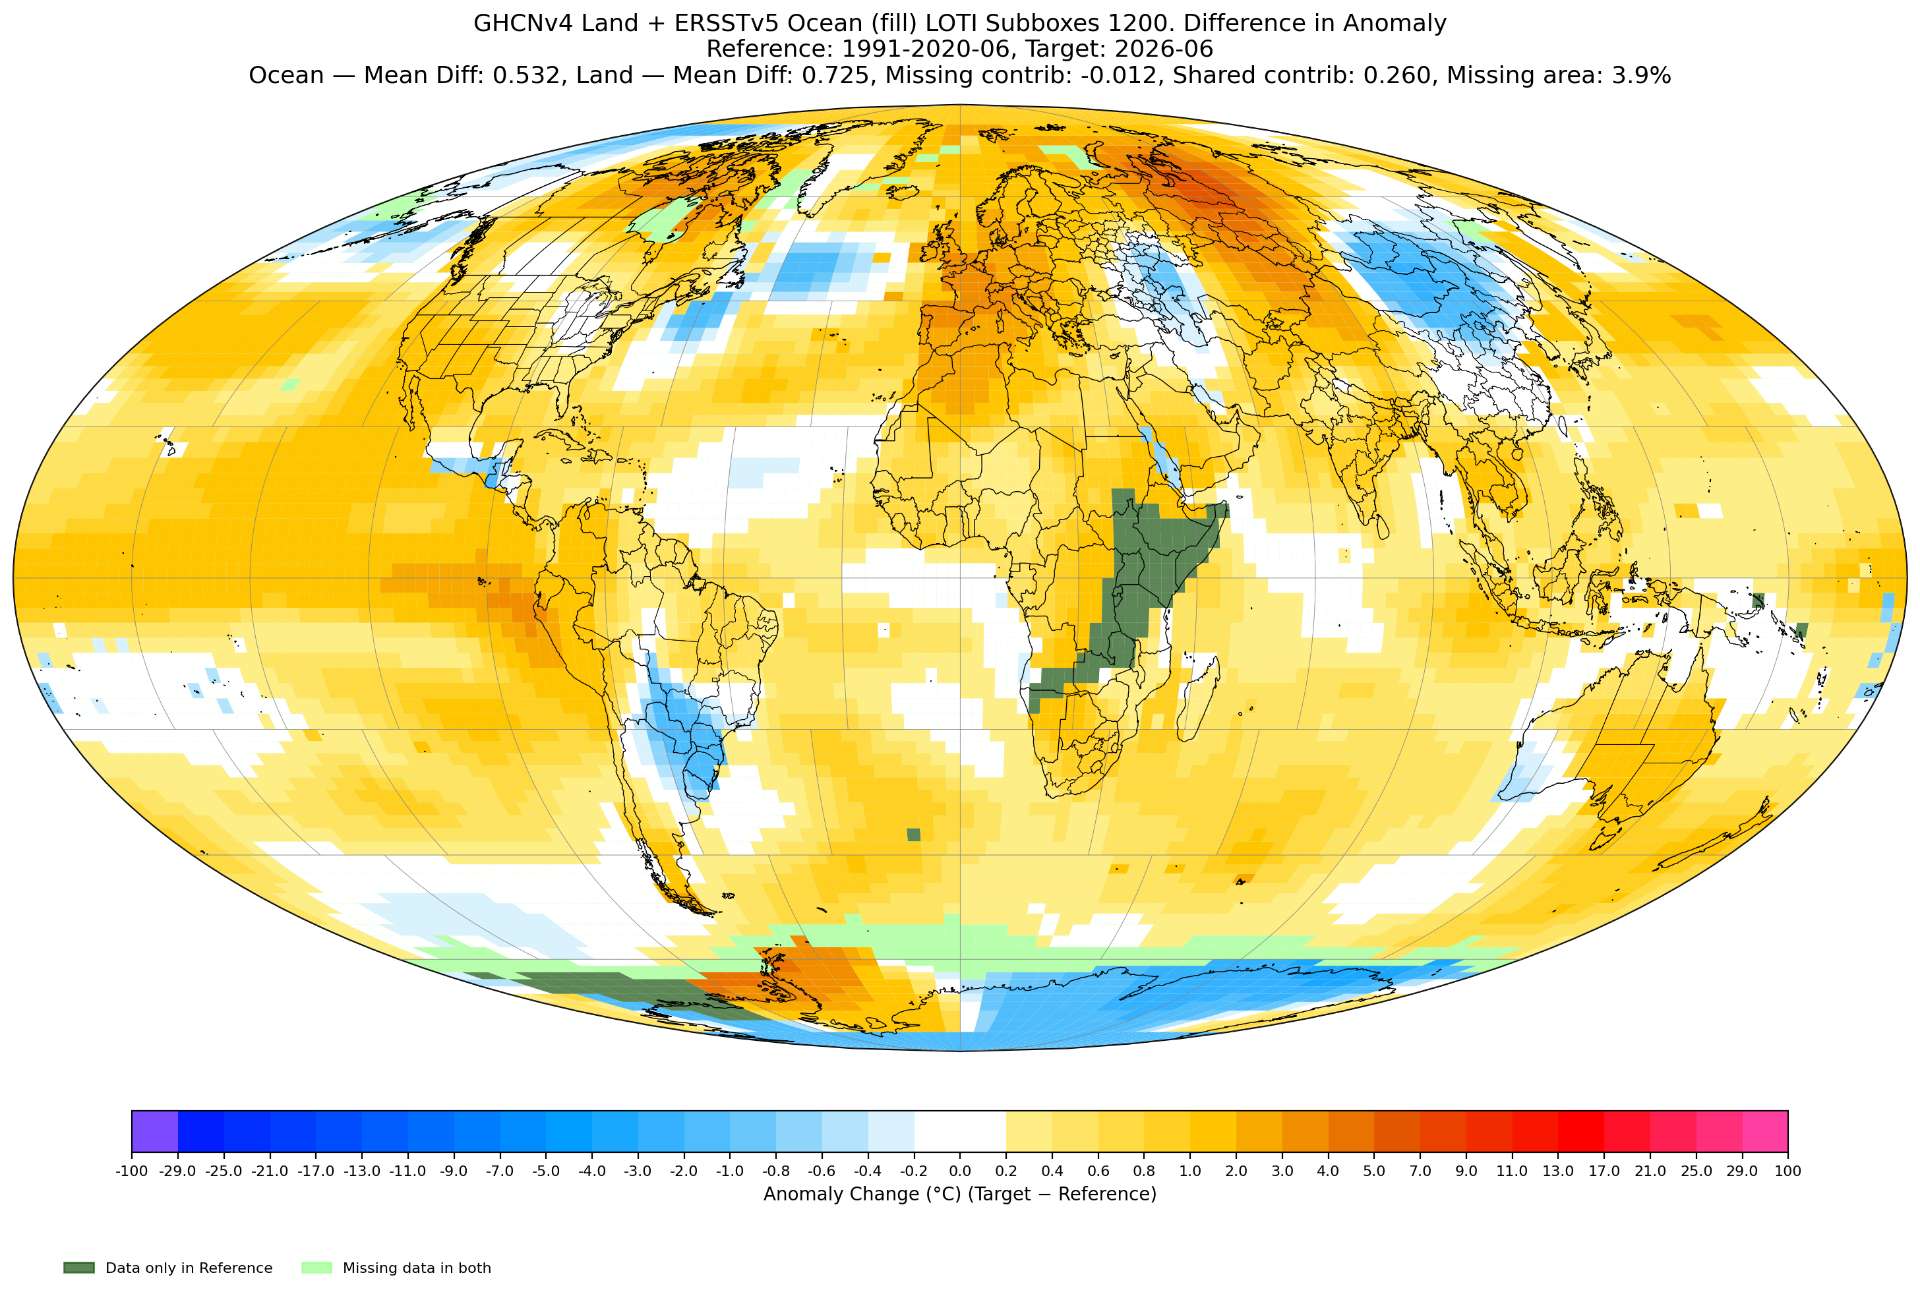
ERSSTv6 for last month you can see there is more detail, especially in the southern ocean (although you could interpret some of this HF as noise):
compared to the same run of ERSSTv5 for last month:
@zenarxy I've been looking at ersst to improve a different improvement to my pipeline (after the t2m superensemble) and I'm working on the ocean part now finally with OISST to improve over a simple climatology model (i.e. the sst portion's variables of the model would like: ERSST climatology + (mixed preliminary->final) OISST + super ensemble t2m.
The land analysis (a tiny portion of it below) on a separate factorial decomposition analysis I've been doing recently (only half finished since I haven't modeled forecasting the weights for the leading ghcnm month) using rolling corrections shows the land data variance from the specially modified ERA5 t2m is now finally lower than the ocean data (even with ERSSTv5, but along with the ERSSTv6 the variance also been reduced even further relative the t2m data has given me motivation for stopping and improving the ocean data further (it reduced quite a bit!)).
Two questions (if you have the time):
1) Have you done the analysis yet for the revised ERSSTv6 over v5, and if so, have you observed any improvement in reducing the hindcast variance (or MSE) for your SST forecast models? (I'd have guessed it improved with more HF signal in ERSSTv6).
2) Thanks to some sleuthing on the open directories for SST data, I did find the preliminary OISST data for it going back to Jan 1 2026 (the NCEI cmb folder has it) so I have enough statistical data to come up with a preliminary->final revision model as well.
I wonder if you've been doing so for a longer preliminary OISST dataset you've been accumulating?
I've come across some information relevant for you for that in such a case (i.e. STAR/NESDIS SST quality monitor):
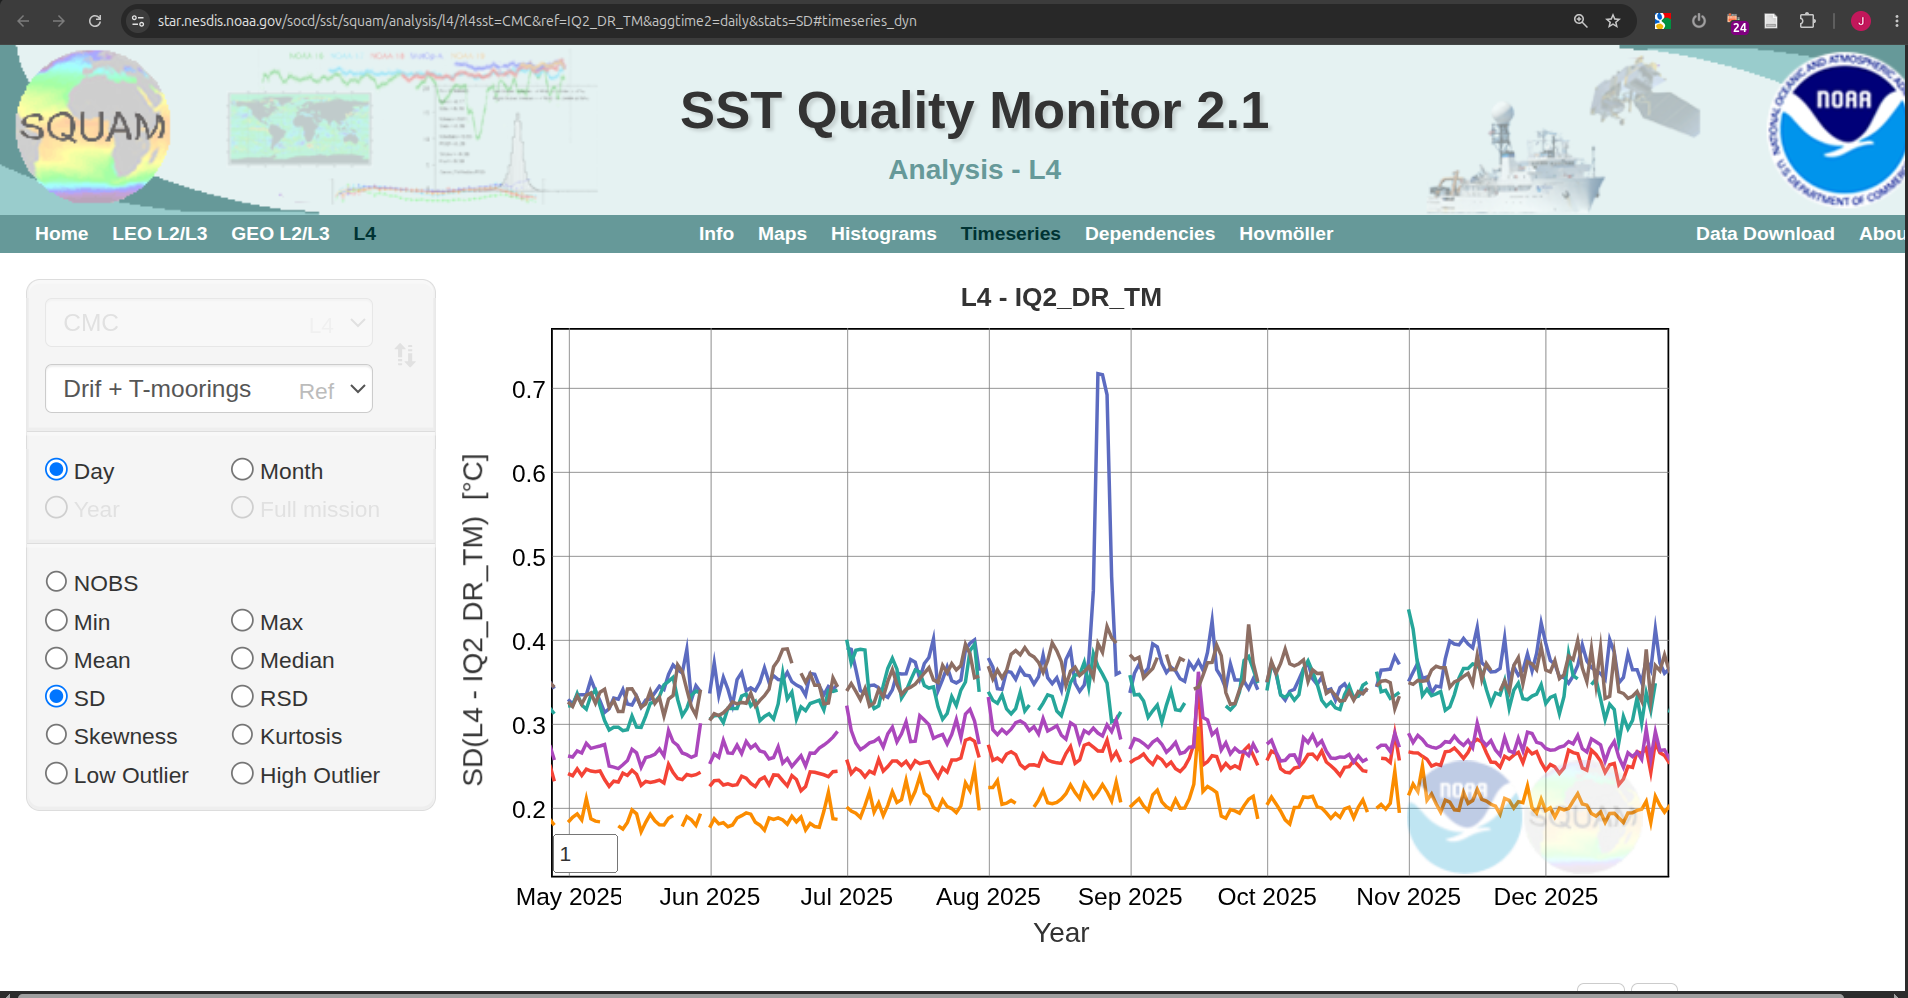
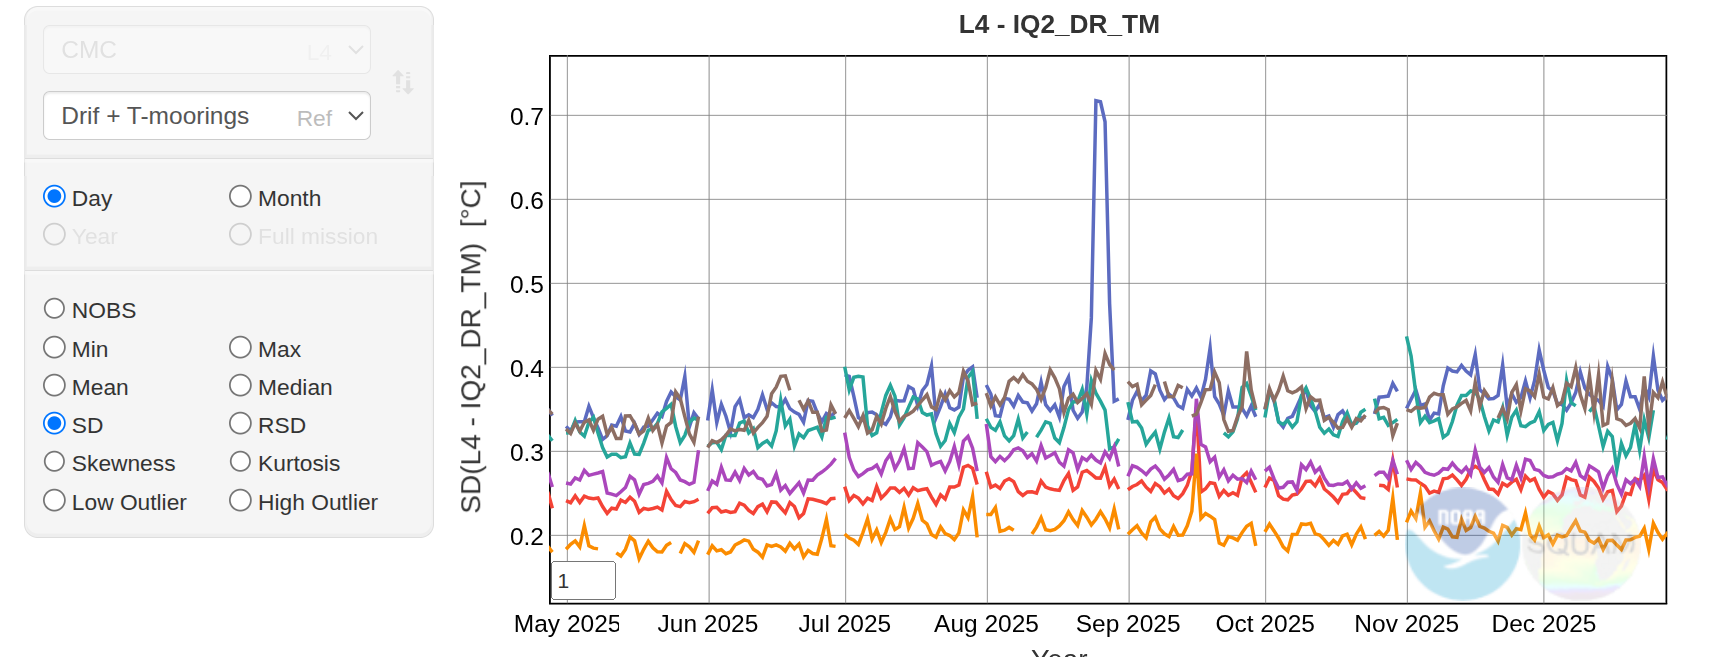
(See NASA JPL SST L4 MUR Data Degradation - Earthdata Forum for the information on the event)
I'd imagine it would be good to mask/weight such events for the daily preliminary->final revision model's statistics.
~
Some plots I think you might find interesting from the analysis I've done so far:
For the specially weighted ERA5 land model (using ERSSTv6):
(compare these two below and to the GISTEMP one from ERSSTv6 in the above post) -- the weighting successfully works (at least in hindcast) much better at reproducing the GISTEMP methodology's spatial structure).
weighted (and masked) ERA5 land + ERSSTv6 for June 2026:
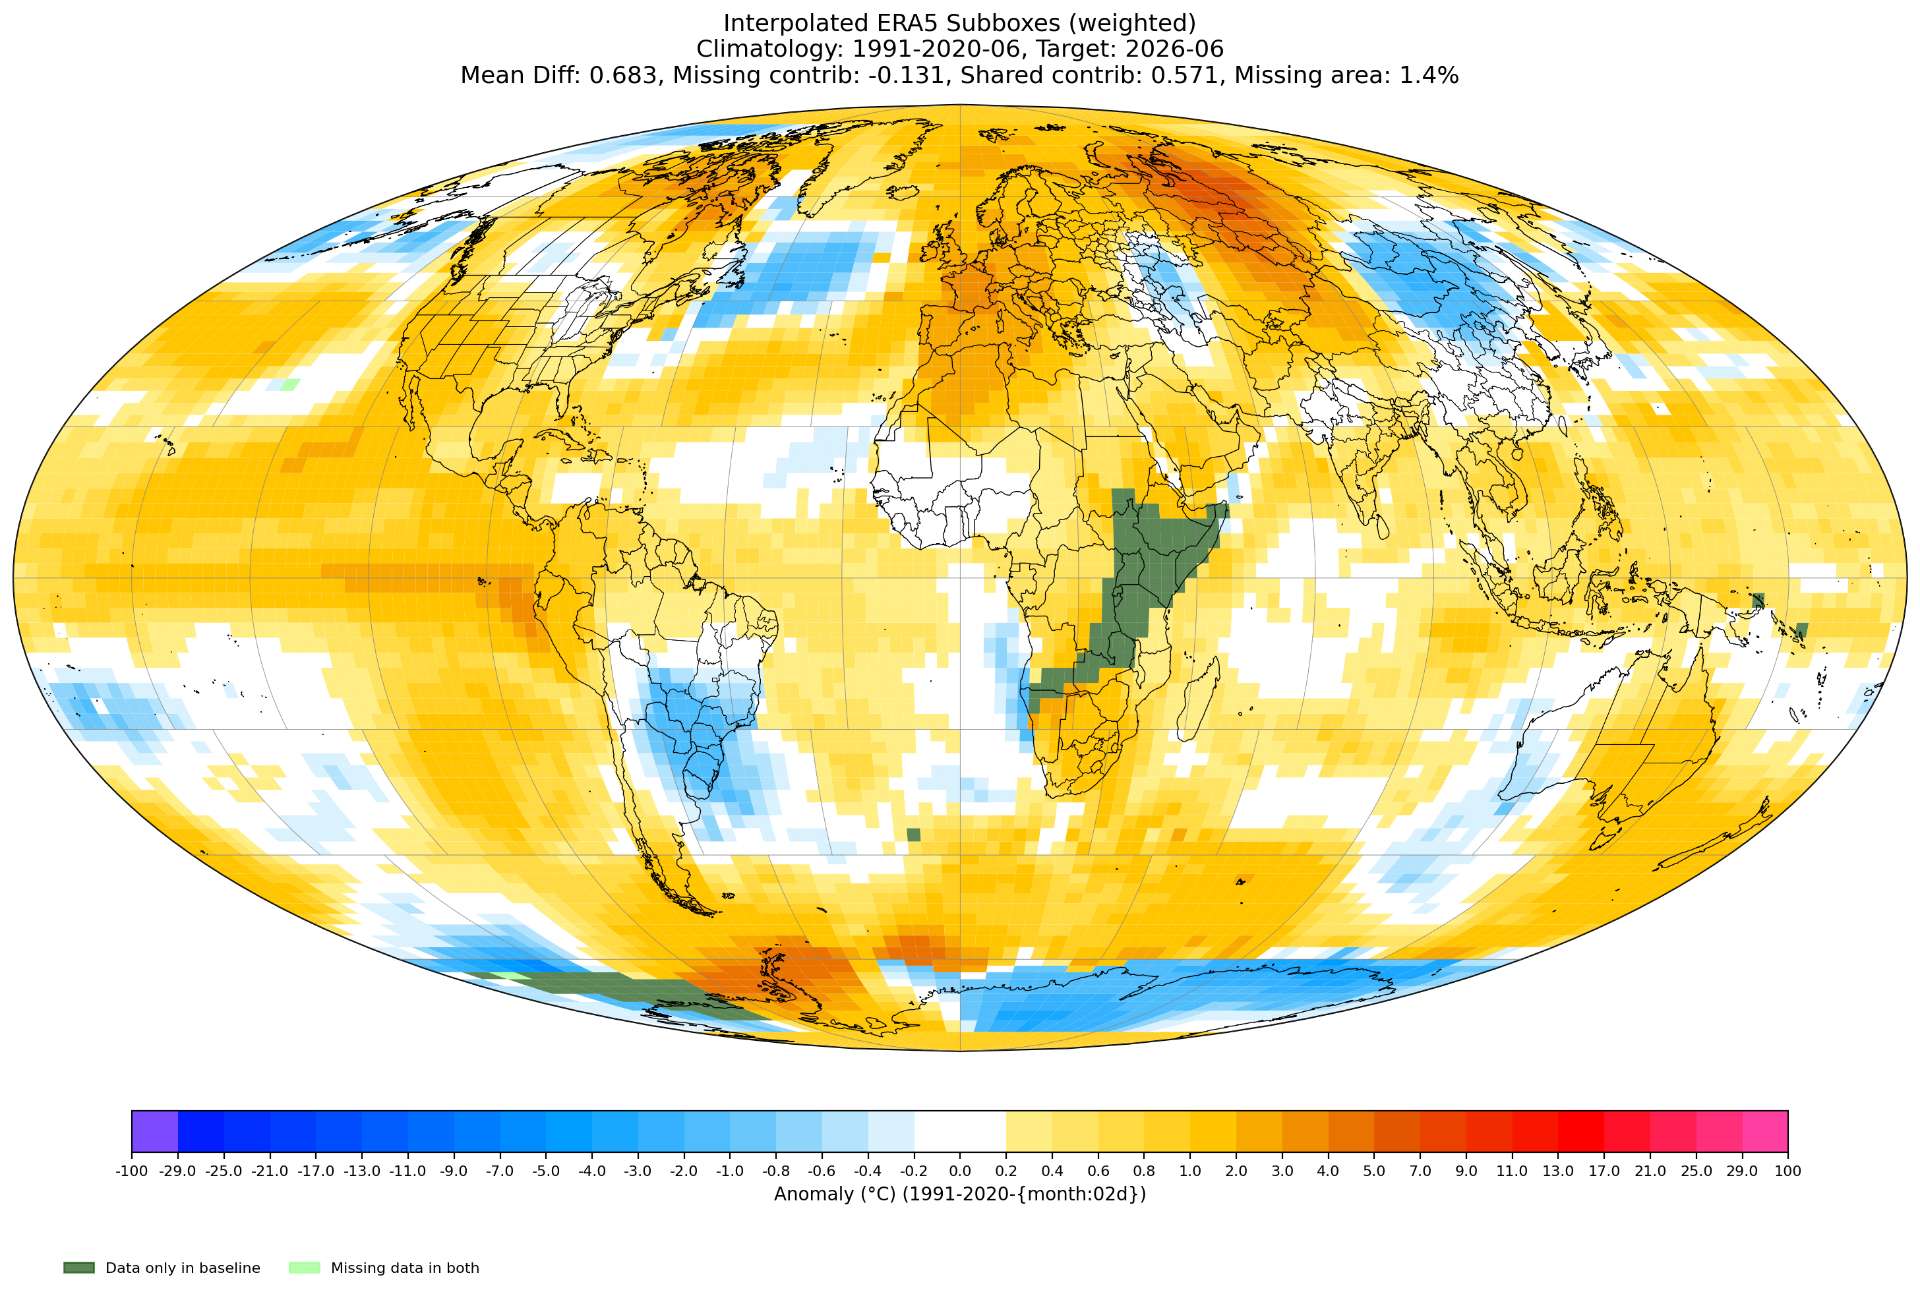
regular (interpolated) land ERA5 + ERSSTv6 for June 2026:
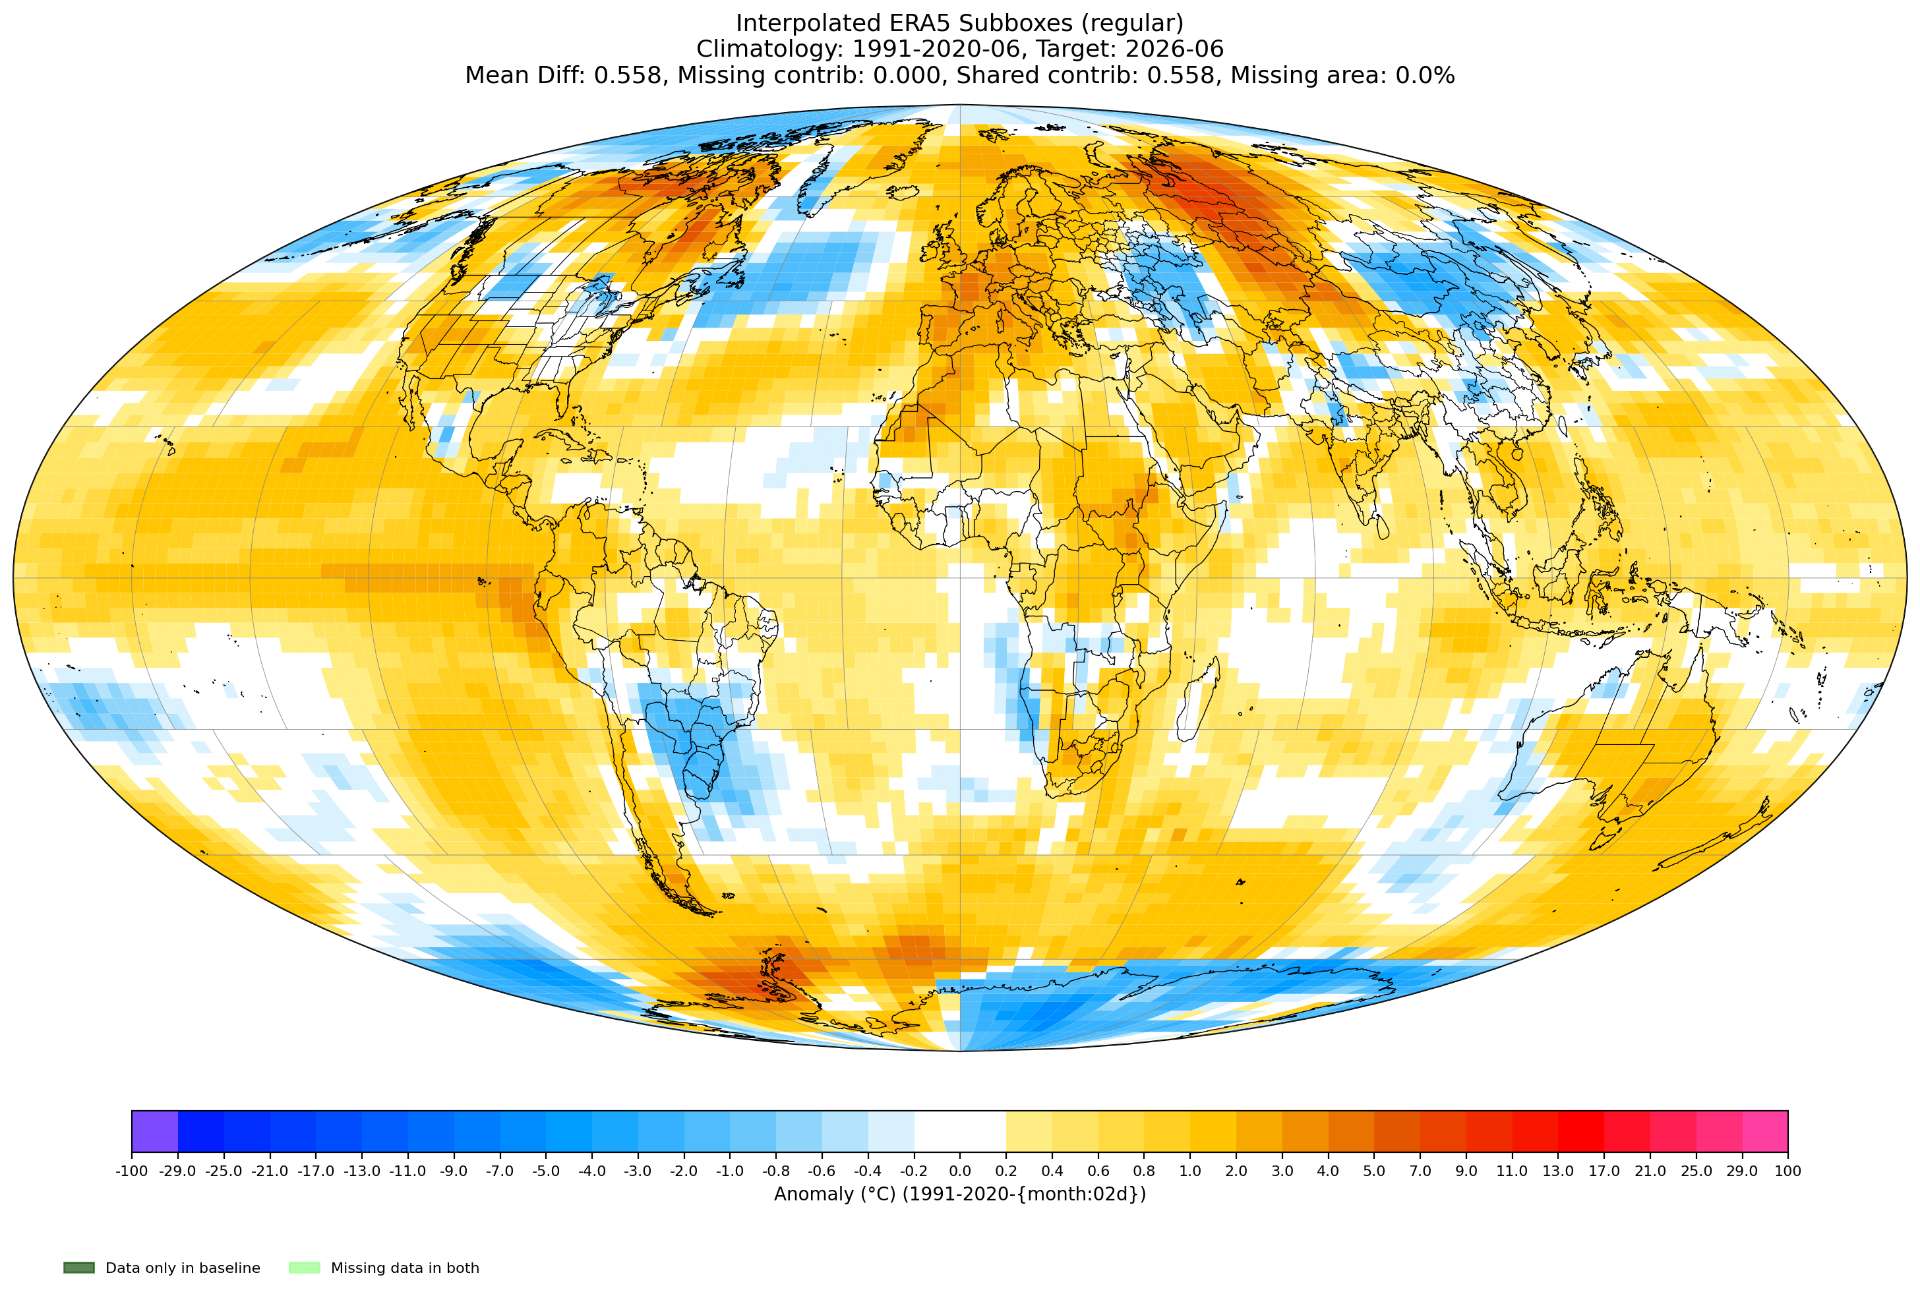
The warm and cold anomalies end up much better approximated to GISTEMP's land anomalies (with only purely weighting the ERA5 data). (lowering the stddev by something like half in earlymodern /modern epochs)
For the factorial decomposition I rerun my own reproduced version of step5 (completely accurate) that allows me to do the substitutions and various other data gathering.
For ERSSTv6 and the weighted ERA5 t2m land version (decomposition analysis over 1940-) with deltas of the global (zone 16, annzon substituion means you find in LOTI)
Delta total (all ERA5 t2m subboxes replacing GISTEMP (1940-), put through an equivalent GISTEMP step5);
Delta land (ERA5 t2m land subboxes replace GISTEMP land subboxes);
Delta ocean (ERA5 t2m ocean subboxes replacing the ERSSTv5 subboxes).
Rolling 10 yr analysis of the residuals for the substitions (epochs based on satellite coverage to relate subjectively what I think the ERA5 roughly, structurally changed):
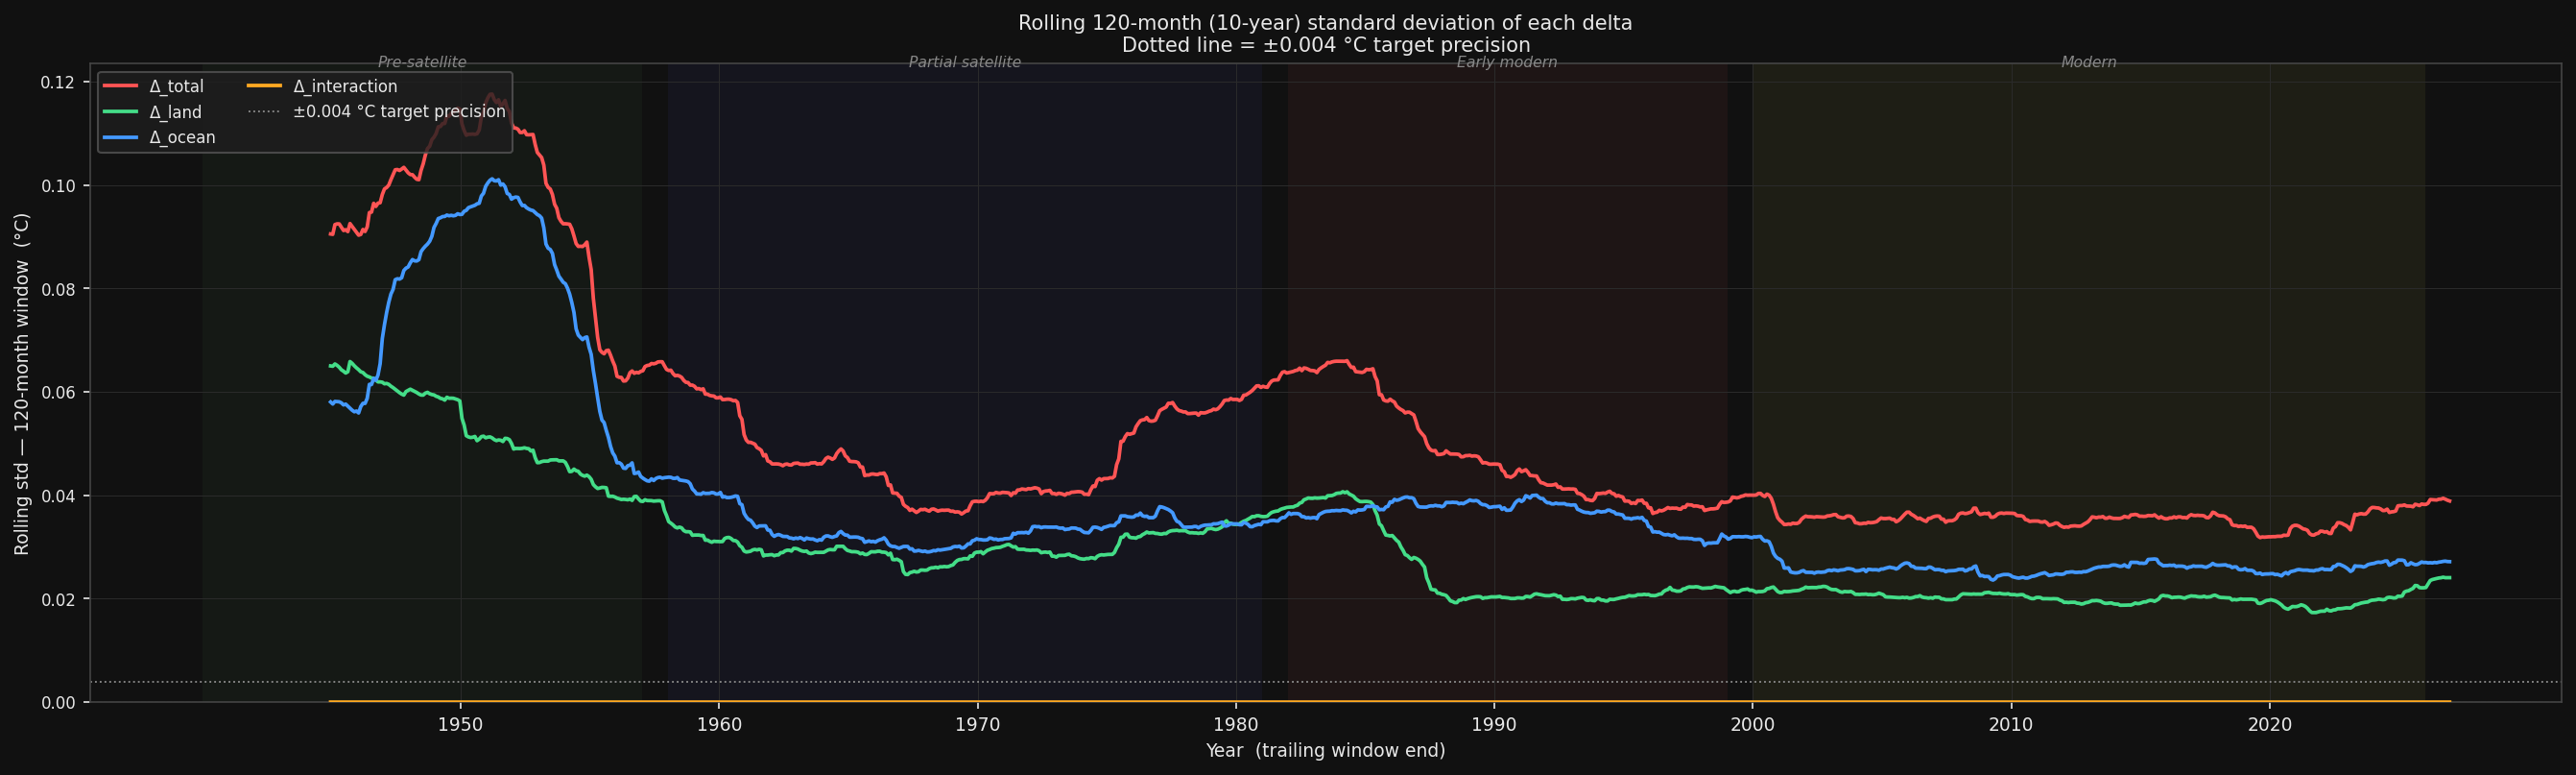
(prior to 1957 is especially poor for disagreement between the datasets)
After putting them through a simple (monthly) model with a rolling correction for the residuals, a (rolling 5 year mean of the) variance is decent (with the train MSE for delta land comparable to my best t2m delta analog model's train MSE; probably can be improved better with a ridge regression instead, etc). the delta total is still signicantly worse though than the analog models I use. (Hindcast residual analysis below based on the decomposition)
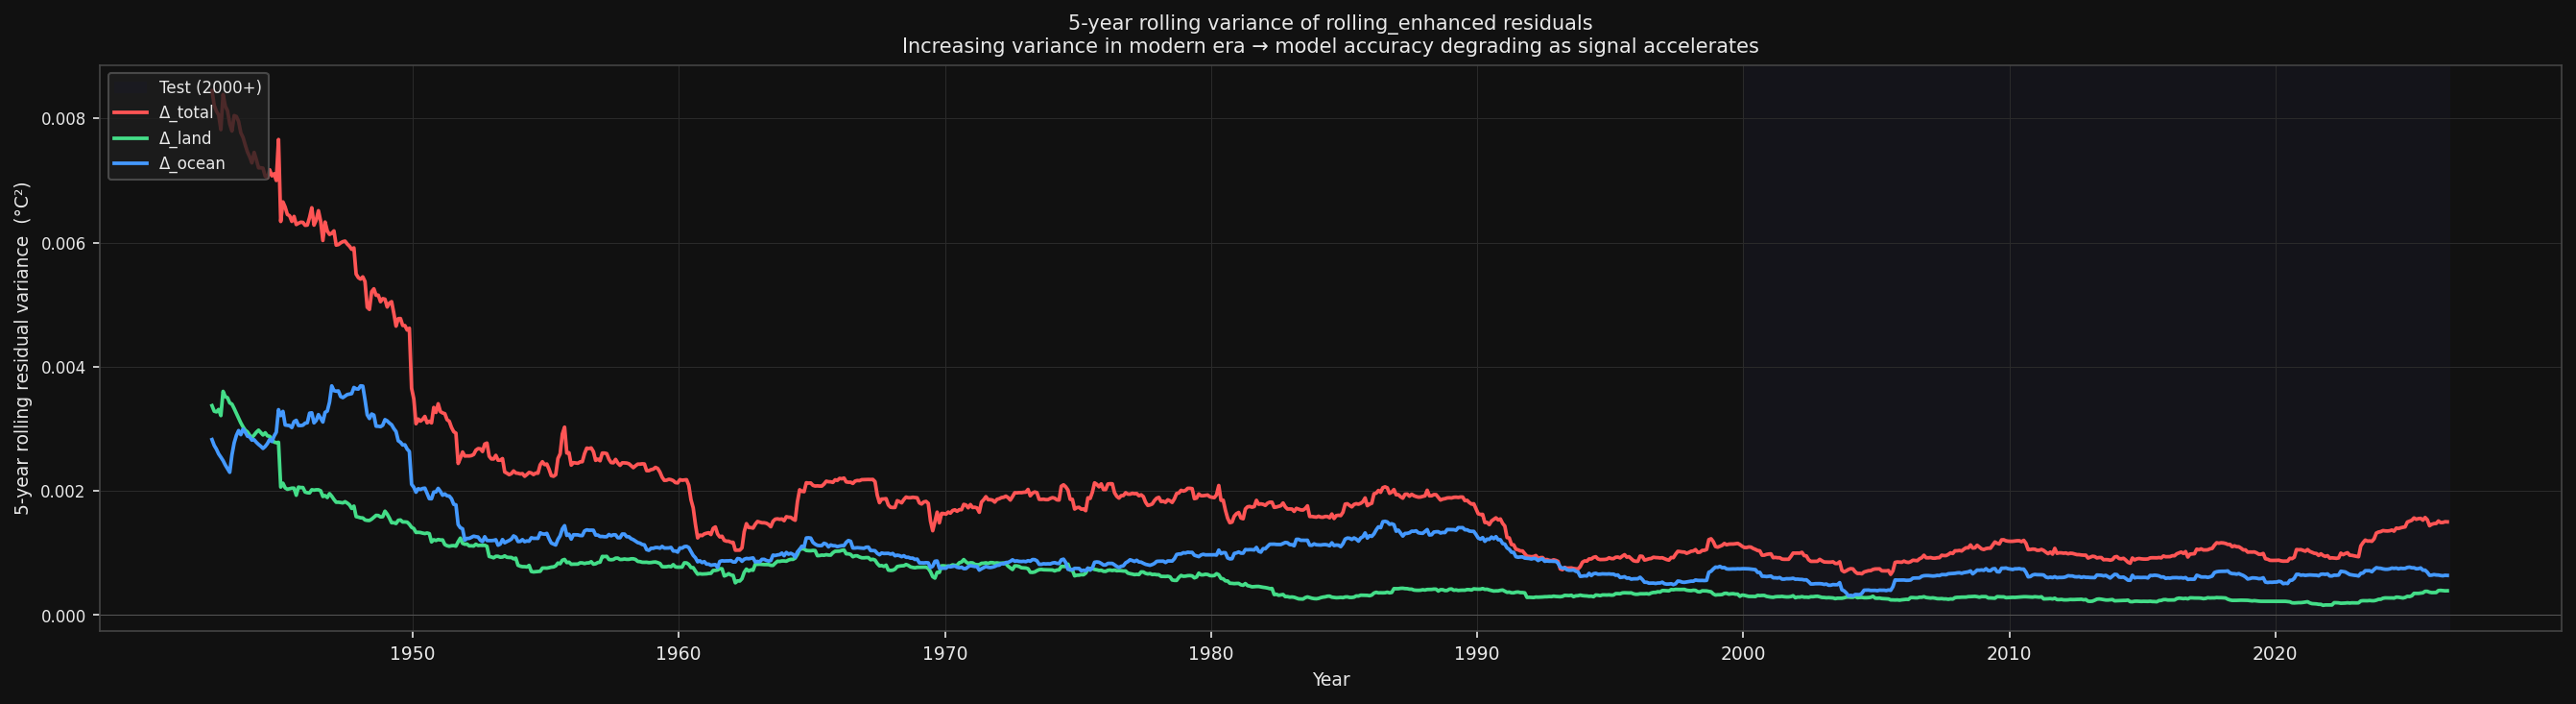
(the total variance is decent in the modern epoch and the latter half of the early modern epoch). For instance, delta land shows how much the variance would improve if the ocean was perfect (it would be comparable to the delta analog model I use), but in reality it would be somewhere in between).
~
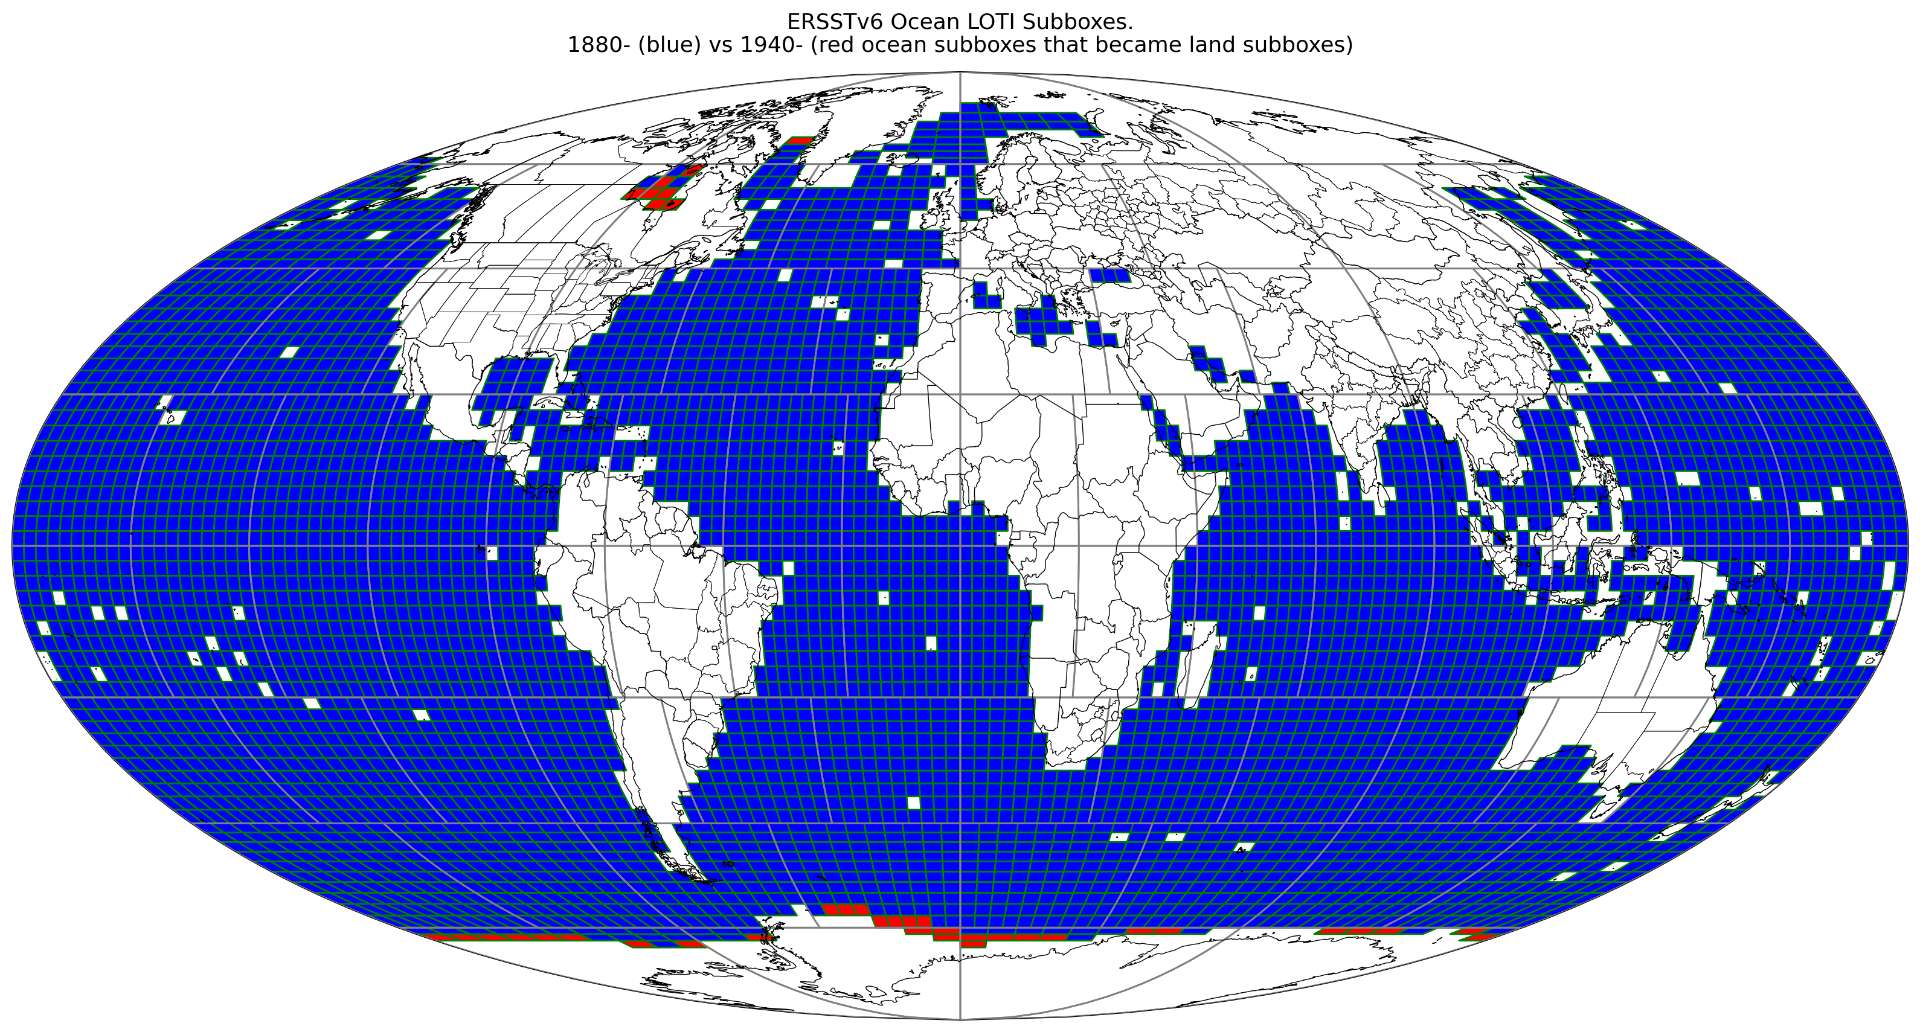
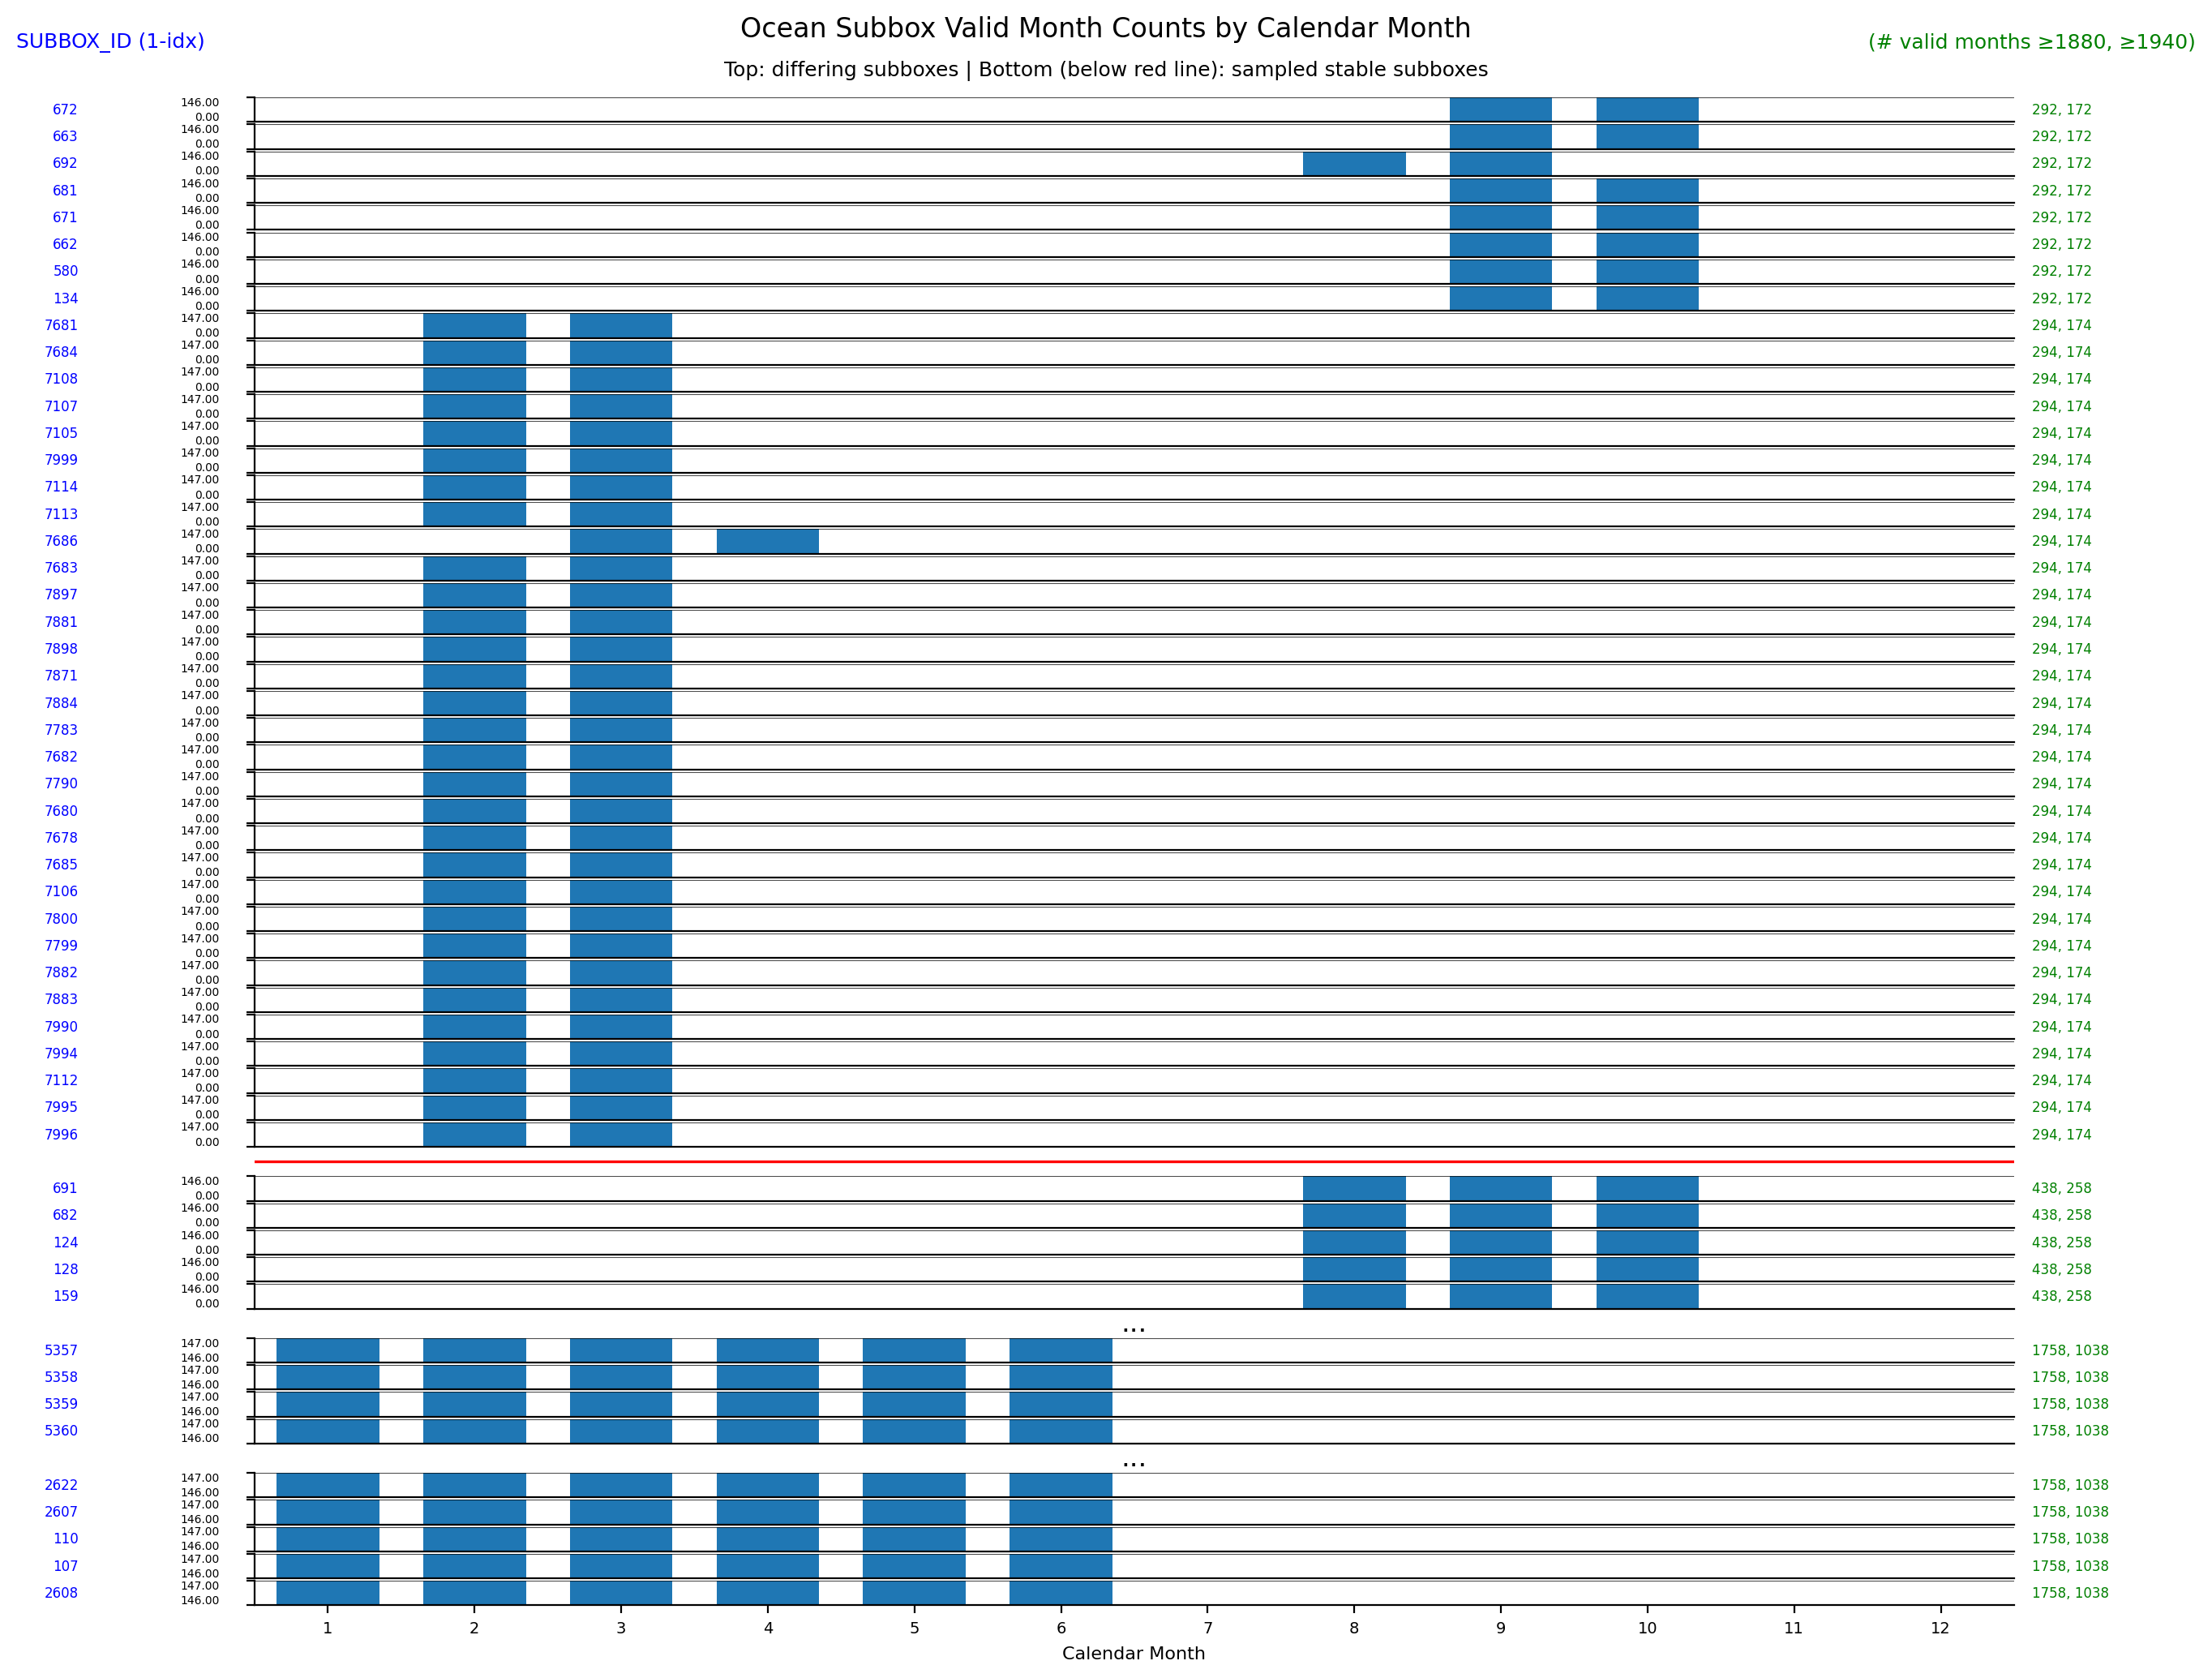
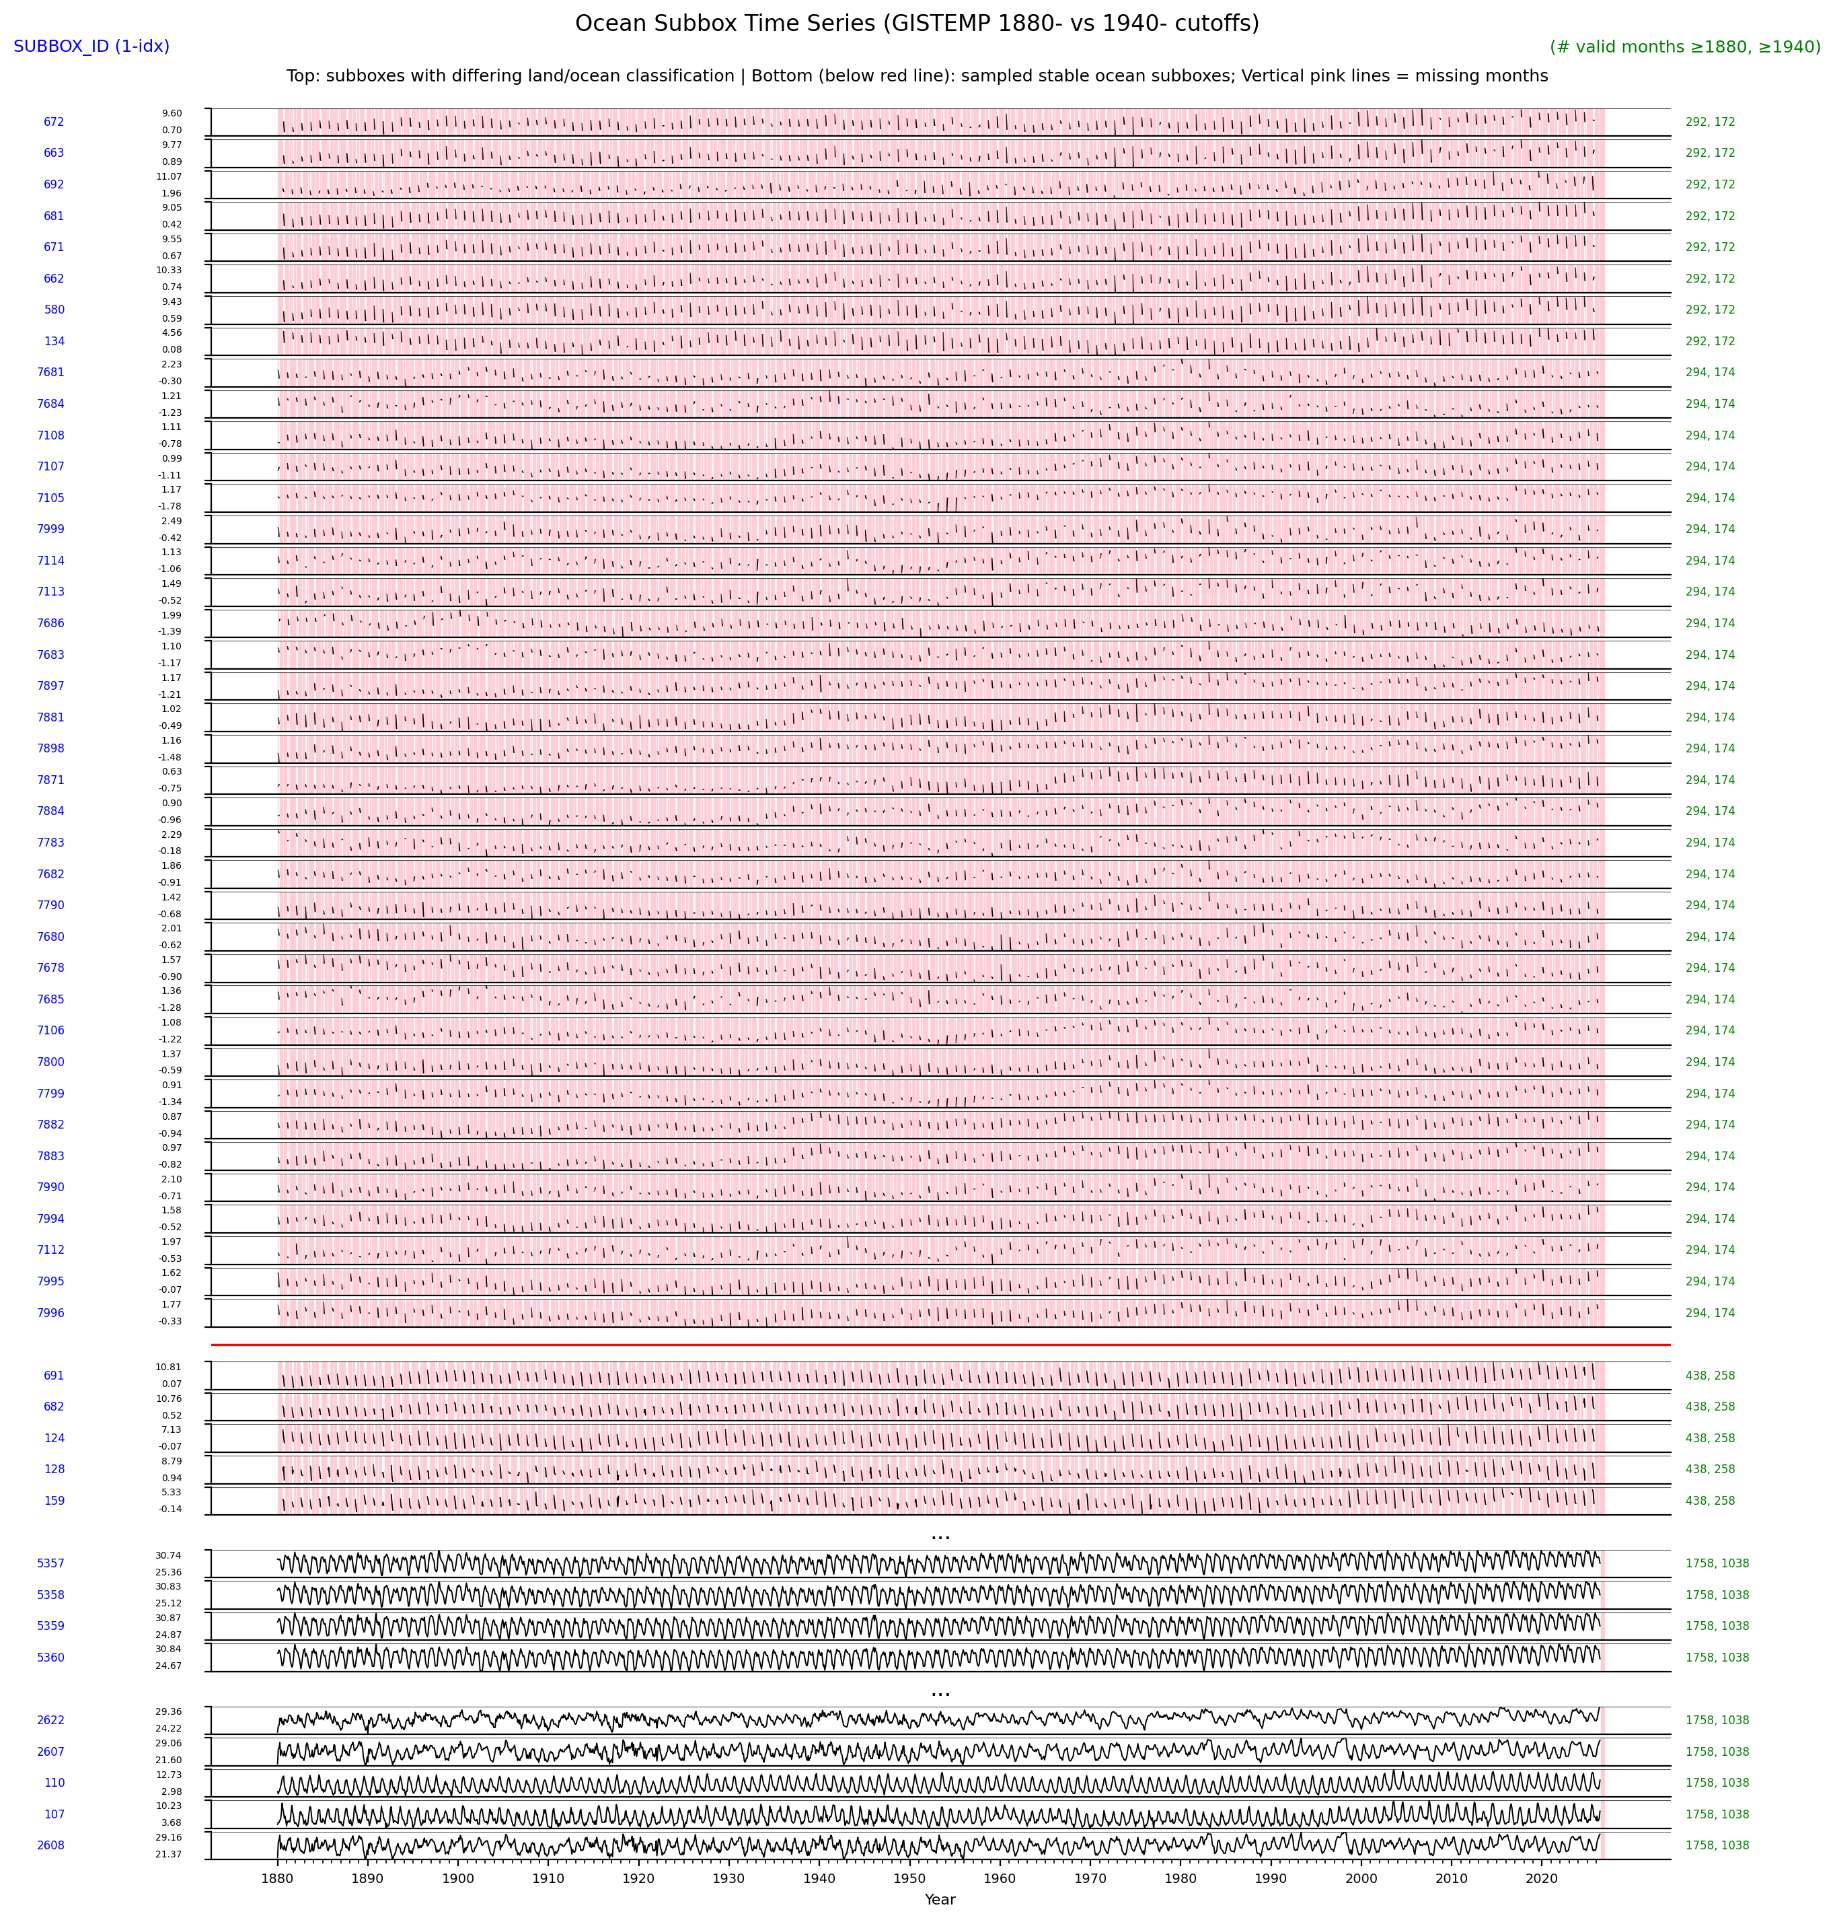
For reference Gistemp 1880<-> GIstemp with a 1940- cutoff also has marginal disagreement that needs to be modeled but can be improved if you take care to fix the subbox types (there are 39 total subboxes, of which up to ~30 can change in a single month from ocean to land if you don't fix the subbox type (i.e. fix it as ocean) -- this has the effect of effectively masking those subboxes for those sea ice minimum months (where they get masked due not having 20 total years (240 months) of data) but it is absolutely worth it since the land-ocean variance introduces greater disagreement of course i..e fixing it takes the disagreement stddev from ~ 0.007 C to 0.003 C which is worth it even correcting for later on since it should be reducable even further with statistical methods).
(this was the same for ESSTv5 as well for below; but below is ERSSTv6)
subbox histograms (sorted by increasing total valid months), showing the sea ice months and the # total valid subboxes in the right annotated column for the different cutoffs; Bottom samples are beginning, middle, end of the rest of the sort. This is a tiny bit hard to interpret since you have to pay attention to the vertical scale of the histogram
Time series of the above (pink == invalid / masked periods):
(Edit fixed title)
@parhizj I haven't done a full controlled ERSSTv6/v5 analysis specifically for the SST forecast component. Most of what I changed was the input handling, post-processing, and some small adjustments to the OISST->ERSST bias correction. These produced a slight improvement, but nothing especially noticeable, which is probably unsurprising given how little global SST changes on a day to day
However... I have noticed that the daily LOTI output has been slightly more stable since the changes, although it has only been four days, so it is likel ytoo early to draw any conclusions
Pre-changes:
13/07 – 1.213
14/07 – 1.230
15/07 – 1.235
16/07 – 1.218
Post-changes:
17/07 – 1.223
18/07 – 1.221
19/07 – 1.220
20/07 – 1.216
For the preliminary OISST data, I haven't been accumulating a separate archive. My script replaces the preliminary files as soon as the final versions become available. I didn't previously see much benefit in retaining both, given the low daily global SST variance and the amount of post-processing and bias correction already applied
Your point about known degradation events is a good one, I just don't know if it's worth the time and effort put into building a model that takes that data into consideration given how little of a change it would contribute to the LOTI after all the post-processing
Bettors may be interested in this AUGUST vs JULY market for ERA5 below (default probability set to the prior):
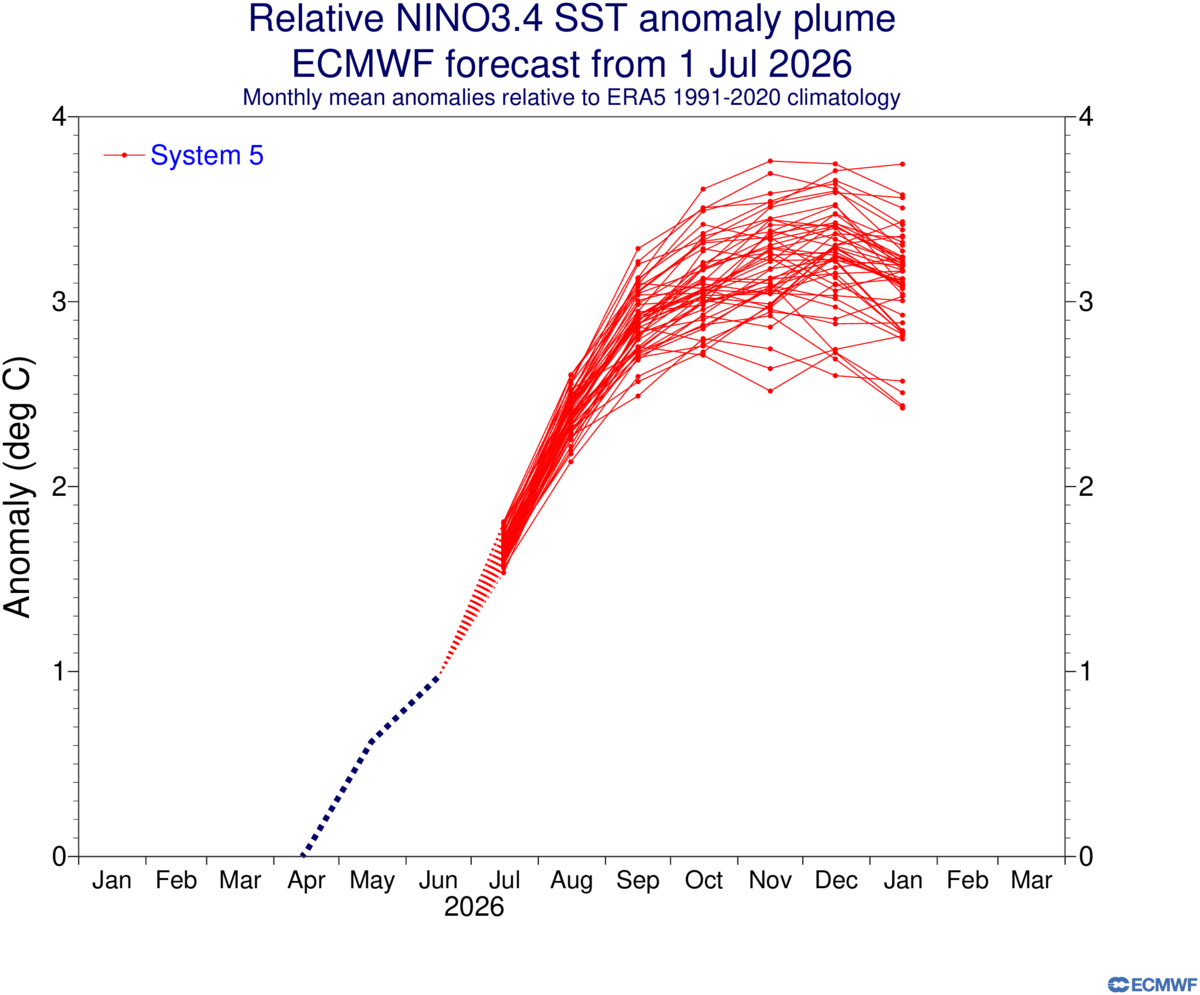
Some of the EC46 runs have been shooting up significant beyond climo, but today's was extreme. Normally climo is superior except we are also well on our way to a very strong / potentially historical El Nino....