Details of data is currently at https://data.giss.nasa.gov/gistemp/
with a txt file with the data at data.giss.nasa.gov/gistemp/tabledata_v4/GLB.Ts+dSST.txt
(or such updated location or updated version for this Gistemp v4 LOTI data)
For this annual market, it is the J-D column for 2026 when that is shown after Dec 2026 data has been published.
More options can be added but please keep these sensible.
January 2024 might show as 124 in hundredths of a degree C, this is +1.24C above the 1951-1980 base period. If it shows as 1.22 then it is in degrees i.e. 1.22C. Same logic/interpretation as this will be applied.
If the version or base period changes then I will consult with traders over what is best way for any such change to have least effect on betting positions or consider N/A if it is unclear what the sensible least effect resolution should be.
Numbers expected to be displayed to hundredth of a degree. The extra digit used here is to ensure understanding that a display of +1.35C causes the 1.345C or more option to resolve yes.
Resolves per first update seen by me or posted as long, as there is no reason to think data shown is significantly in error. If there is reason to think there may be an error then resolution will be delayed at least 24 hours. Minor later update should not cause a need to re-resolve.
I also do monthly markets like
August 2026 Global Average Temperature August 2026 per LOTI v4 vs 1951-1980 base period (NASA Gistemp)
September 2026 Global Average Temperature Sept 2026 per LOTI v4 vs 1951-1980 base period (NASA Gistemp)
 1,000
1,000(Dating this forecast for 2026-10-10 since its based off old 2t run data through 06Z on Oct. 10)
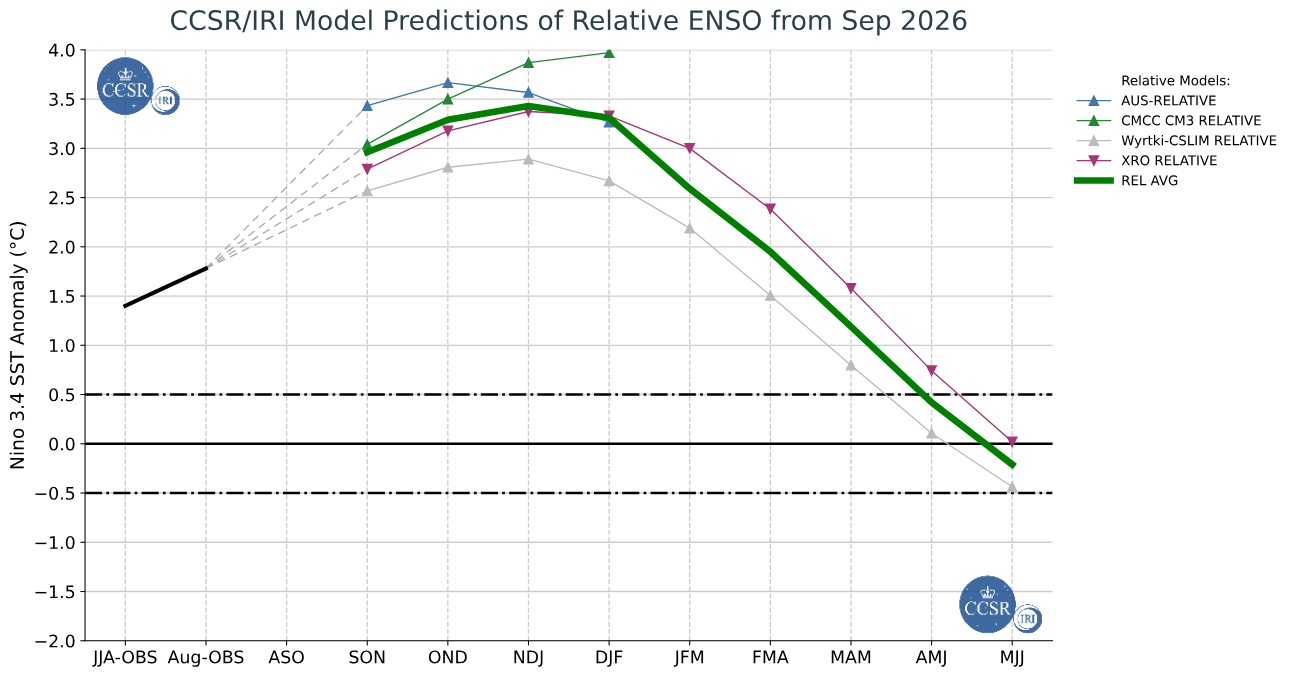
Based on some vibe coding and my usual 2t notebook forecasts data for the lead month along with using daily sst climo+forecasts (roni) for analogues+persistence, assuming ERSSTv5 for GISTEMP) I get for center point predictions for Oct, Nov. Dec: 1.40, 1.43, 1.41. This seems plausible enough since the 3 month RONI forecasts (IRI) show El Nino peaking in December.
This leaves a center point prediction of 1.28 C for the LOTI 1951-1980 anomaly annual mean.
This is close to 2024's value, but marginally lower (-0.002). Because its far away from the lowest available bin, I've added a closer bin a bit lower nearrer my current forecast.
Assuming even large 2t climo variances (of ~ 0.02 and 0.03 for Nov, Dec, with the normal calibrated variance for Oct currently at 0.007)), I don't get beyond 23% for the exceedance of bin
"1.295 degrees Celsius or more".
As usual, given that the center point prediction is liable to move, I have hopefully bet conservatively enough this time.