Data is currently at
csv file
or
(or such updated location or updated version for this Gistemp v4 LOTI data see https://data.giss.nasa.gov/gistemp/ )
January 2024 might show as 124 in hundredths of a degree C, this is +1.24C above the 1951-1980 base period. If it shows as 1.22 then it is in degrees i.e. 1.22C. Same logic/interpretation as this will be applied.
If the version or base period changes then I will consult with traders over what is best way for any such change to have least effect on betting positions or consider N/A if it is unclear what the sensible least effect resolution should be.
Numbers expected to be displayed to hundredth of a degree. The extra digit used here is to ensure understanding that +1.20C resolves to an exceed 1.195C option.
Resolves per first update seen by me or posted as long, as there is no reason to think data shown is significantly in error. If there is reason to think there may be an error then resolution will be delayed at least 24 hours. Minor later update should not cause a need to re-resolve.
I do other similar markets
September 2026 https://manifold.markets/ChristopherRandles/global-average-temperature-sept-202
Annual 2026 https://manifold.markets/ChristopherRandles/global-average-temperature-2026-per-28LyRdCc55
 1,000
1,000🏅 Top traders
| # | Trader | Total profit |
|---|---|---|
| 1 | Ṁ396 | |
| 2 | Ṁ337 | |
| 3 | Ṁ242 | |
| 4 | Ṁ232 | |
| 5 | Ṁ108 |
@ChristopherRandles 1.40 official, this can resolve now.
For reference they went with ghcnm 20260907 (doing the run two days ago on Tuesday)
      ghcnm.tavg.v4.0.1.20260907.qcf.dat                    2026-09-08 01:52  165M
ghcnm.tavg.v4.0.1.20260907.qcu.dat 2026-09-08 01:52 165M I like some people's confidence in this market.
ghcnm.v4.0.1.20260902:
132.691
~
TL;DR from below: expecting it to rise and end up roughly around 1.38 - 1.39 C
~
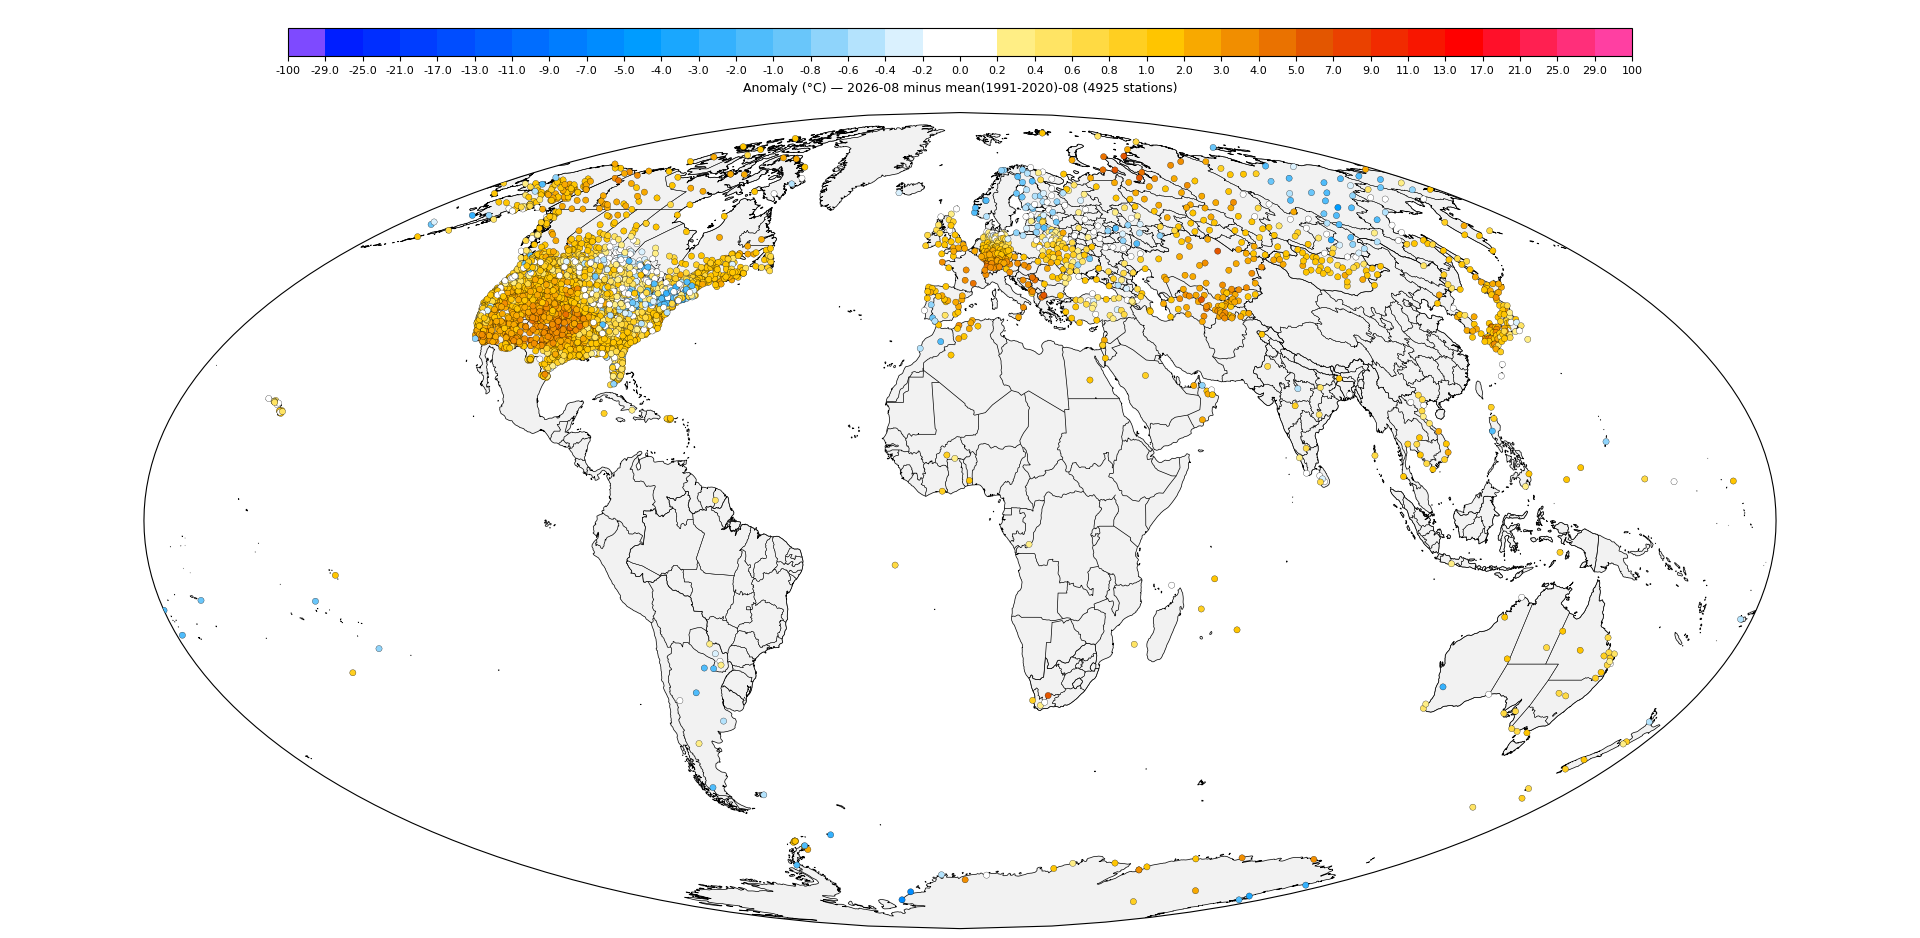
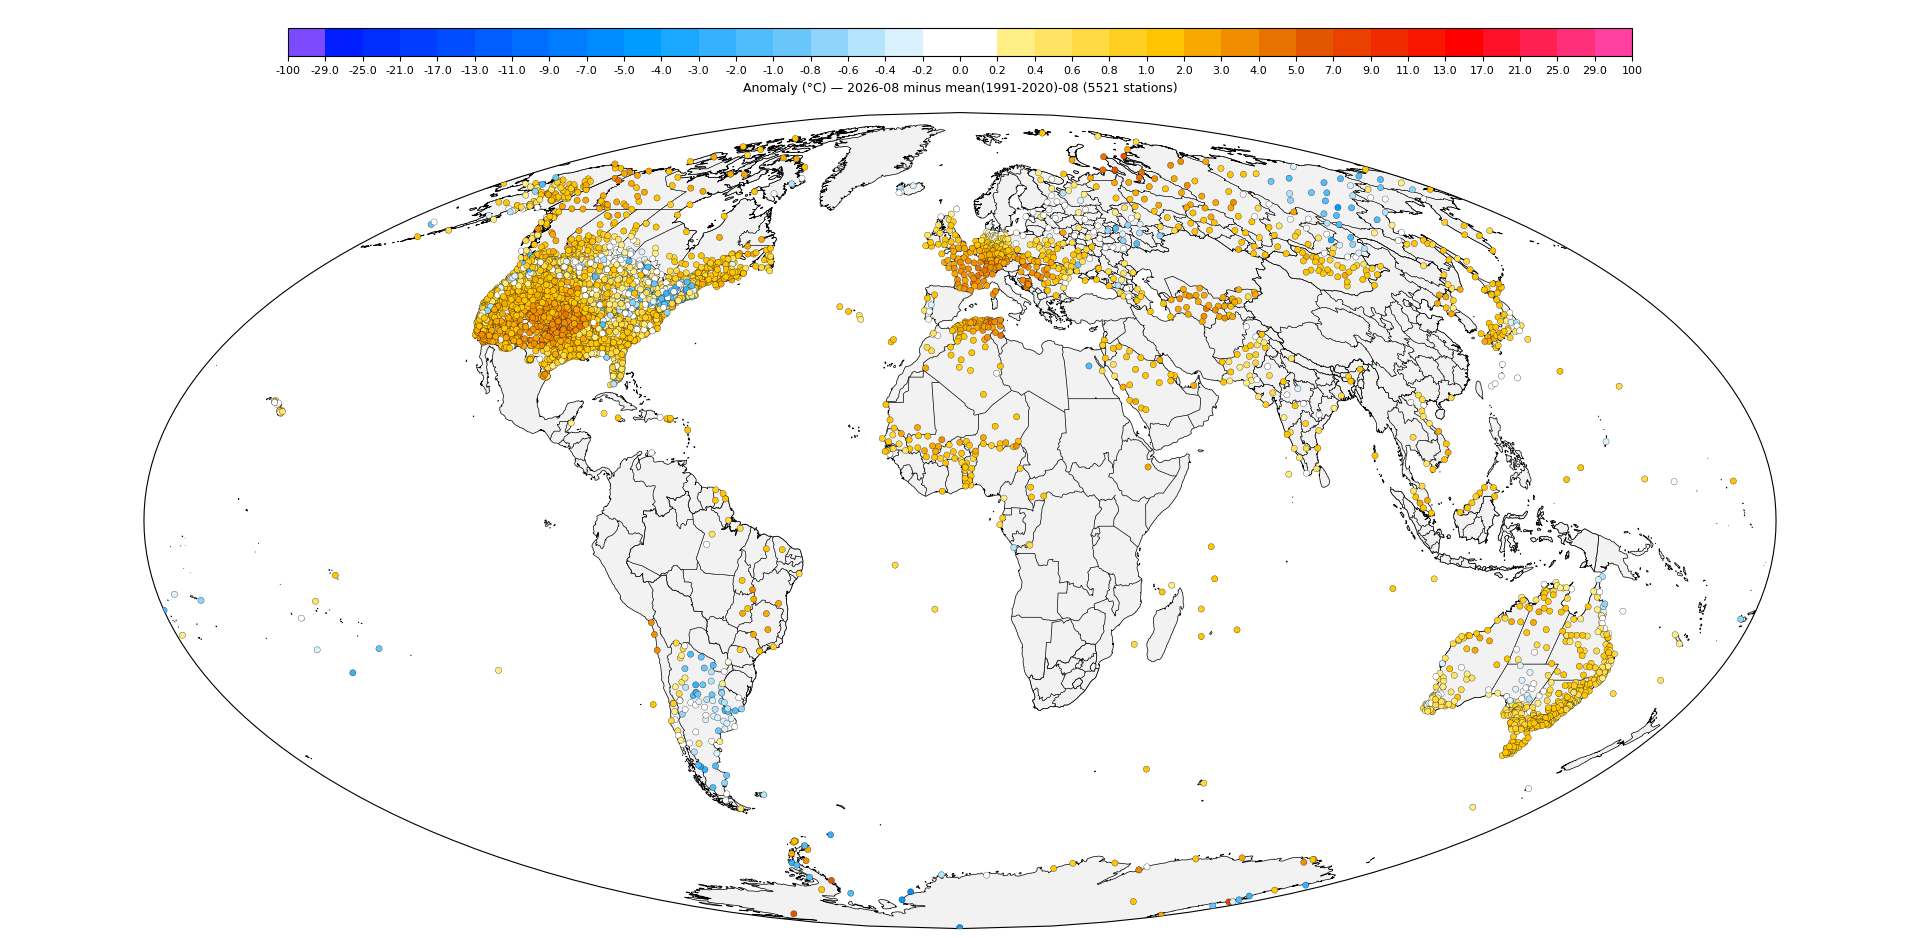
GISTEMP Plots:


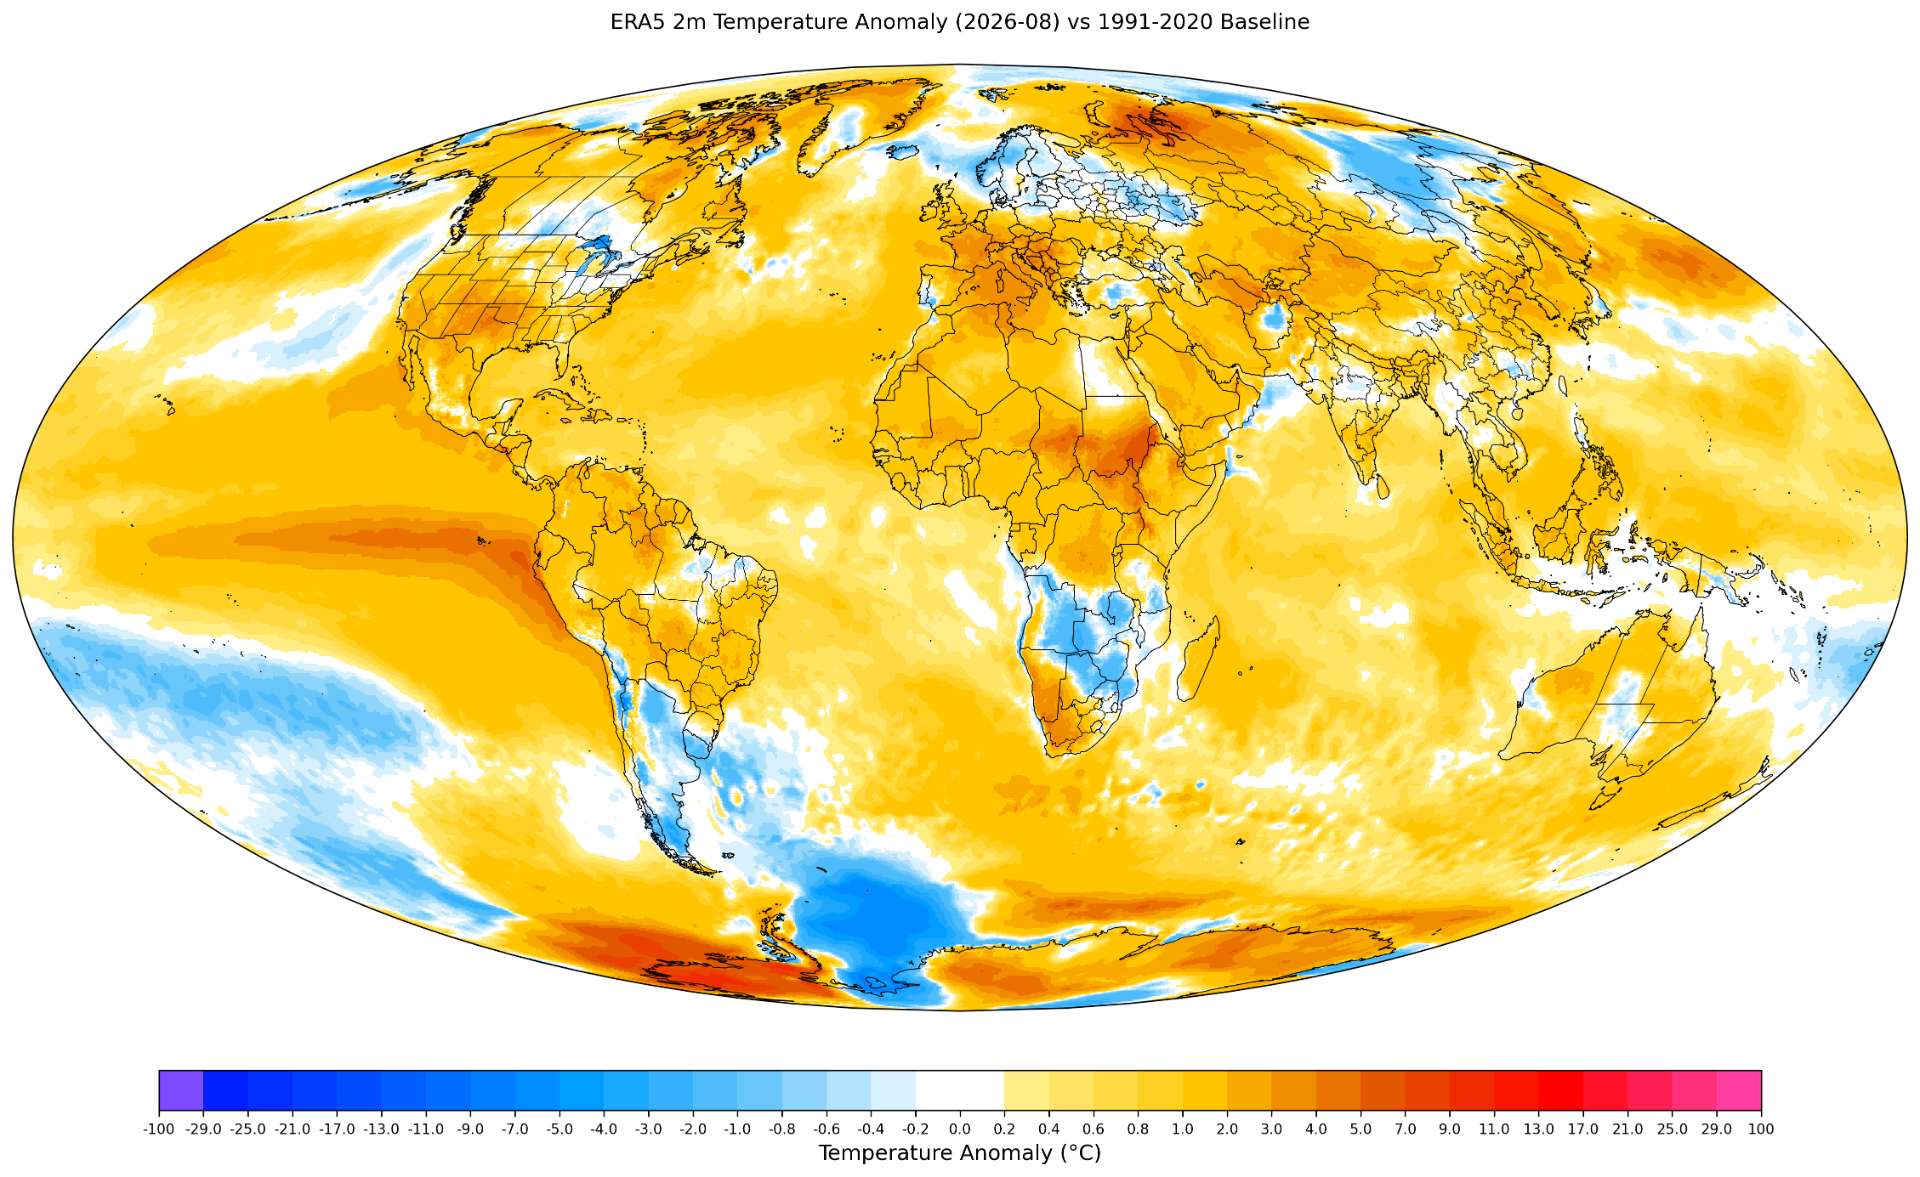
ERA5 Plots for comparison (with some superensemble data):


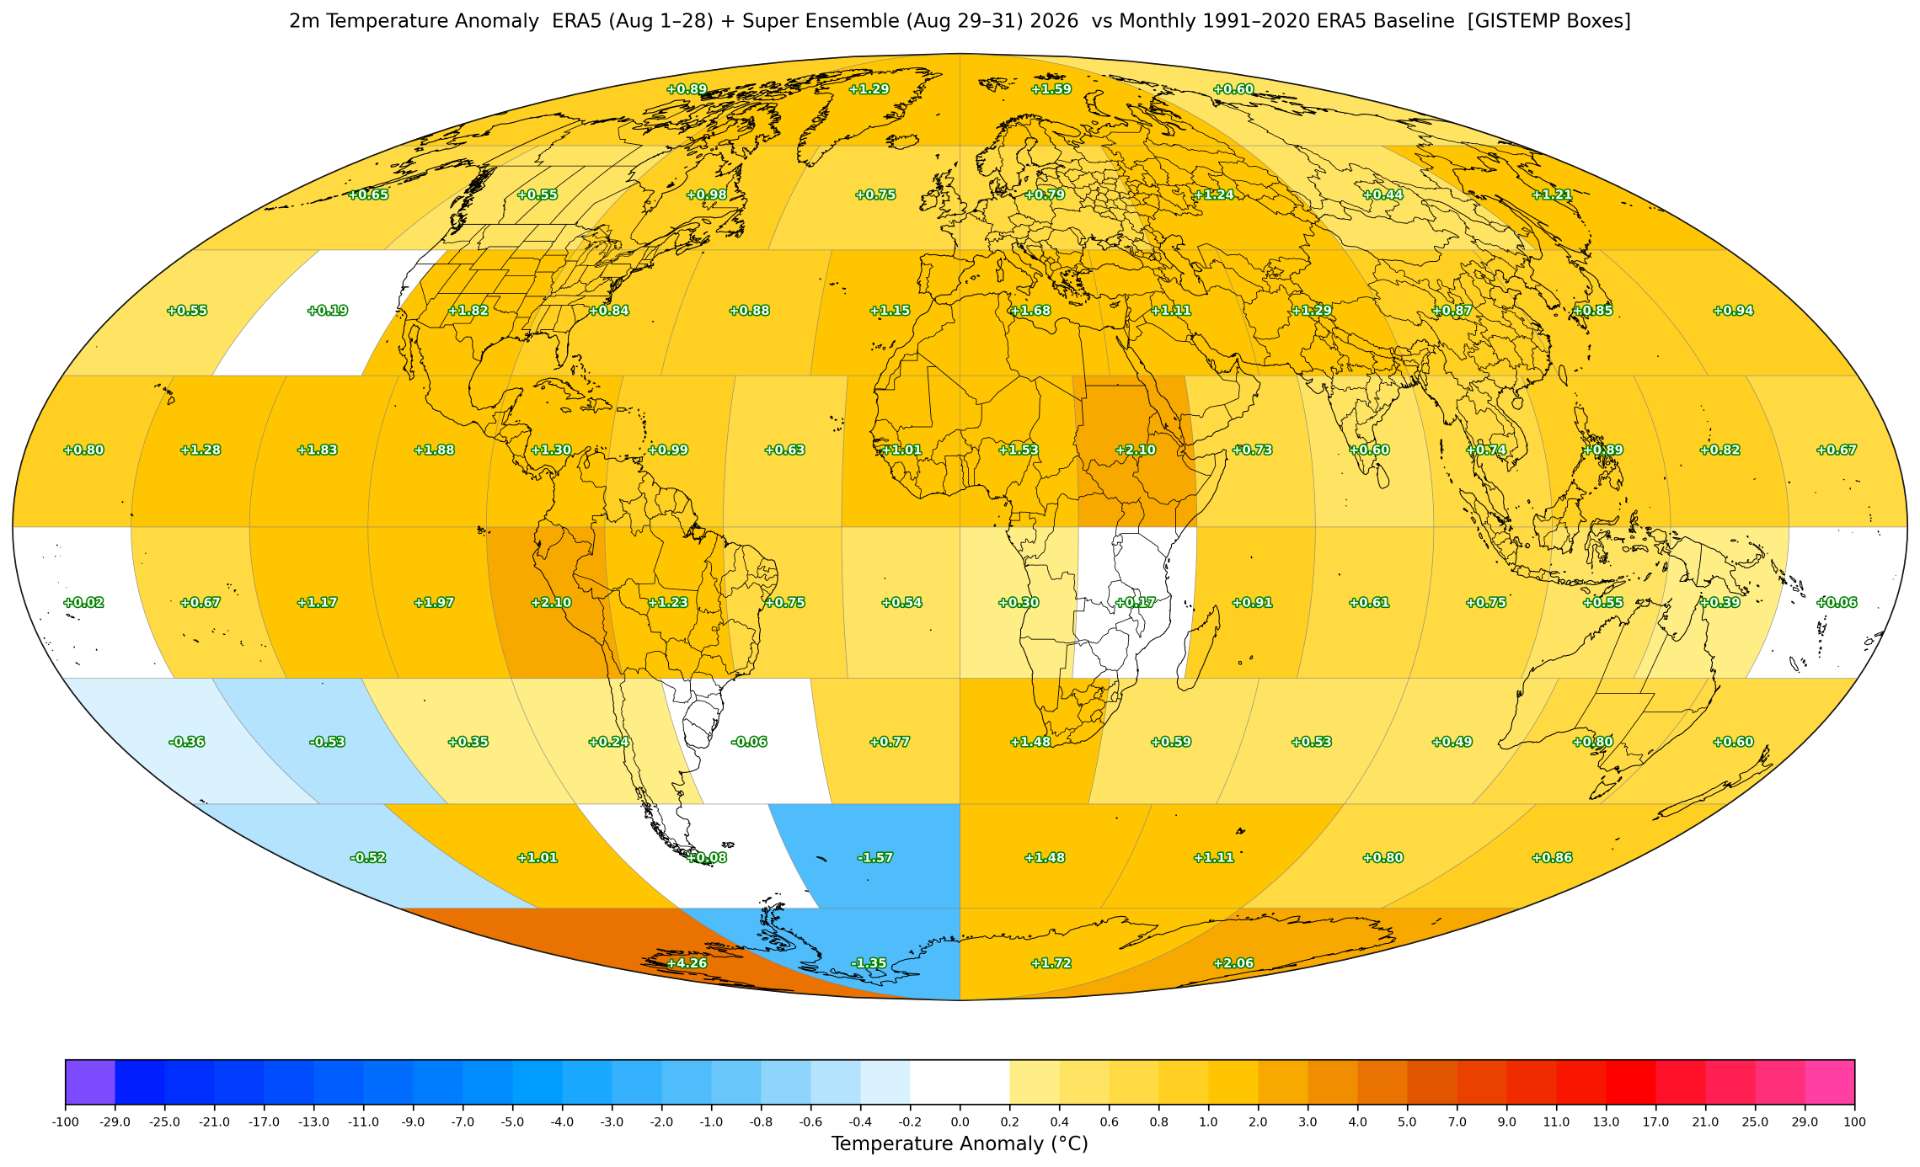
Right away you can see the anomaly from Elizabeth in Antarctica is currently under-represented. The actual CLIMAT data (which should show up tomorrow or in a few days) shows it at about a +6 C anomaly:
Elev. (m): 549.0, Station: AYM00089332, Name: ELIZABETH
LAT/LON: -82.62/-137.08, Value: -28.40, Anomaly: 6.32, Last30yrs -> mean: -34.86, min: -43.94, max: -26.19, std: 5.21
With PHA etc. it will likely reduce it further when it actually gets incorporated into GHCNm.
~
From my 3 normal regular models:
Point estimate (old, delta2 method, loti3 method) adjusted by prediction error mean: 1.4374, 1.3102 1.3980
Point estimate (mix), pre-adjusted by member prediction error mean: 1.3646
The large disagreement between the models is a bit of a concern....
~
And now from some still ongoing work where I swap the ghcnm land data for my own predictions.
I've also swapped in about 16 stations from Antarctica (from (TAC) CLIMAT messages without any correction) that are missing from the current ghcnm (especially since it includes MINNA BLUFF), but generally otherwise I'm just wholesale replacing all the other stations (including Antarctica stations) with my own predictions (the current Antarctica CLIMAT values are not far from my predictions, and they themselves are not far from the current GHCNm values anyway). The stations predicted are just the same stations from last month (ghcnm.20260809).
The 16 stations includes MINNA BLUFF which again is going to be biased 5-6 C warm roughly due to missing much data (I looked through field reports on the station and it does get covered in rime quite often -- based on what I'm seeing that's plausible now) -- the lower temperature sensor, which is actually closer to 2m (assuming no snow), has been performing well and what I use for comparison.
None of the predicted temps have applied PHA to them, just general fitting to ghcnm.

~
Some of the stations for Antarctica (near central Antarctica around -80S, 60E) are not shown on the station plotter since they are newer ones and don't have any 1991-2020 data (the ones with large warm anomalies in my predictions) (not among the 16 CLIMAT); some of this effect will likely be reduced by PHA on GHCNm if they meet its other QCF measures. Hard to identify them at the moment -- can only infer based on the subbox plots.
~
Running the "predicted" ghcnm with it yields a value of:
139.8005349
Given the prior prediction from the 3 models of 1.36 C this seems plausible. It's possible it could be a bit higher or lower than that but at least from the few Antarctica stations that look a bit too warm as mentioned (the ones not plotted and further reduction by PHA, especially for Elizabeth).
Based on this I expect it will probably decrease to 1.38 or 1.39 C or so (this is my subjective best guess as its not far from my model prediction also).
~
Plots for comparison from the predicted GHCNm data:
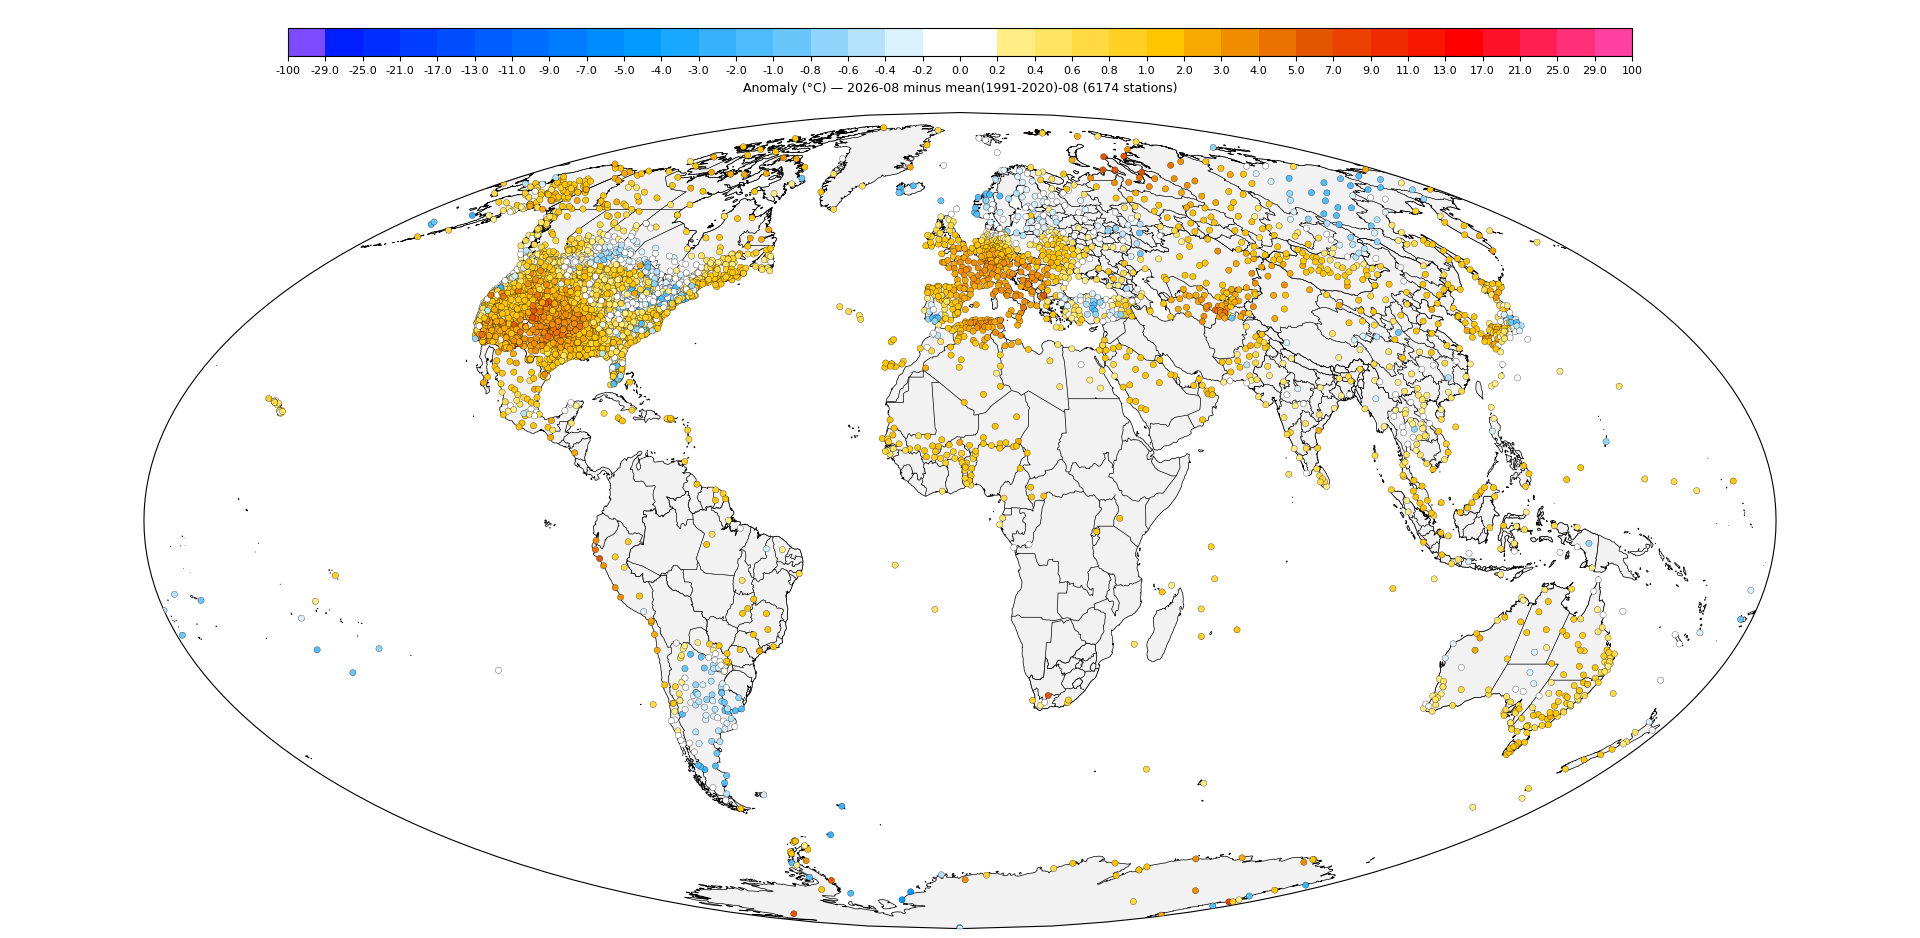
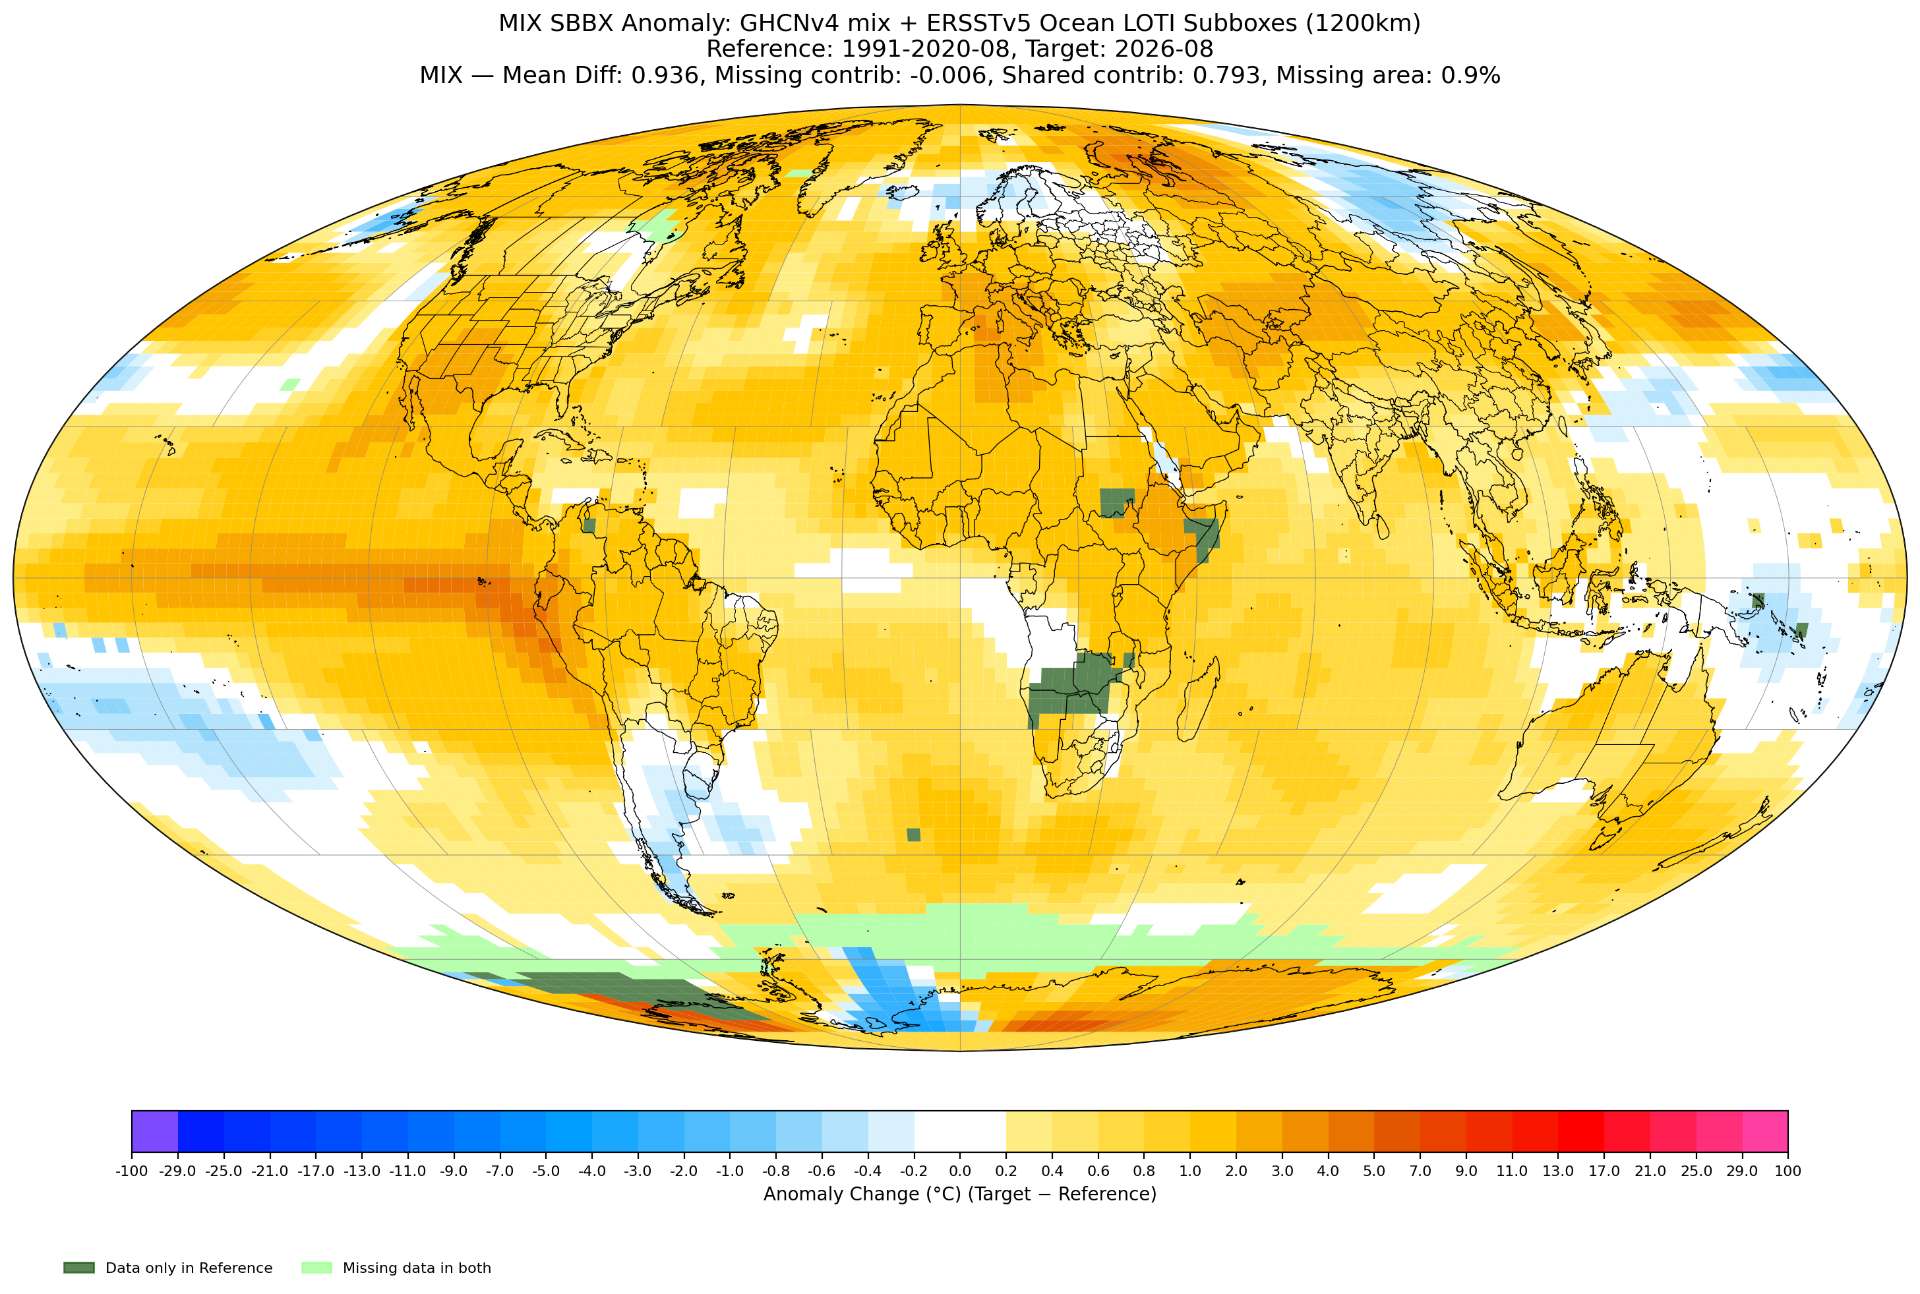
Subbox diff of current ghcnm - predicted on same temp. scale:
BLUE = ACTUAL GHCNM COLDER THAN PREDICTED
(more warming expected in Antarctica and South America too; interestingly it shows parts of China and SA expected to cool a bit -- perhaps for SA this will happen if we get more stations + with PHA reductions -- right now it looks like there are only a pair (and one very warm); for China it should happen naturally?):

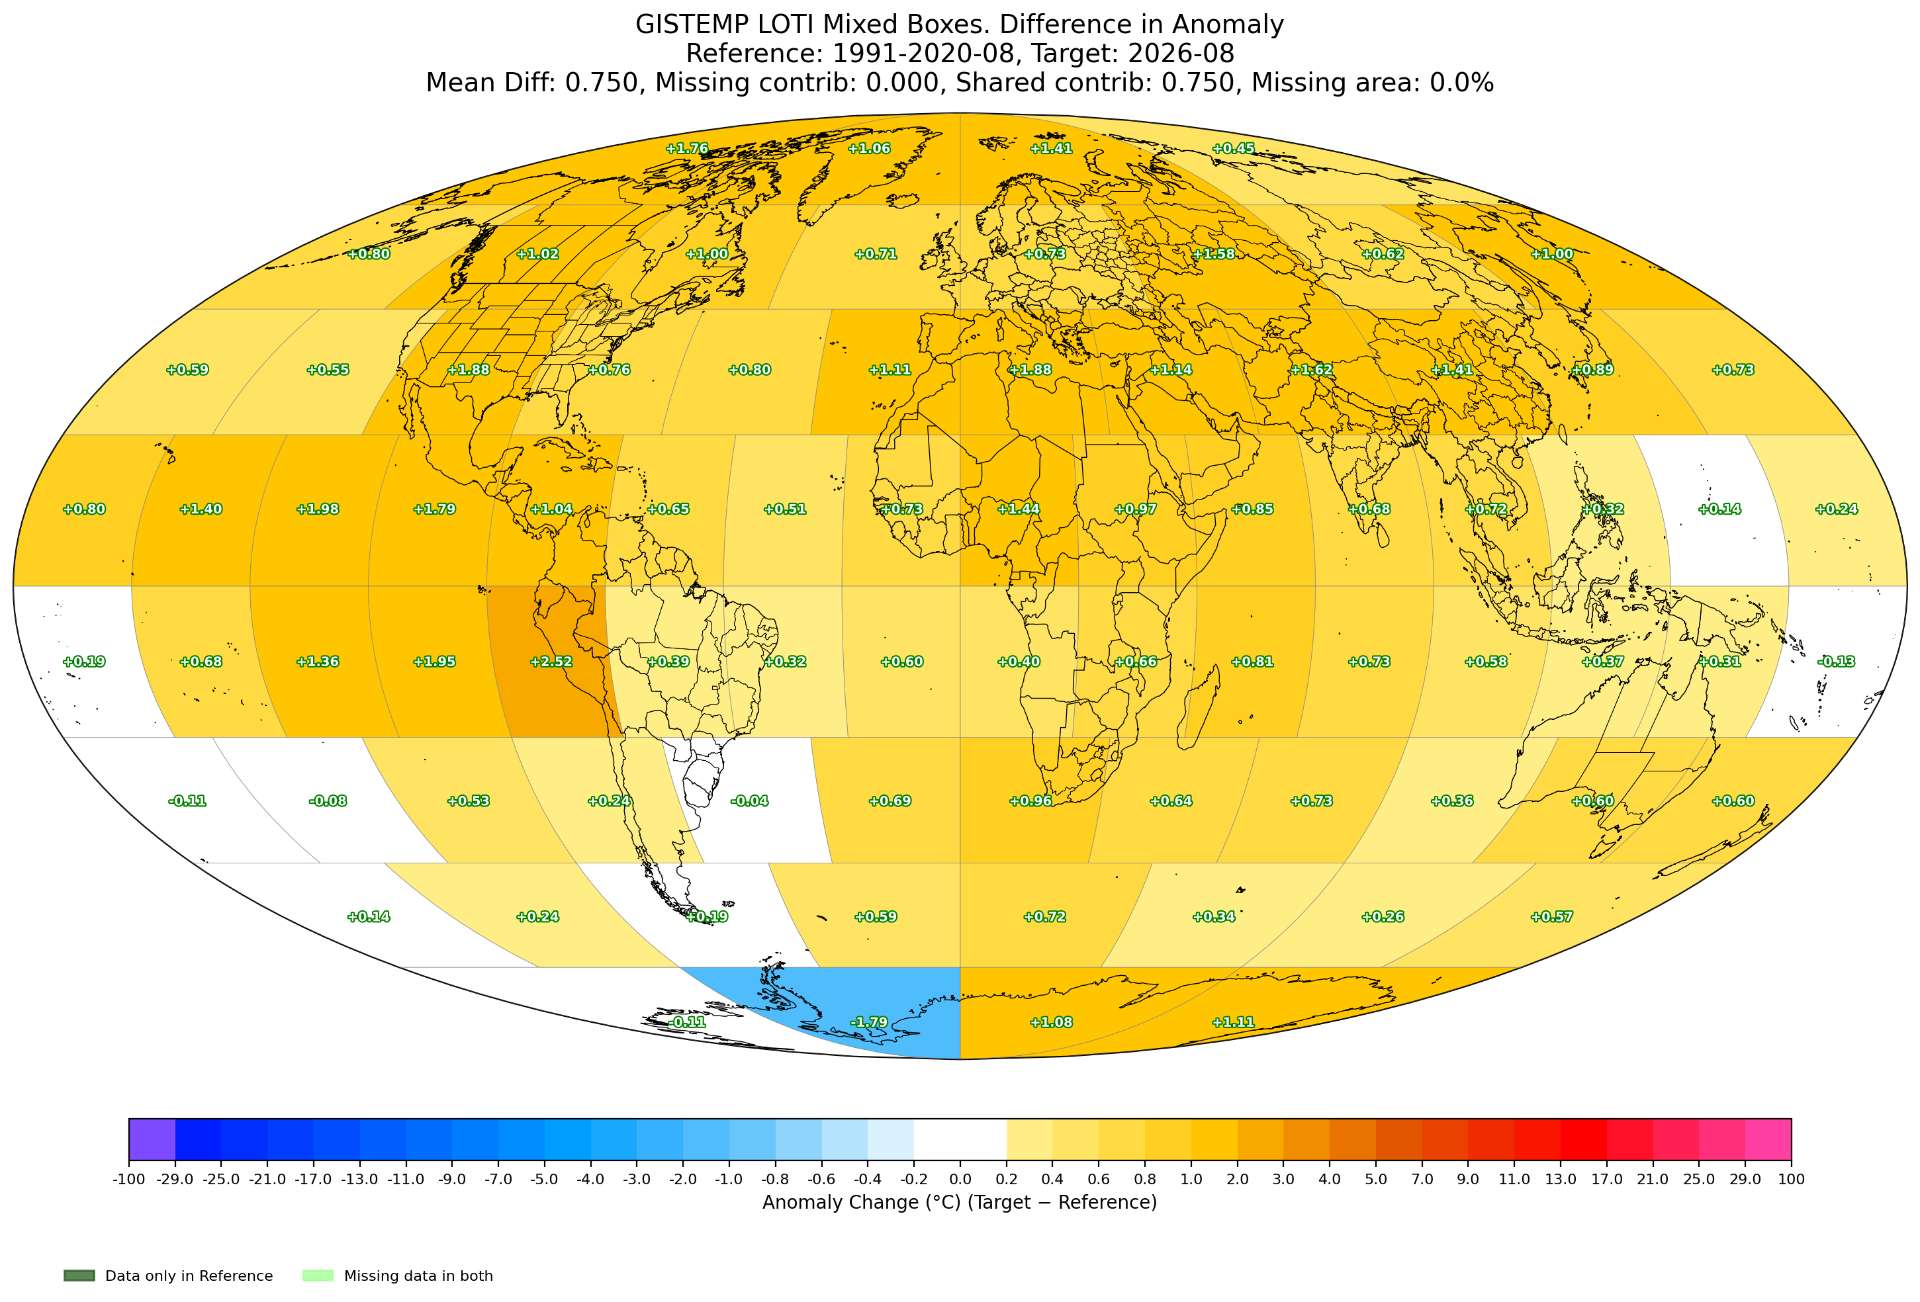
ghcnm.v4.0.1.20260903:
132.682
About 150 more stations got added with marginal change to the LOTI


~
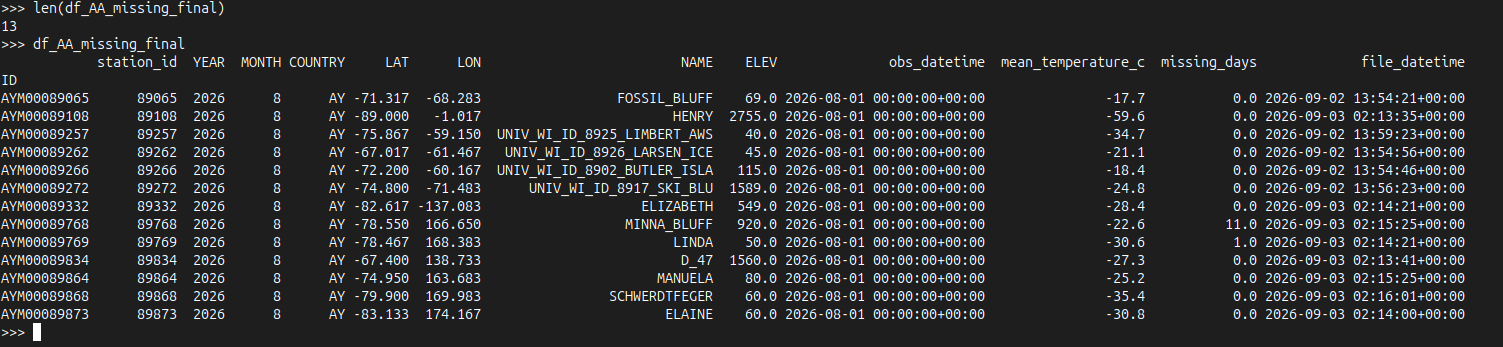
3 more of the Antarctica stations that already had CLIMAT messages got added
ROTHERA, CONCORDIA, and D_10
Not sure why it takes so long for the pipeline that feeds GHCNm to process them... as far as I can tell the other 13 (which include ELIZABETH and MINNA_BLUFF) should have already made it into last night's GHCNm as D_10 got transmitted on the GTS around the same time yesterday morning, being among the latest batch of the 16, and it got added while other staler ones didn't (like FOSSIL_BLUFF for instance).
ghcnm.v4.0.1.20260904:
136.770
A lot of stations got removed that were in yesterday's run (thus the drop in coverage). Should warm further once they are added back and rest of the stations get added.
"August Release: Thu, 10 Sep 2026, 11:00 AM EDT"
Release is scheduled for Thursday, which means likely their run will be done on Tuesday or Wednesday...
~
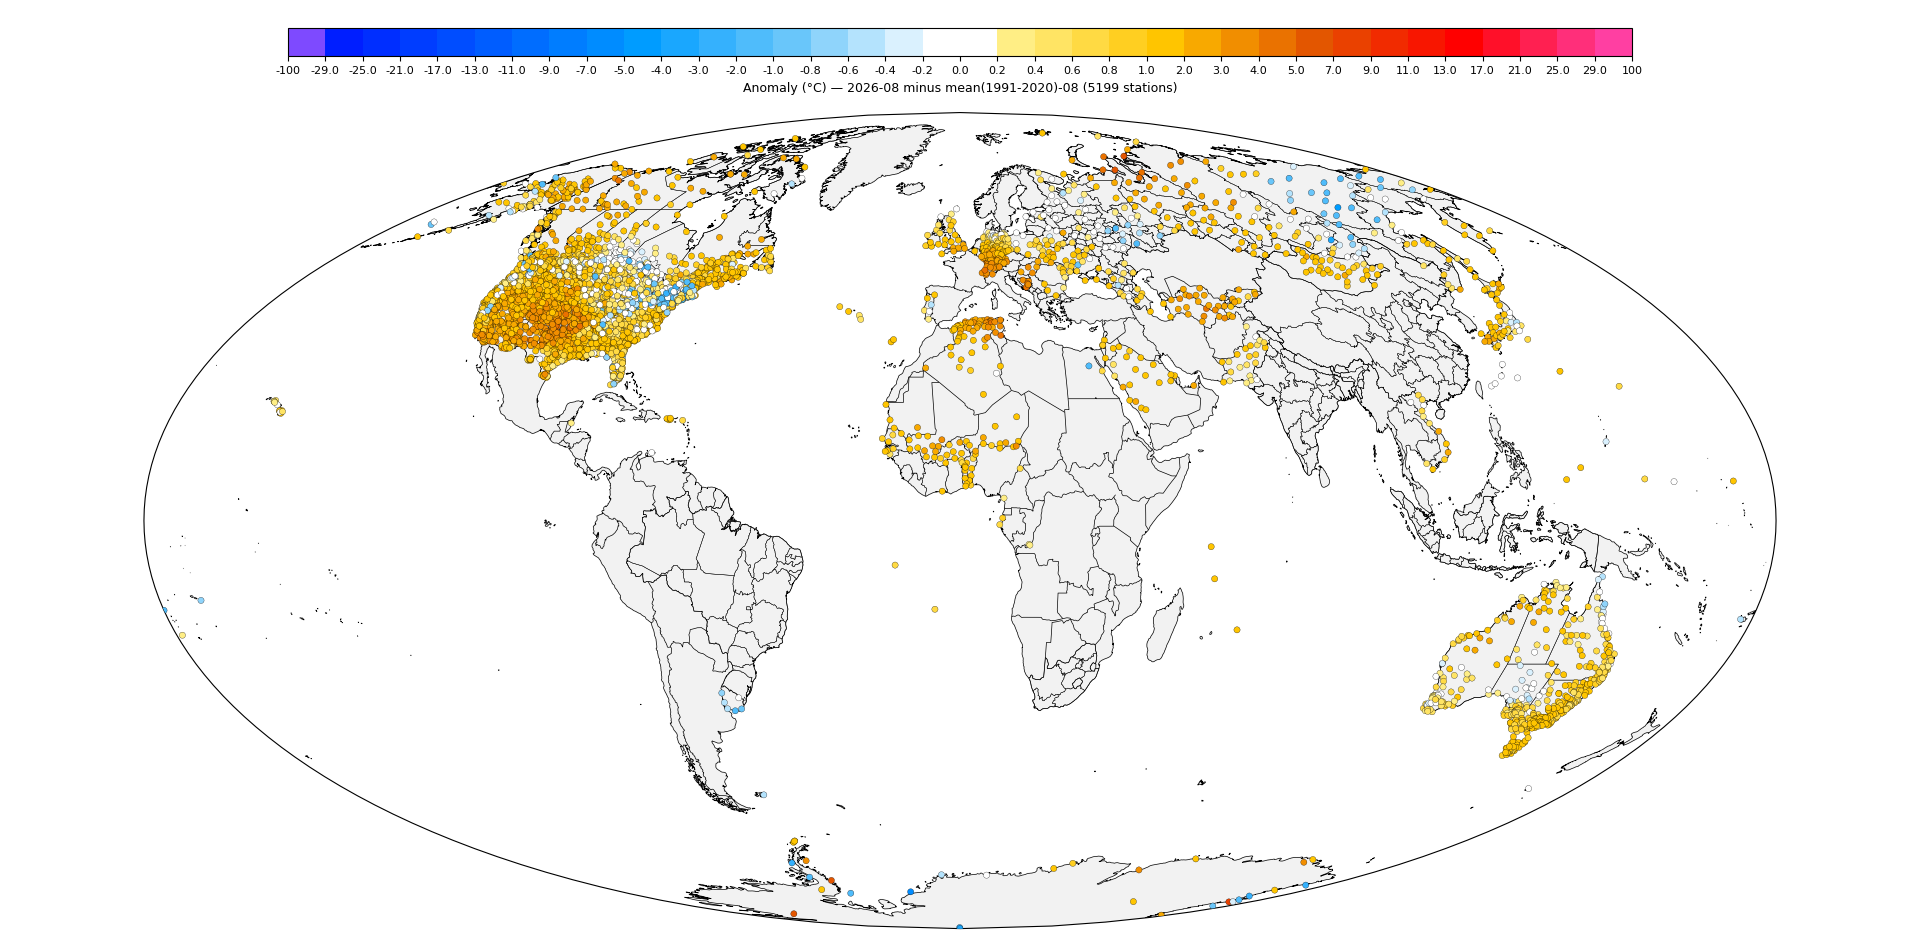


ghcnm.v4.0.1.20260905:
140.132
(Some plots of analysis of hindcast land station prediction analysis at the bottom)
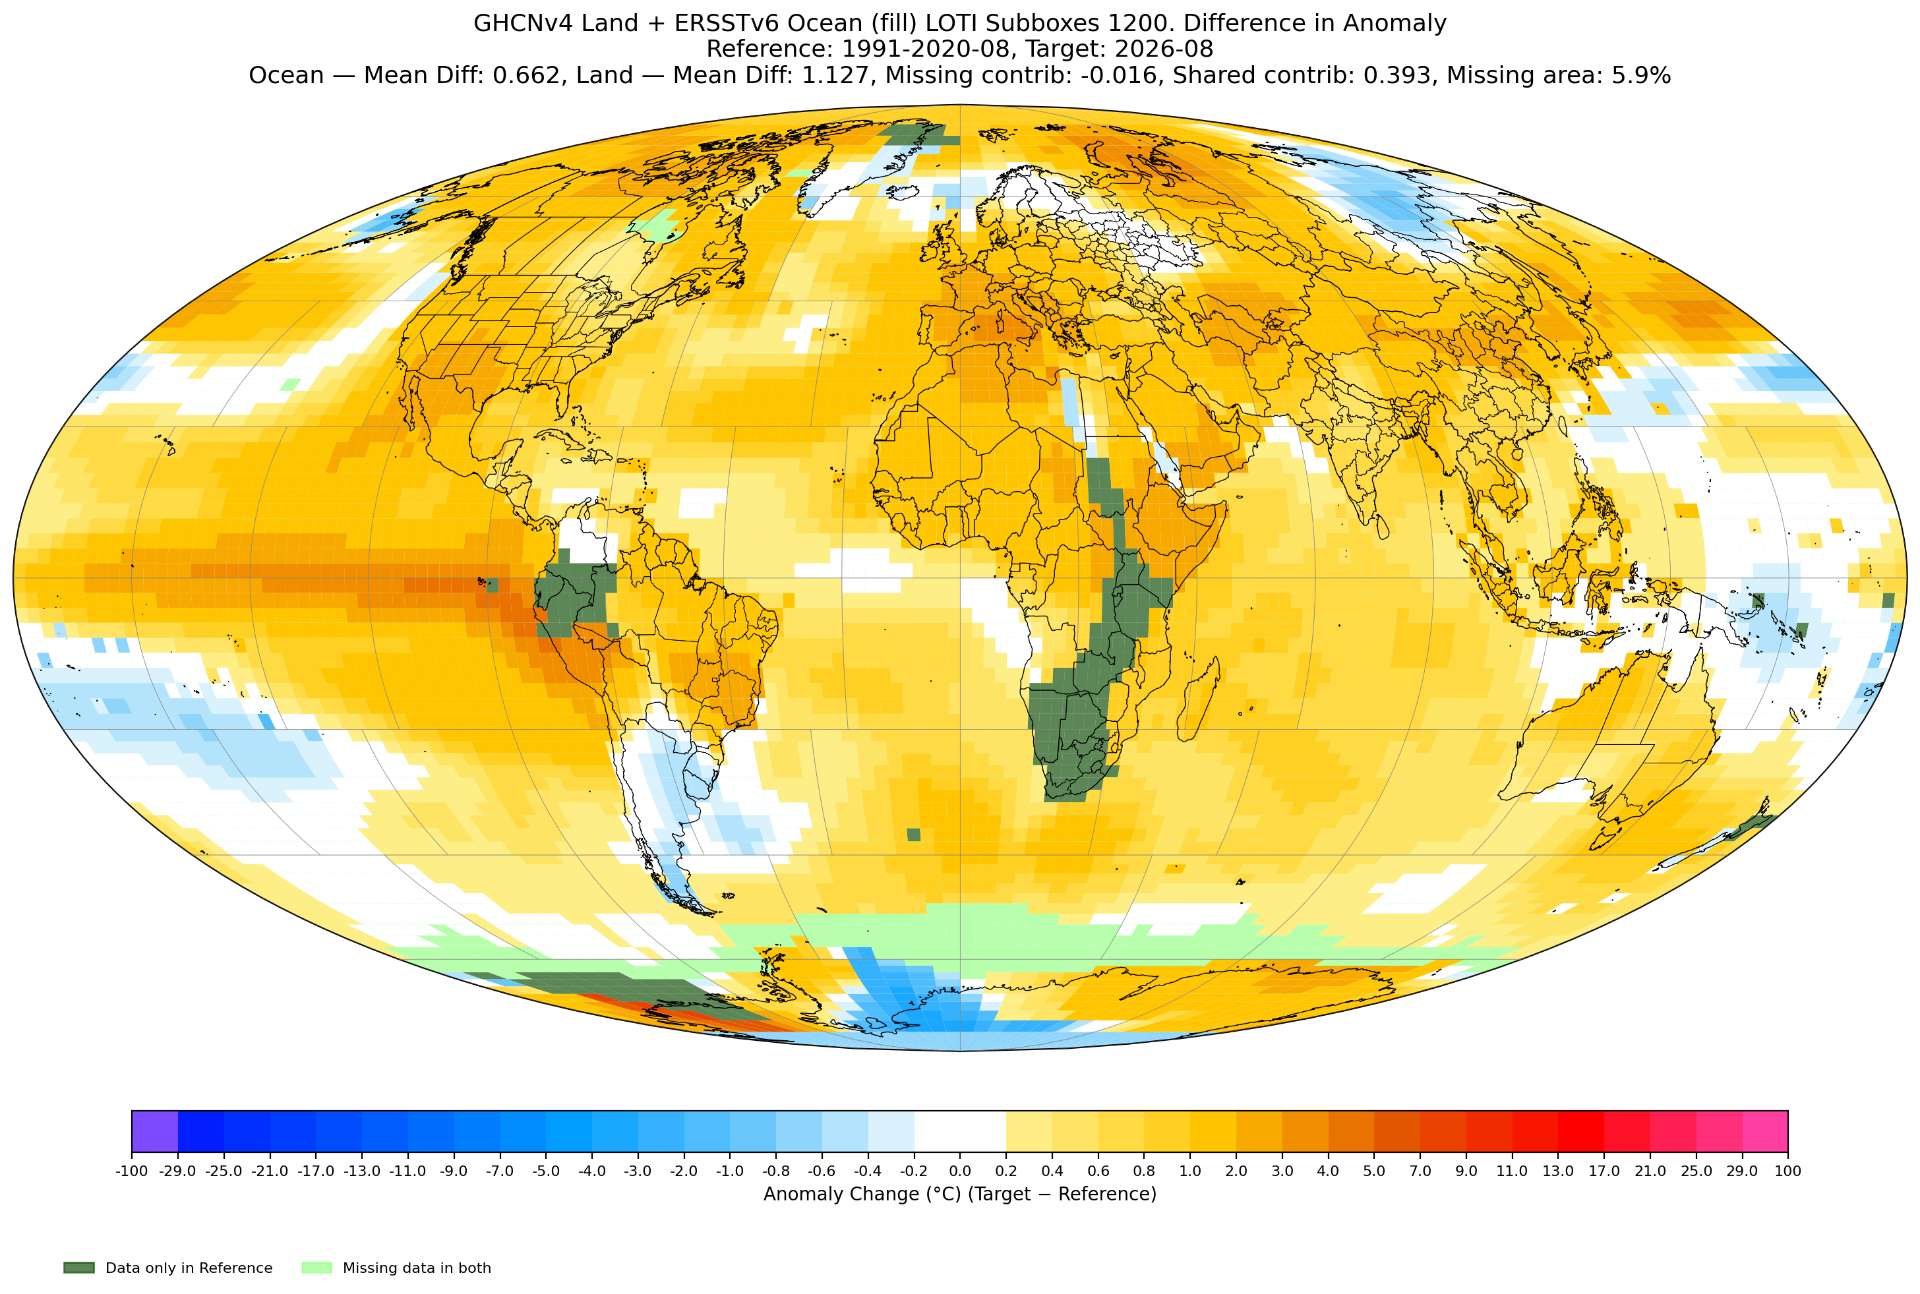

Final ERA5 for reference:
~
Based on the below I'm subjectively leaning towards not expecting much more cooling relative to where we are at (could even slightly warm) (previously I expected 1.38-1.39 from station predictions) so it looks like 1.39-1.40 C is more plausible now, especially given the coverage).
~
Diff plot for new GHCNm without updating the station predictions I made on Sept 3rd with new ERA5 data.

~
Some random notes followed by updated hindcast station prediction plots:
No China data data yet, but according to the updated diff plot from the station predictions I did a few days ago, so it's subboxes/boxes should cool slightly if the predictions are any good. Pacific island nations are more of a question mark -- hindcast bias plots (below) for 2021-2025 show observations tend to be biased a bit warm relative to my predictions (as was last month) so I'm not sure we will see much cooling from them despite the diff plot showing they are currently biased a bit warm.
Also still missing South Africa (including stations that were present in the run from a couple days ago); seems like based on the station predictions (the median,mean 1991-2020 anomaly of the stations being +1.86 and +1.60 C) it should warm the boxes compared to today's run (perhaps about +0.005 C more warming globally).
Greenland also missing (predictions have its median, mean 1991-2020 anomaly of +1.15 C, +1.92 C); this should cause a bit further warming relative to how some of its subboxes are currently infilled.
As for Peru (+2.11, +2.43C for median,mean 1991-2020 anomaly) hard to say if these predictions are any good as they are difficult, but as is they are cooler than the current subboxes temps as they are currently infilled (from stations in northern Chile), the box anomaly (from the very warm subbox anomalies from El Nino) so it's main box (which is at +2.8C anomaly) should cool a bit when they come in.
In Antarctica, compared to last month, we are still missing DOME_C_II, G3, PALMER_STATION; none of which will be significant factors so it looks like it will remain biased as is (a bit cool relative to predictions as is): We don't often get G3 (aka Amery) data, and looking at the SYNOP reports I can see why -- it was missing 12 days of data according to FM71 spec, so don't expect its data. As for DOME_C_II, looking at GHCNm the source has been GHCND/DATZILLA for the station the last several months and given that BAS is showing 97% temporal coverage (-59.5( 97)) with that number it would put the 1991-2020 anomaly very roughly around +2.5 C, which would have some nearly negligible warming compared to the +1 C anomalies for the subboxes in its area (the CLIMAT message is usually transmitted late for some reason but since it relies on GHCND its up to NCEI whether it gets processed in time). As for PALMER_STATION (-4.63 C, which would be a 1991-2020 anomaly of around 1.19 C), we are only missing 3 days of data per FM71 spec looking at SYNOP data, and looking at my own records its only come 3/19 days later than the 7th (2/19 after the 8th) so it's likely we will get the CLIMAT message tomorrow and it show up in GHCNm on tuesday/wednesday in time. However, given that the anomalies for the subboxes near PALMER_STATION are already around +1 C it should have negligible change when it comes in.
~
Hindcast analysis of station predictions
Bias plots covering for 2021-05 to 2025-04:
Only August:
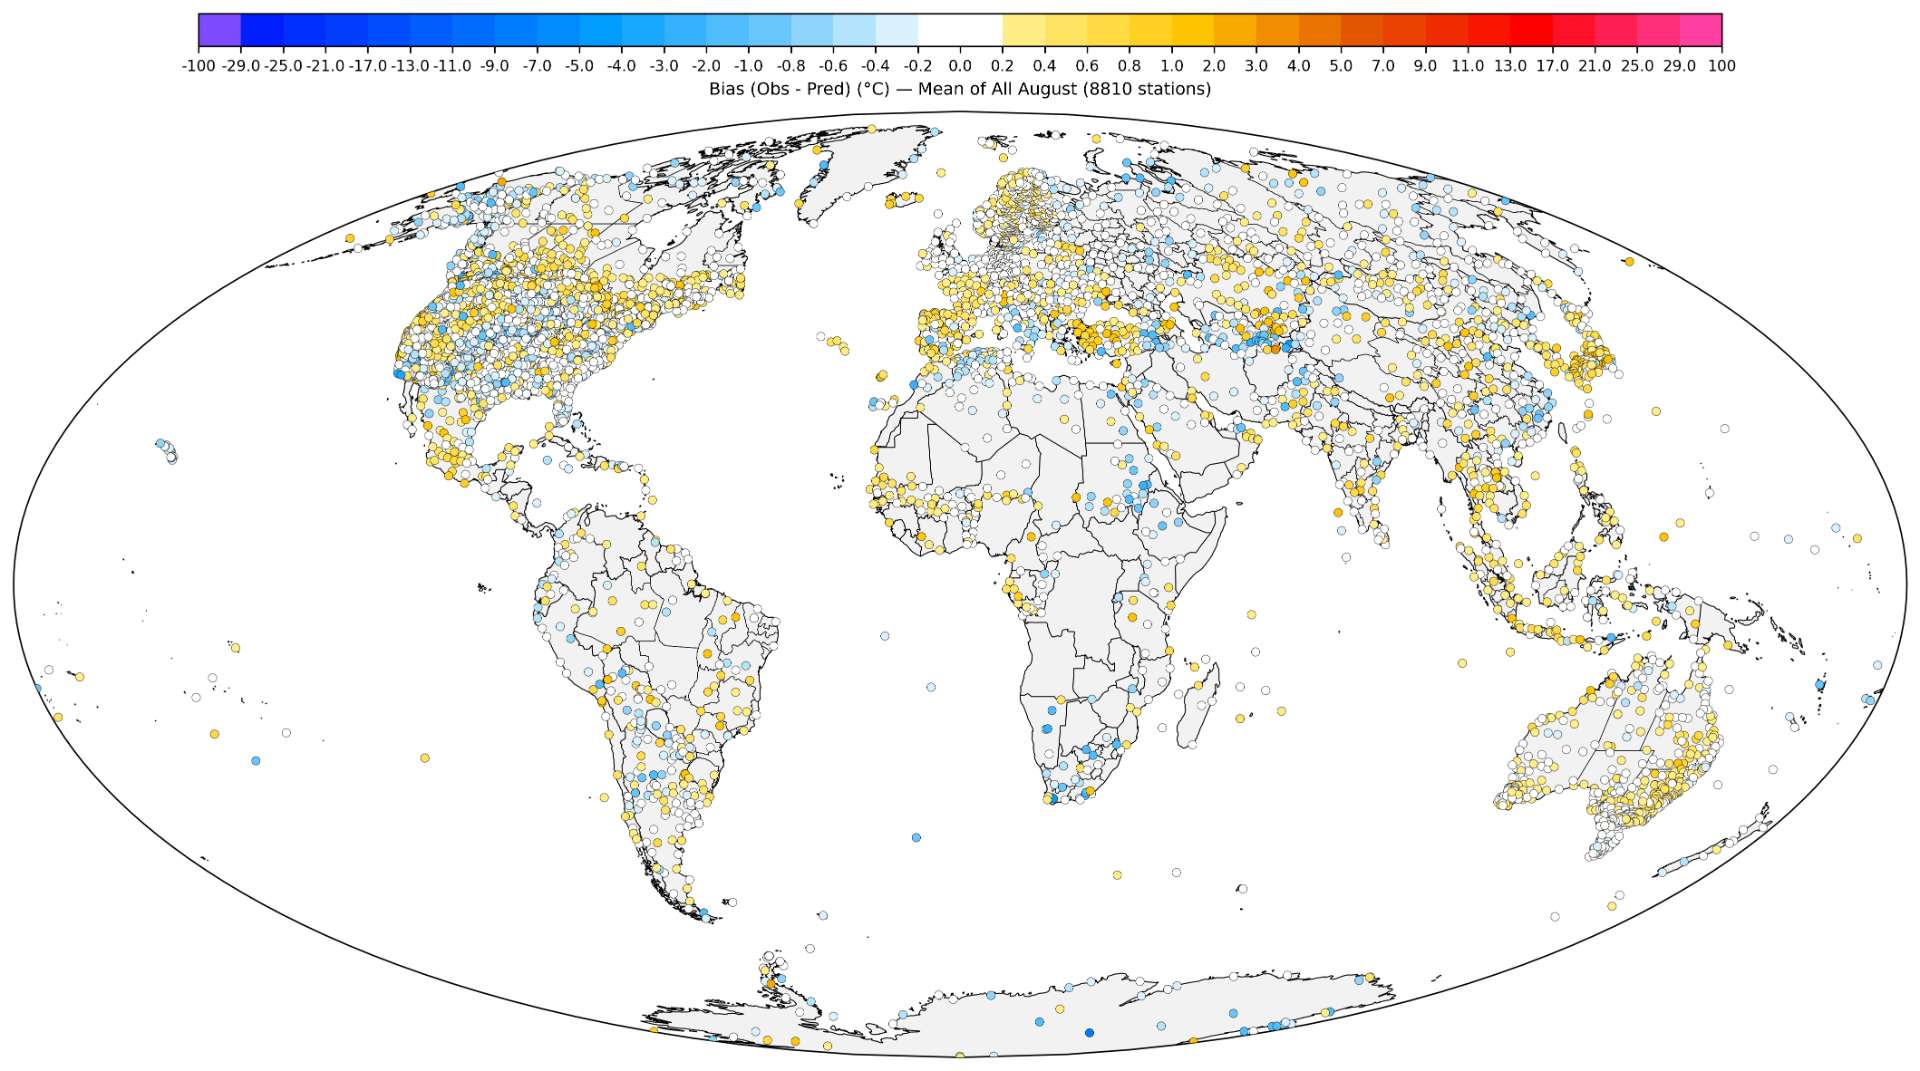
All months:

Global variance contribution fraction analysis for all months (aggregating across all land subbox station weights), marker scaled roughly to the fraction, colored by elevation:
(this is a more comprehensive update to the plot that I did previously, as it now includes 5 years of hindcasts)
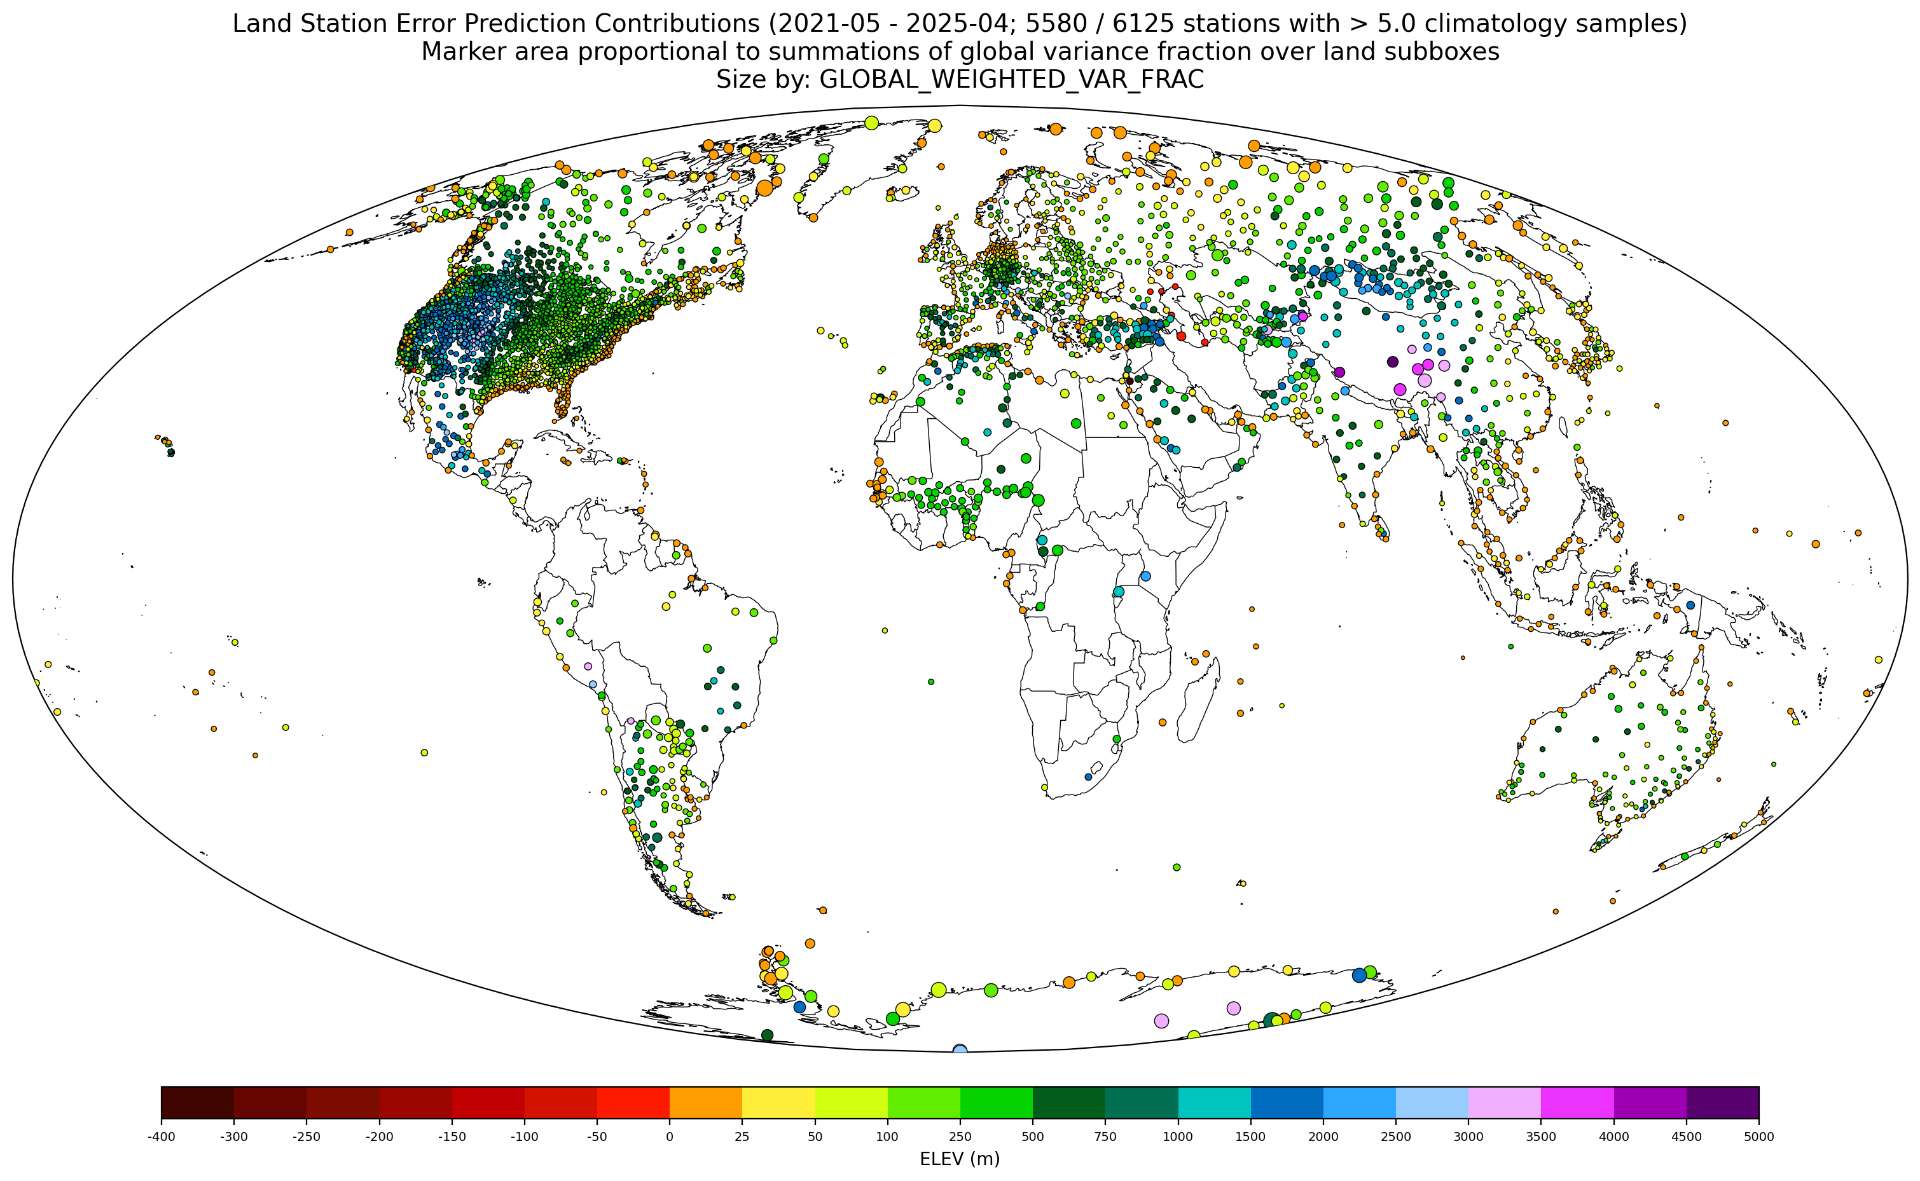
Aggregating by country (note the marker centroid shifts relative to where the fractional variance weights, so US centroid ends up in Canada due to large Alaskan stations):

Aggregate country-level variance contributions (Antarctica makes up 1/4 of the variance; Antarctica Canada and Russia makes up 1/2 of the total global variance for land station prediction errors over the same time period):

ghcnm.v4.0.1.20260906:
139.980
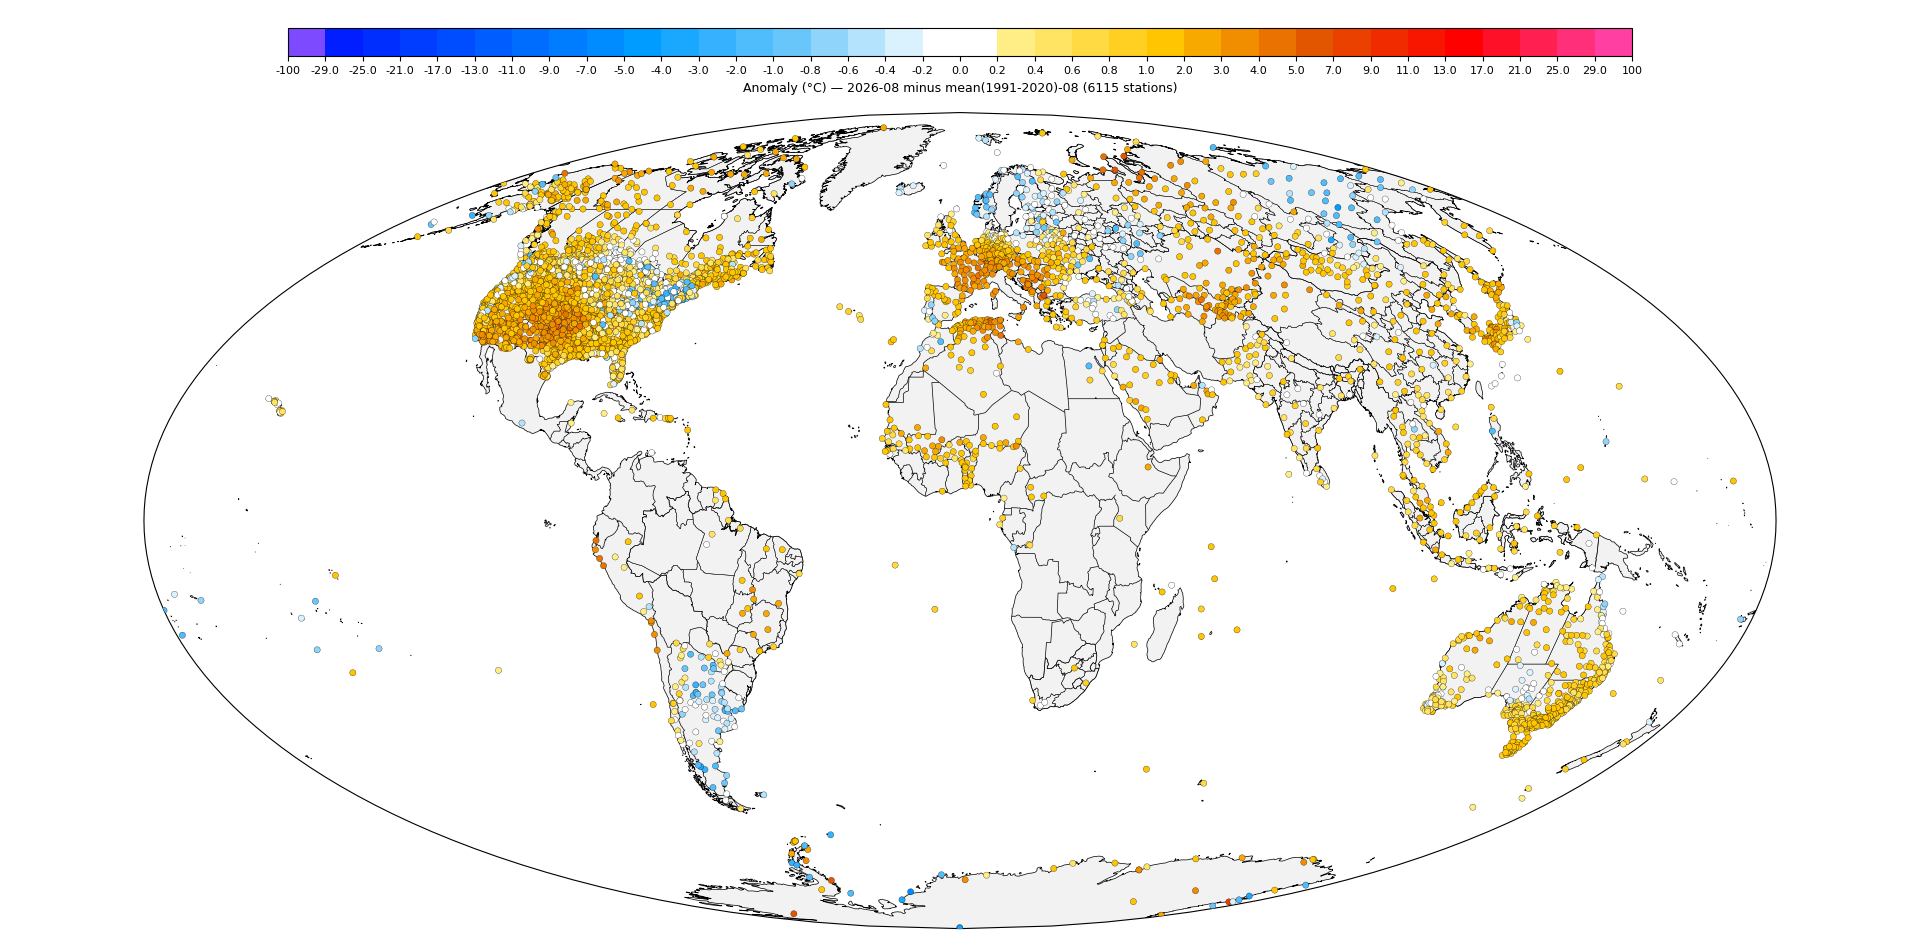
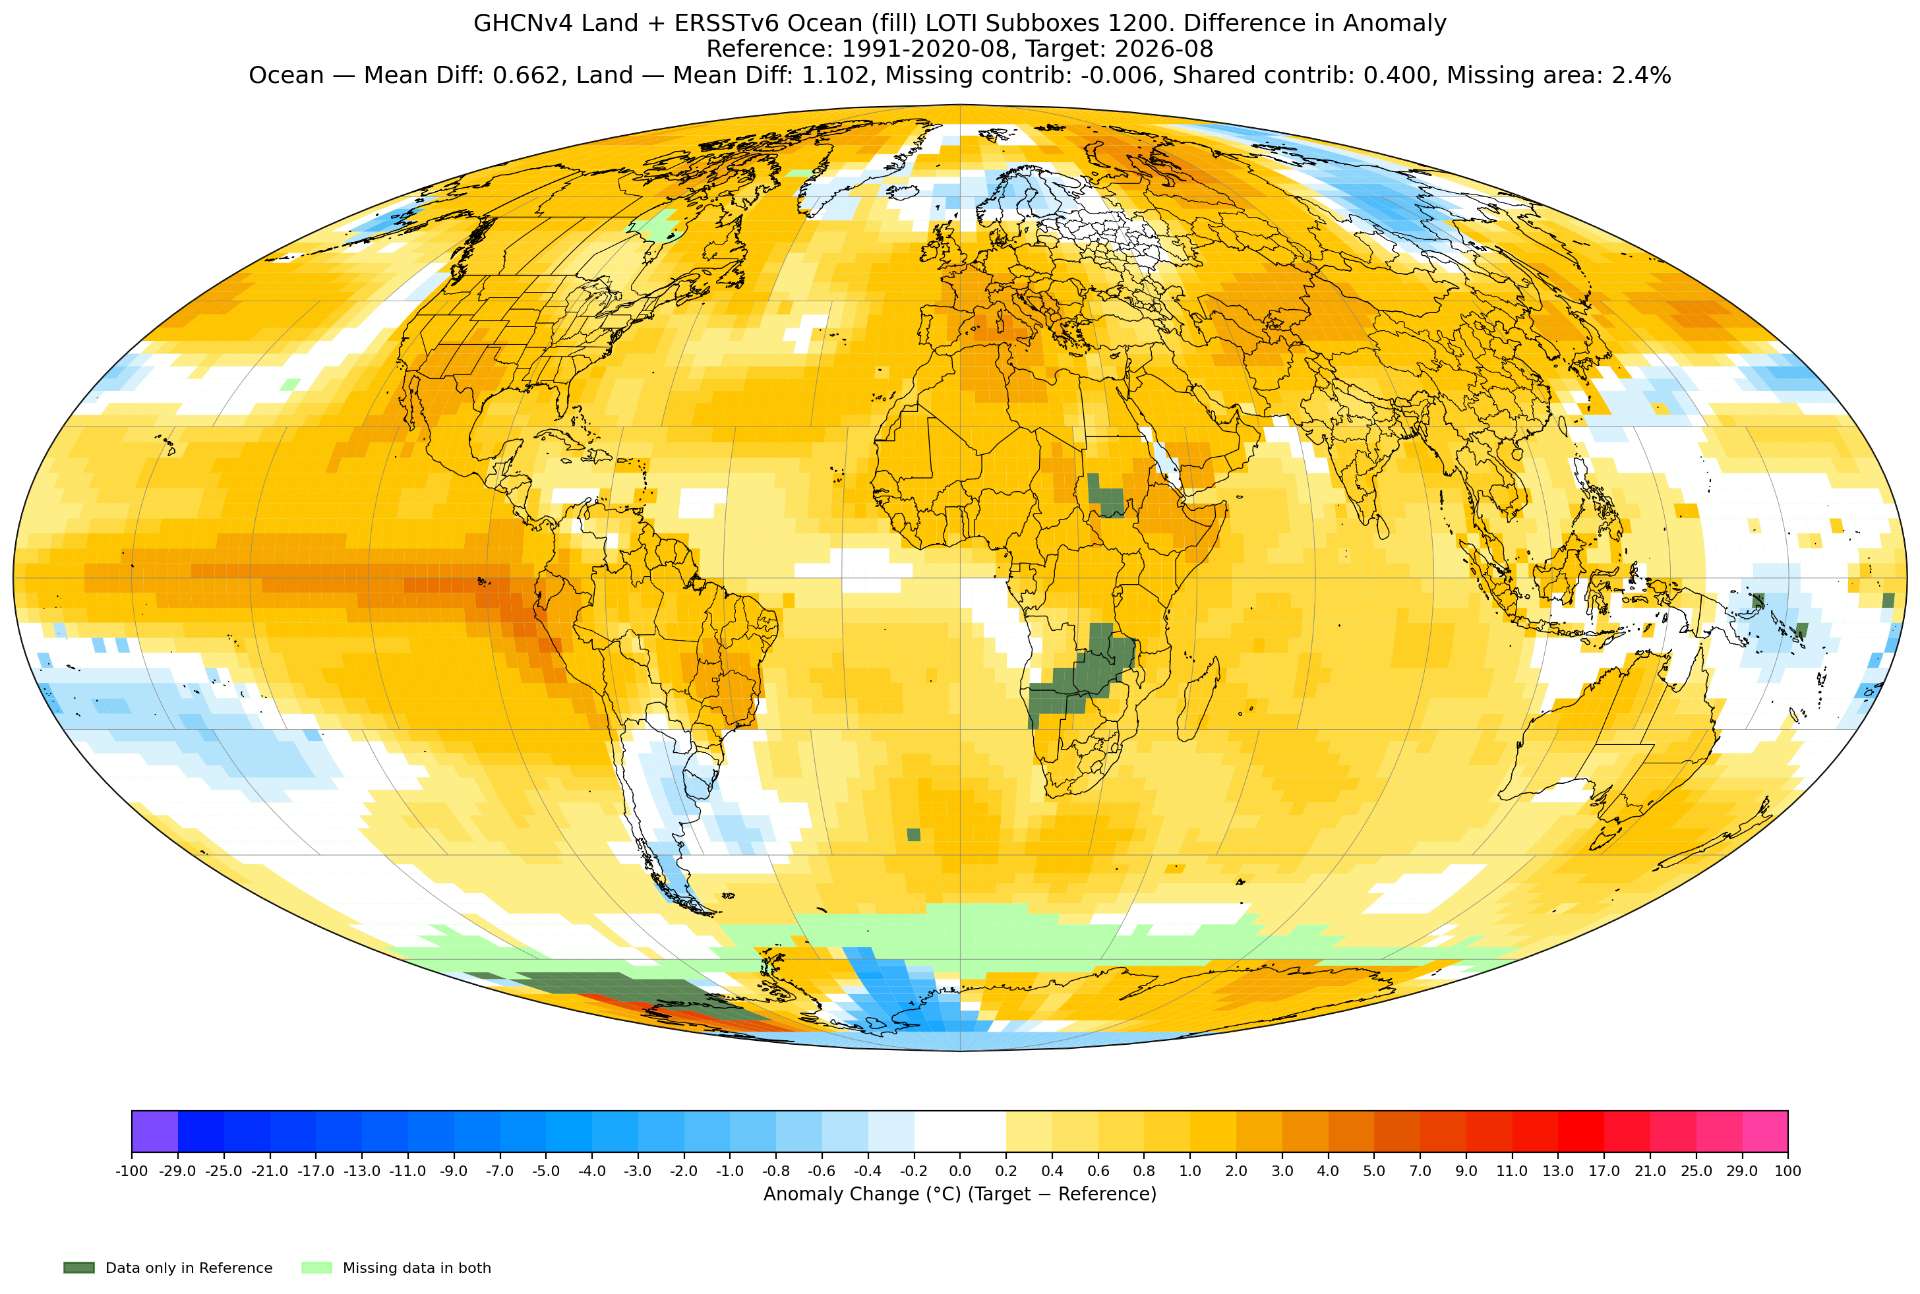

Some more stations came in, including China and SE Asia (which were a bit warmer than I predicted). Based on the below and the number of stations and coverage it looks likely now to stay at 1.40 C.
~
Still no Greenland data.
Not all of Peru in in either (more warm coastal stations to come), and a couple of South Africa stations are still missing.
Also some some stations missing on either side of the Mediterranean (Italy, Turkey; Libya, Egypt) as well as the Canary Islands.
Unknown about whether we will get Mexico in time and how much, and whatever Central America stations we end up getting (which is currently biased a bit cold compared to prediction).
Two more Antarctica stations. DOME_C_II came in when expected but is about +0.7 warmer than I expected (PHA and/or averaging method differences but not too significant). TROLL_IN_ANTARKTIS (which was significantly warm enough that it raised its neighbors) I didn't expect since it didn't make it into last month's data by release date and it isn't usually sourced by CLIMAT messages (GHCNd/DATZILLA):
Elev. (m): 1270.0, Station: AYM00089504, Name: TROLL_IN_ANTARKTIS
LAT/LON: -72.02/ 2.38, Value: -20.94, Anomaly: 3.15, Last30yrs -> mean: -23.08, min: -26.85, max: -18.05, std: 2.35
Elev. (m): 3250.0, Station: AYM00089828, Name: DOME_C_II
LAT/LON: -75.12/ 123.37, Value: -58.68, Anomaly: 3.32, Last30yrs -> mean: -61.79, min: -66.70, max: -54.35, std: 3.21
Updated diff plot from stale station predictions on Sept 3rd (subbox differences from latest GISTEMP run - Predicted Station Temps):

ghcnm.v4.0.1.20260907:
139.905
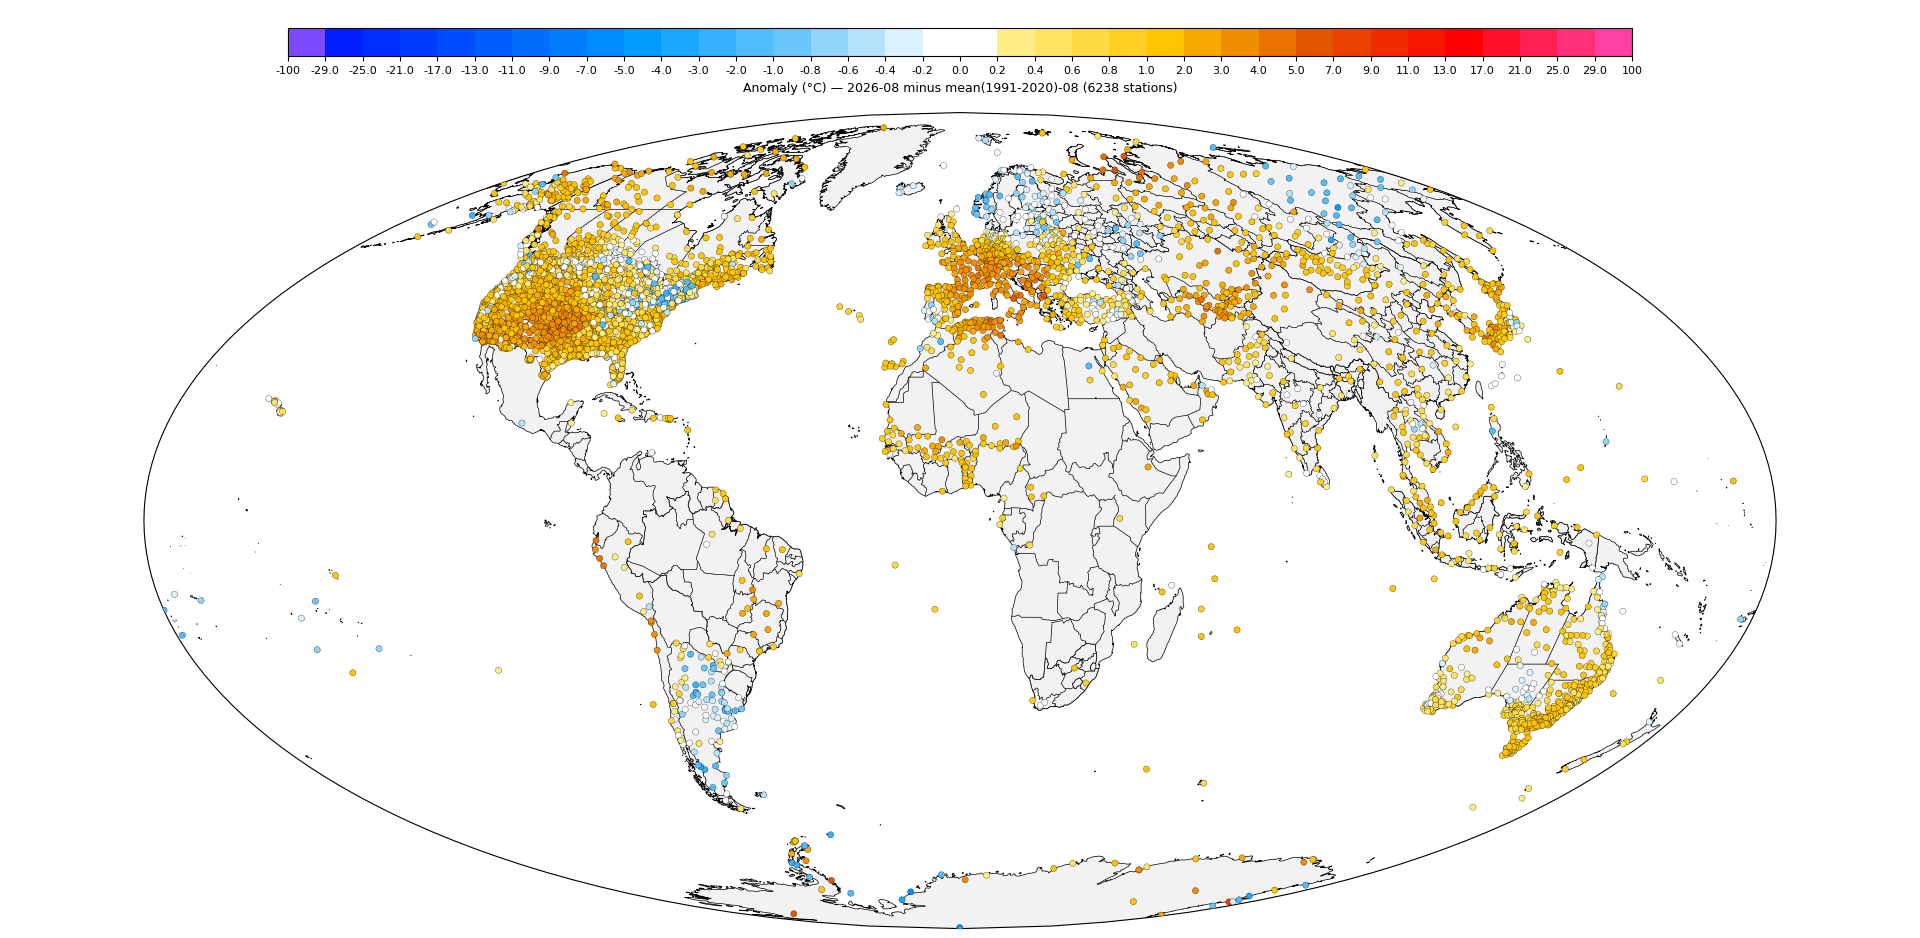
More than a hundred stations added: Italy, Turkey, Spain, Canary Islands, Sweden, Laos.
Negligible change since they were already well represented.
They'll either do the run likely today or tomorrow.


~
Updated diff plot without updating predictions from Sept 3rd (slight improvement from yesterday's run with Laos and more Mediterranean data):

ghcnm.v4.0.1.20260907:
139.683
Still no Greenland. Notably new were stations from Mexico, Mozambique, Columbia, a couple Central America stations, and scattered stations from some other places (i.e. Paraguay).
It was Mozambique's stations that provided the bit of cooling compared to yesterday.
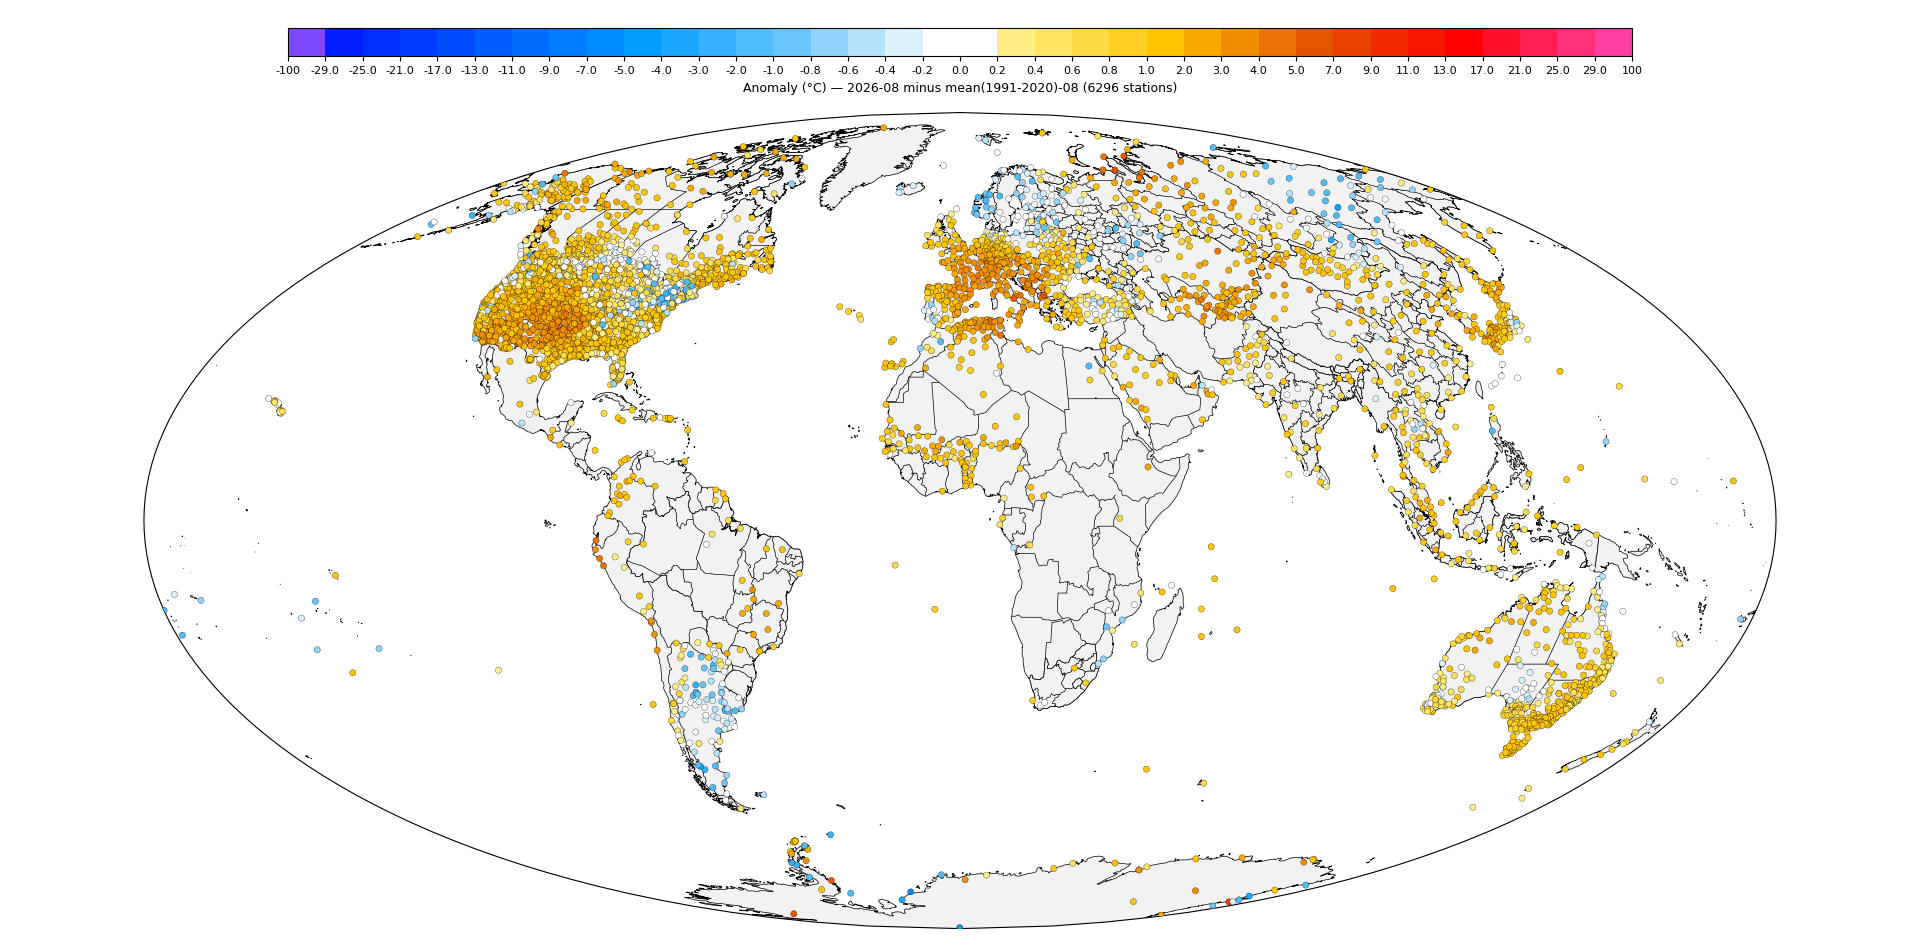
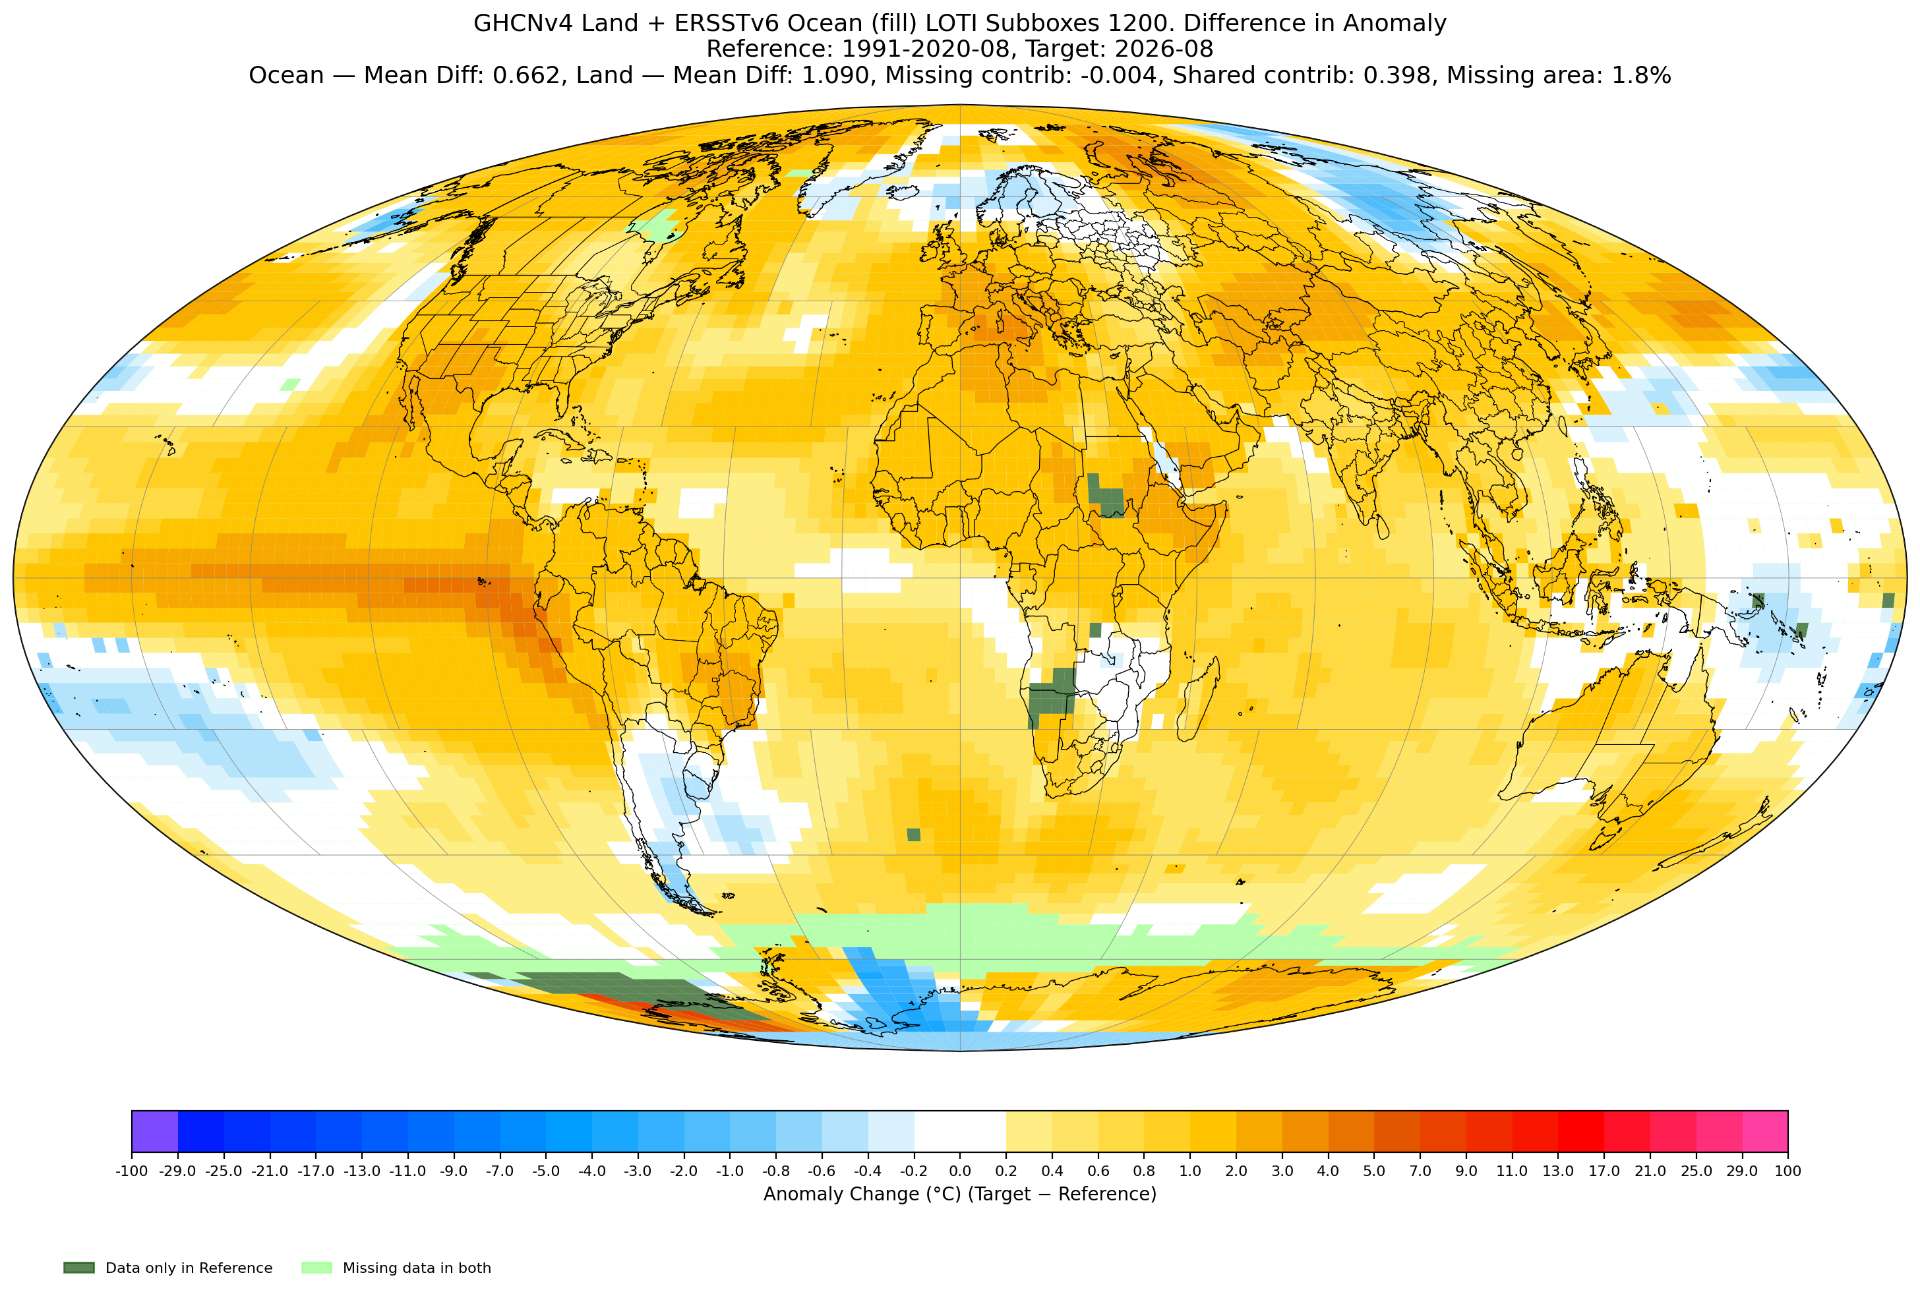
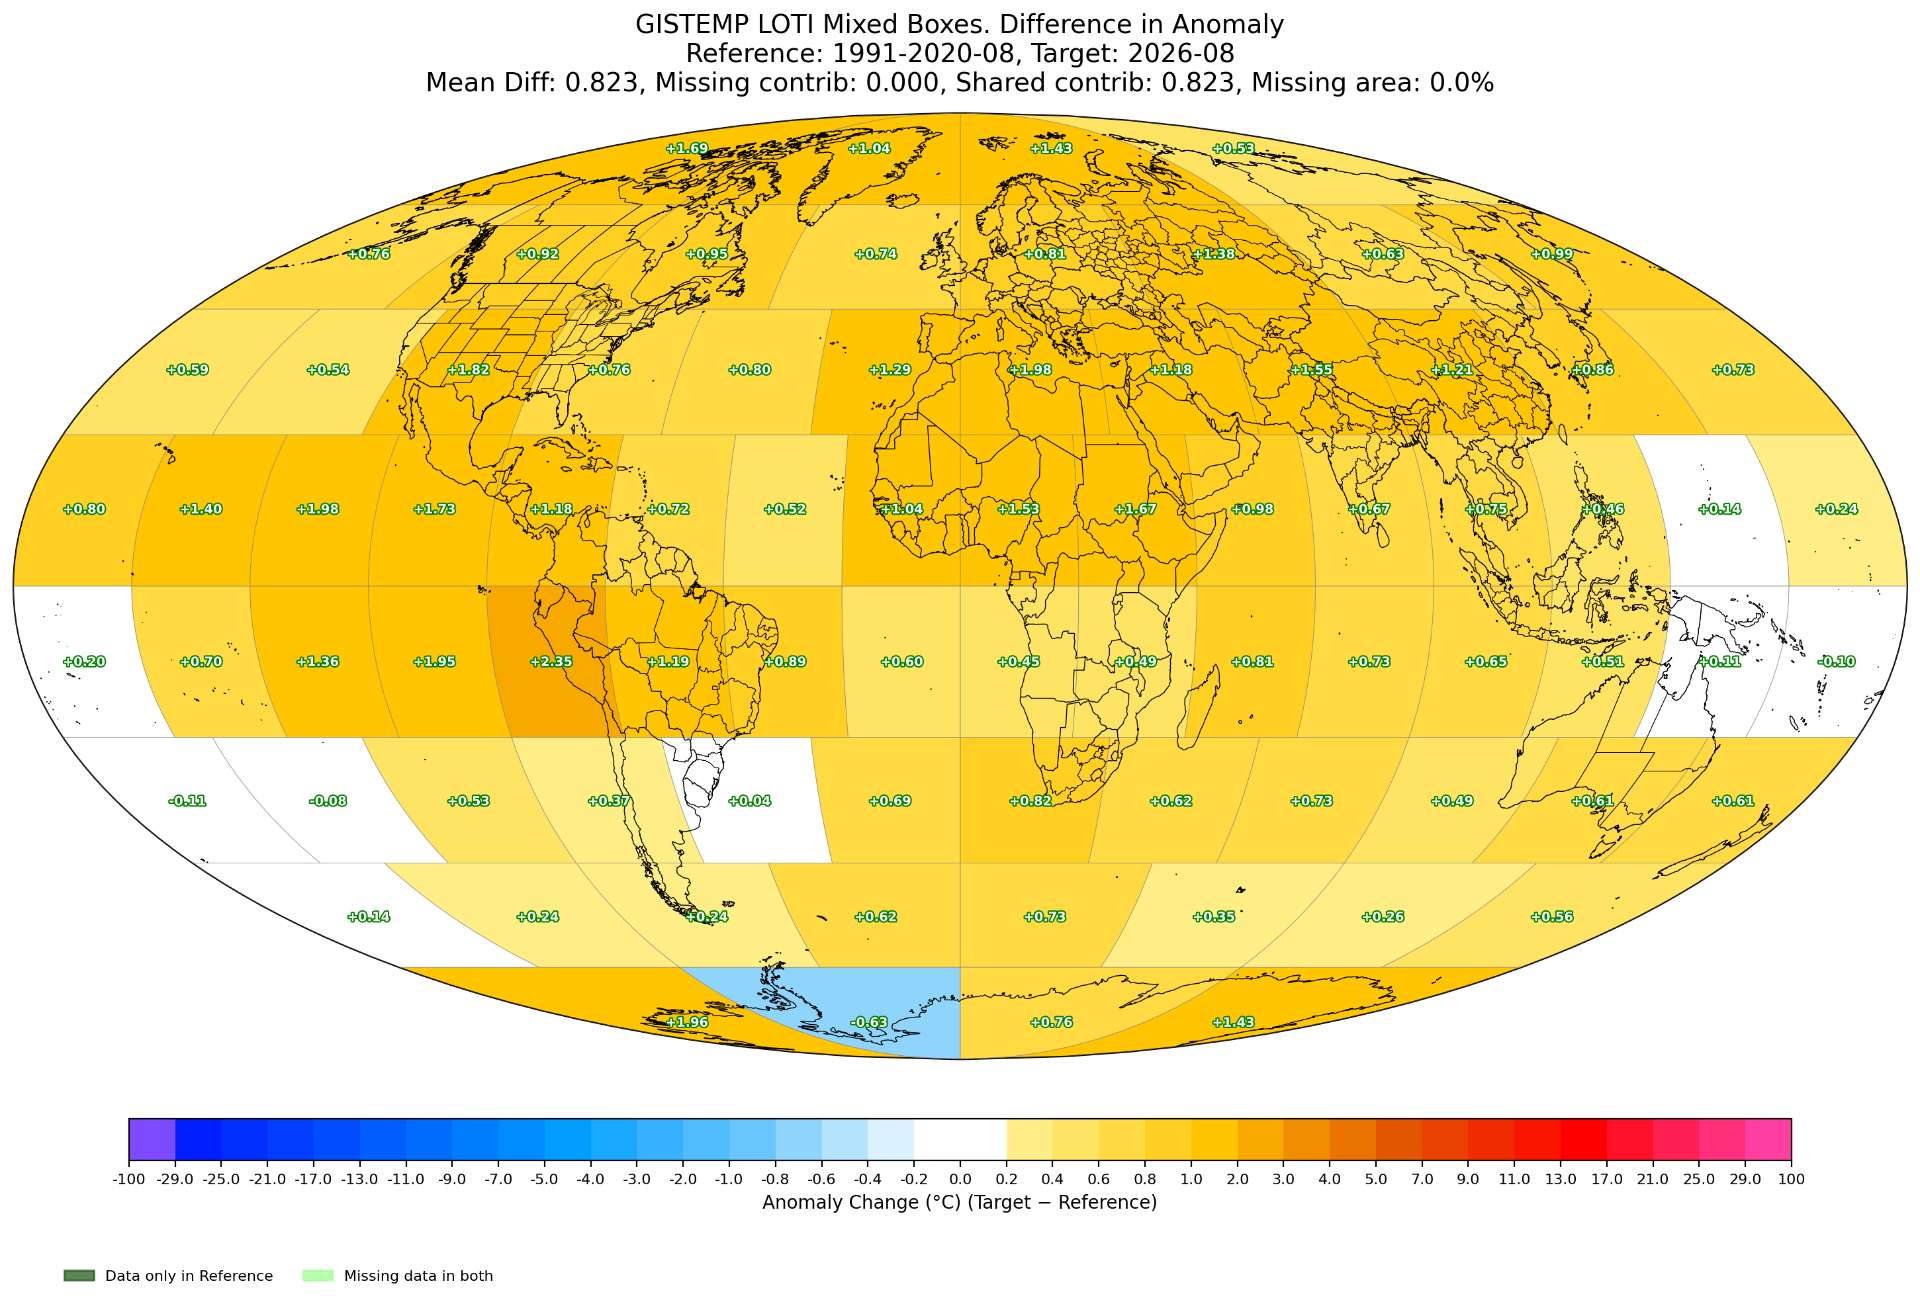
~
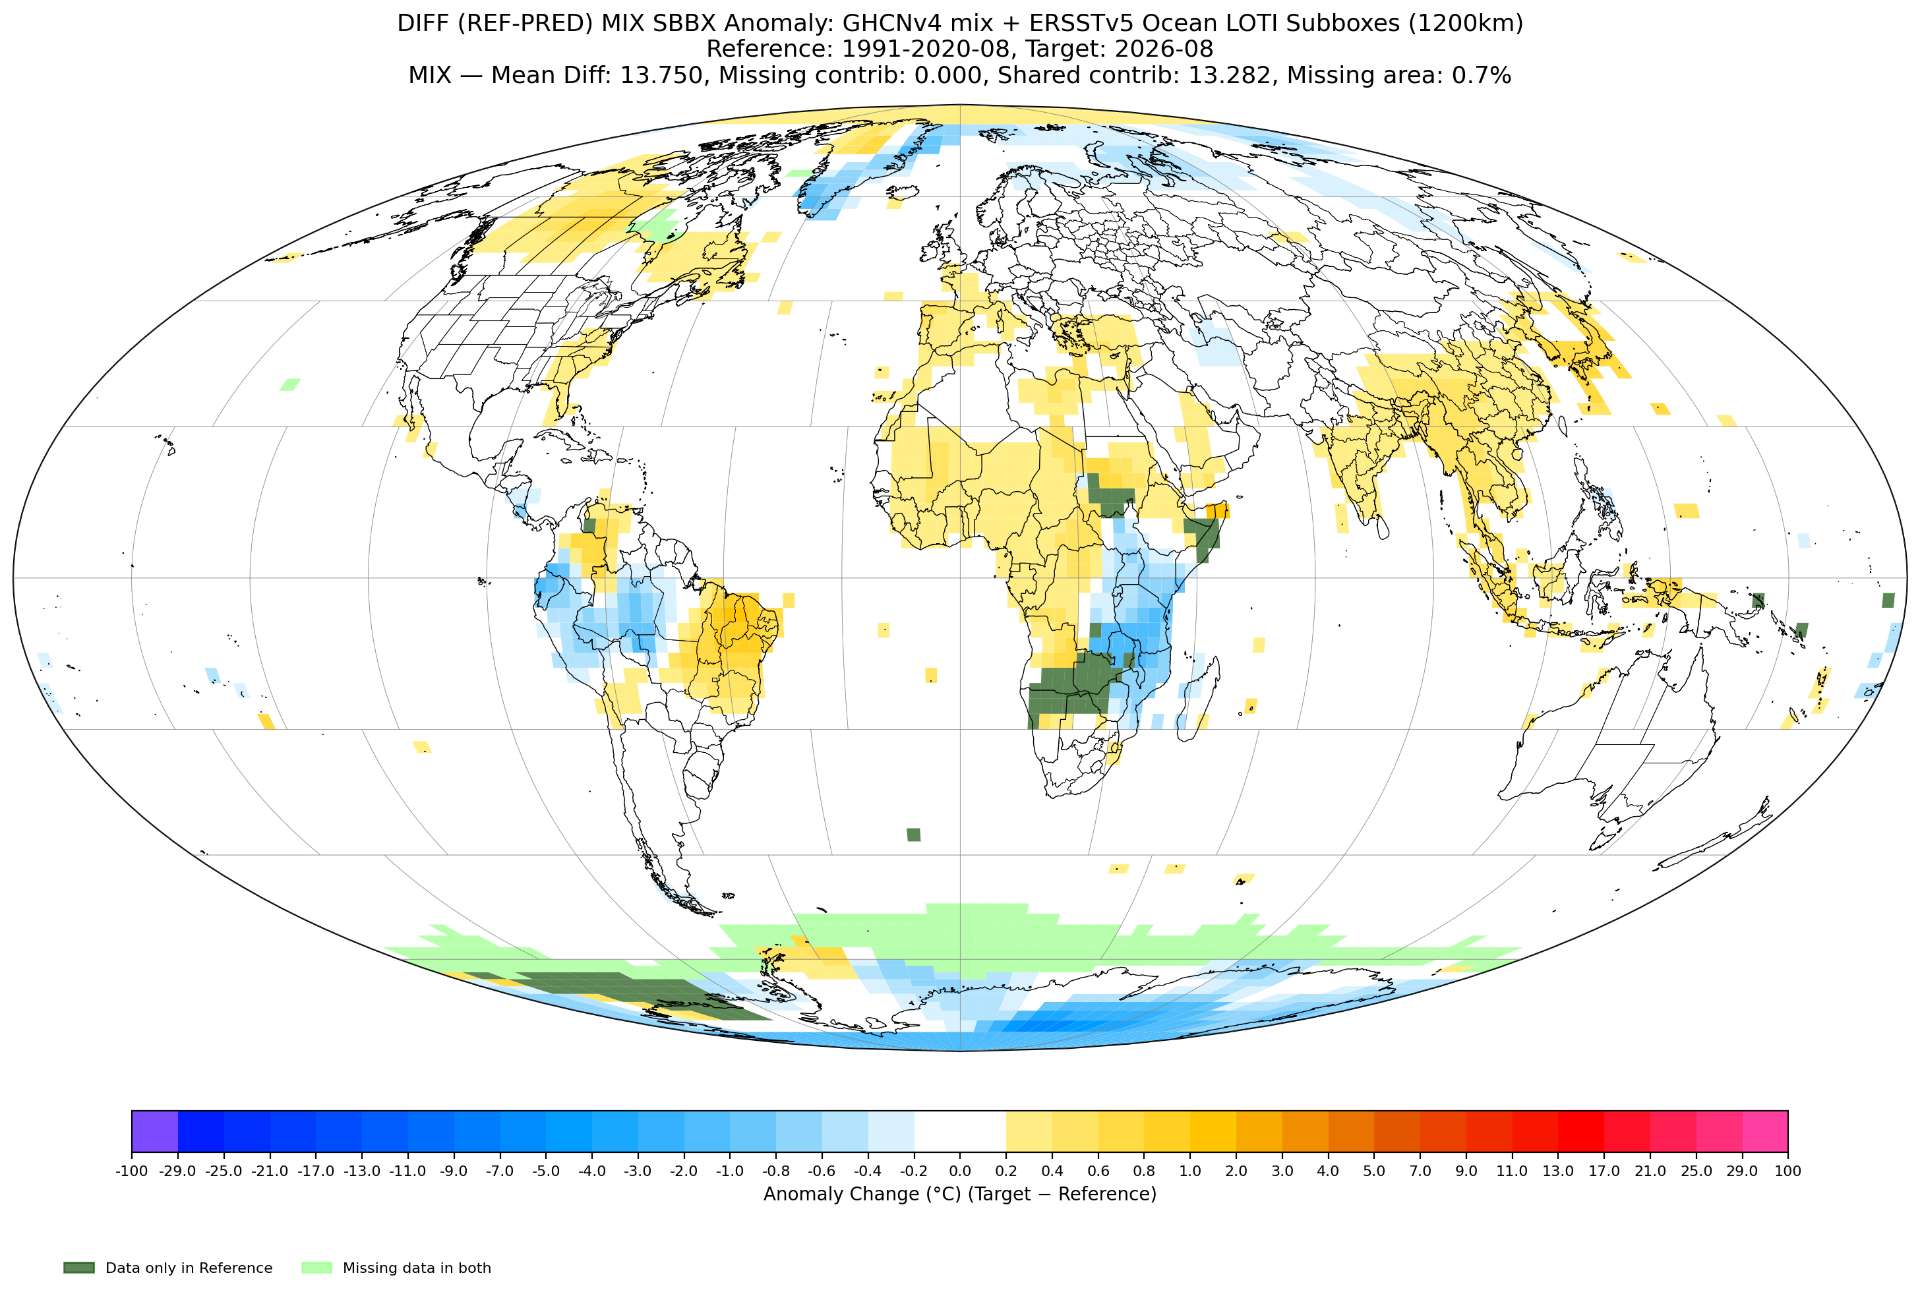
As my station predictions did not include Mozambique it resulted in a significant miss there. Overall the only reason the original predicted value came close to the final value was the positive errors in a few regions (with Antarctica being predicted too warm due to newly added (last 5 years) stations not being bias corrected from climatology) canceled the broad negative errors (model predicting too cool for many stations across China and SE Asia, in Eastern Brazil, as well as parts of Canada and Africa.
Annoying to change all my code back to ERSSTv5... Models have shifted upwards for middle of month last few runs
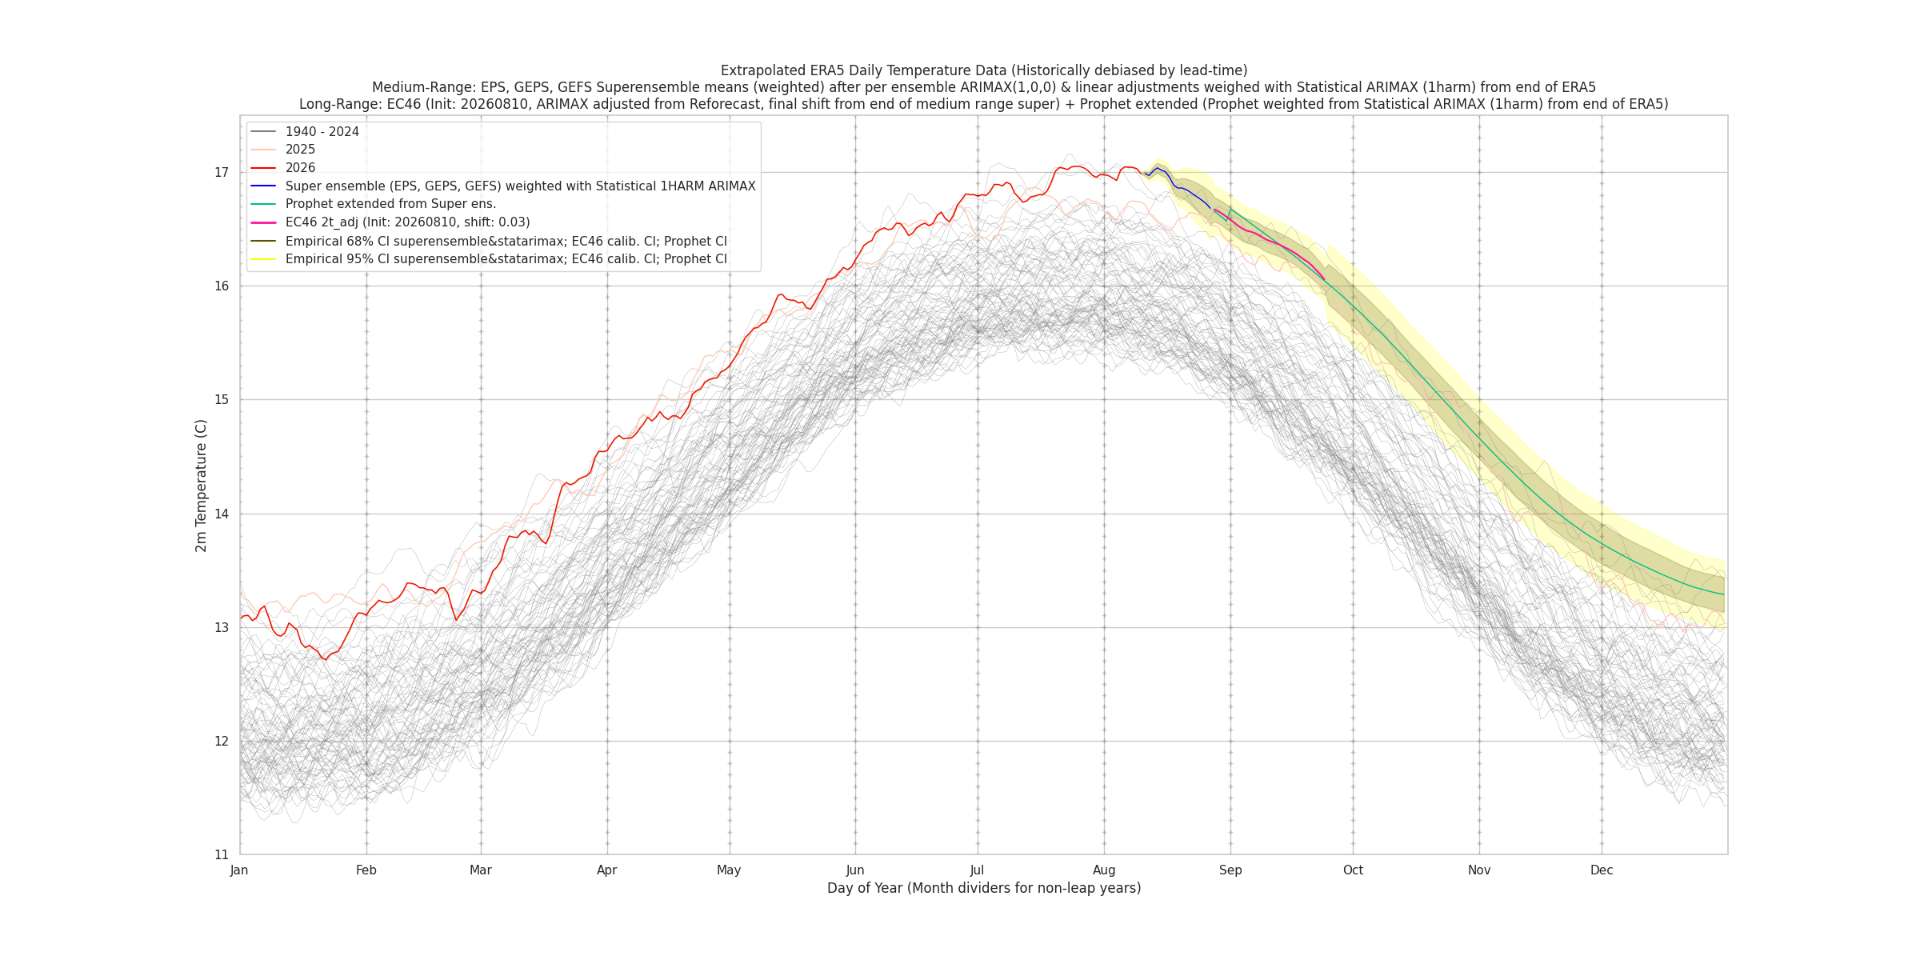
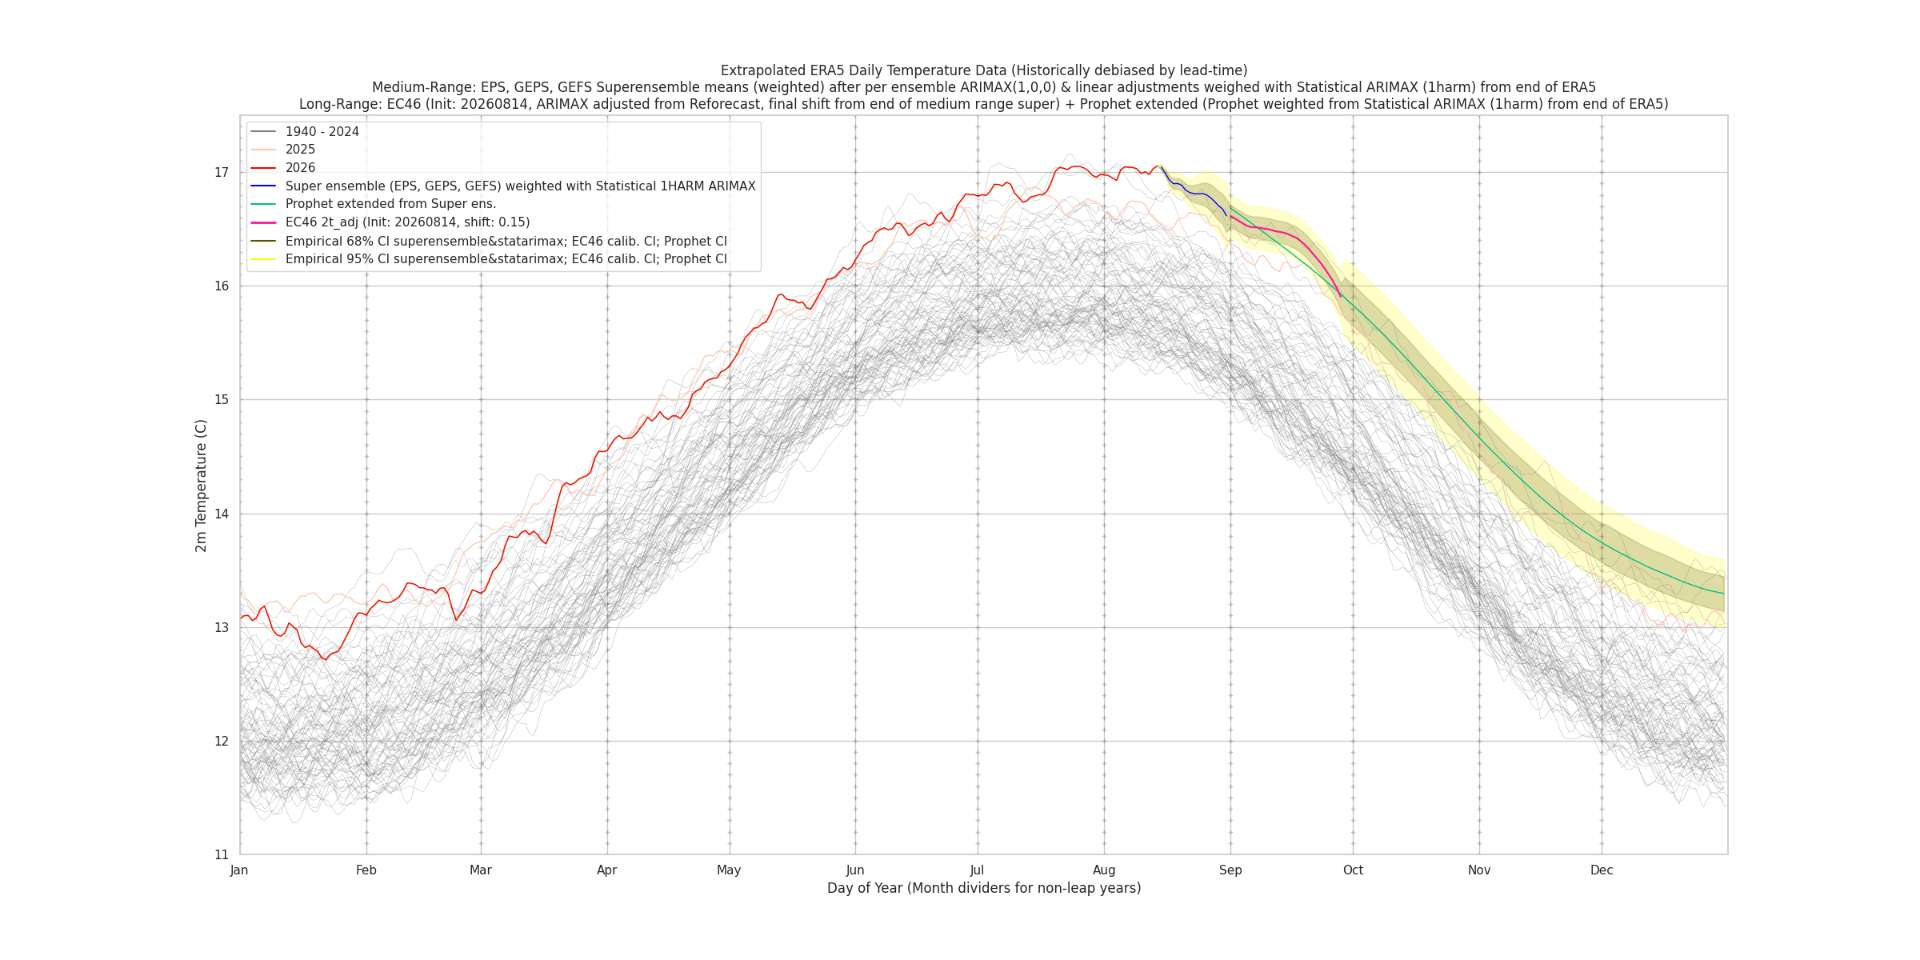
The ERA5->LOTI models are all over the place this early on...
Point estimate (old, delta3 method, analog3 method) adjusted by prediction error mean: 1.4060, 1.2972 1.3439
Point estimate (mix), pre-adjusted by member prediction error mean: 1.3444
With GEFS/GEPS to the end of the month now in, there is still a lot of disagreement still between the 3 methods used for GISTEMP->LOTI, but best guess is with a center point prediction for a LOTI of 1.35 C at the moment.
This is about 0.05 C warmer than the August record of 1.30 C from 2024
~
Point estimate (old, delta2 method, loti3 method) adjusted by prediction error mean: 1.4066, 1.3260 1.3607
Point estimate (mix), pre-adjusted by member prediction error mean: 1.3542
~
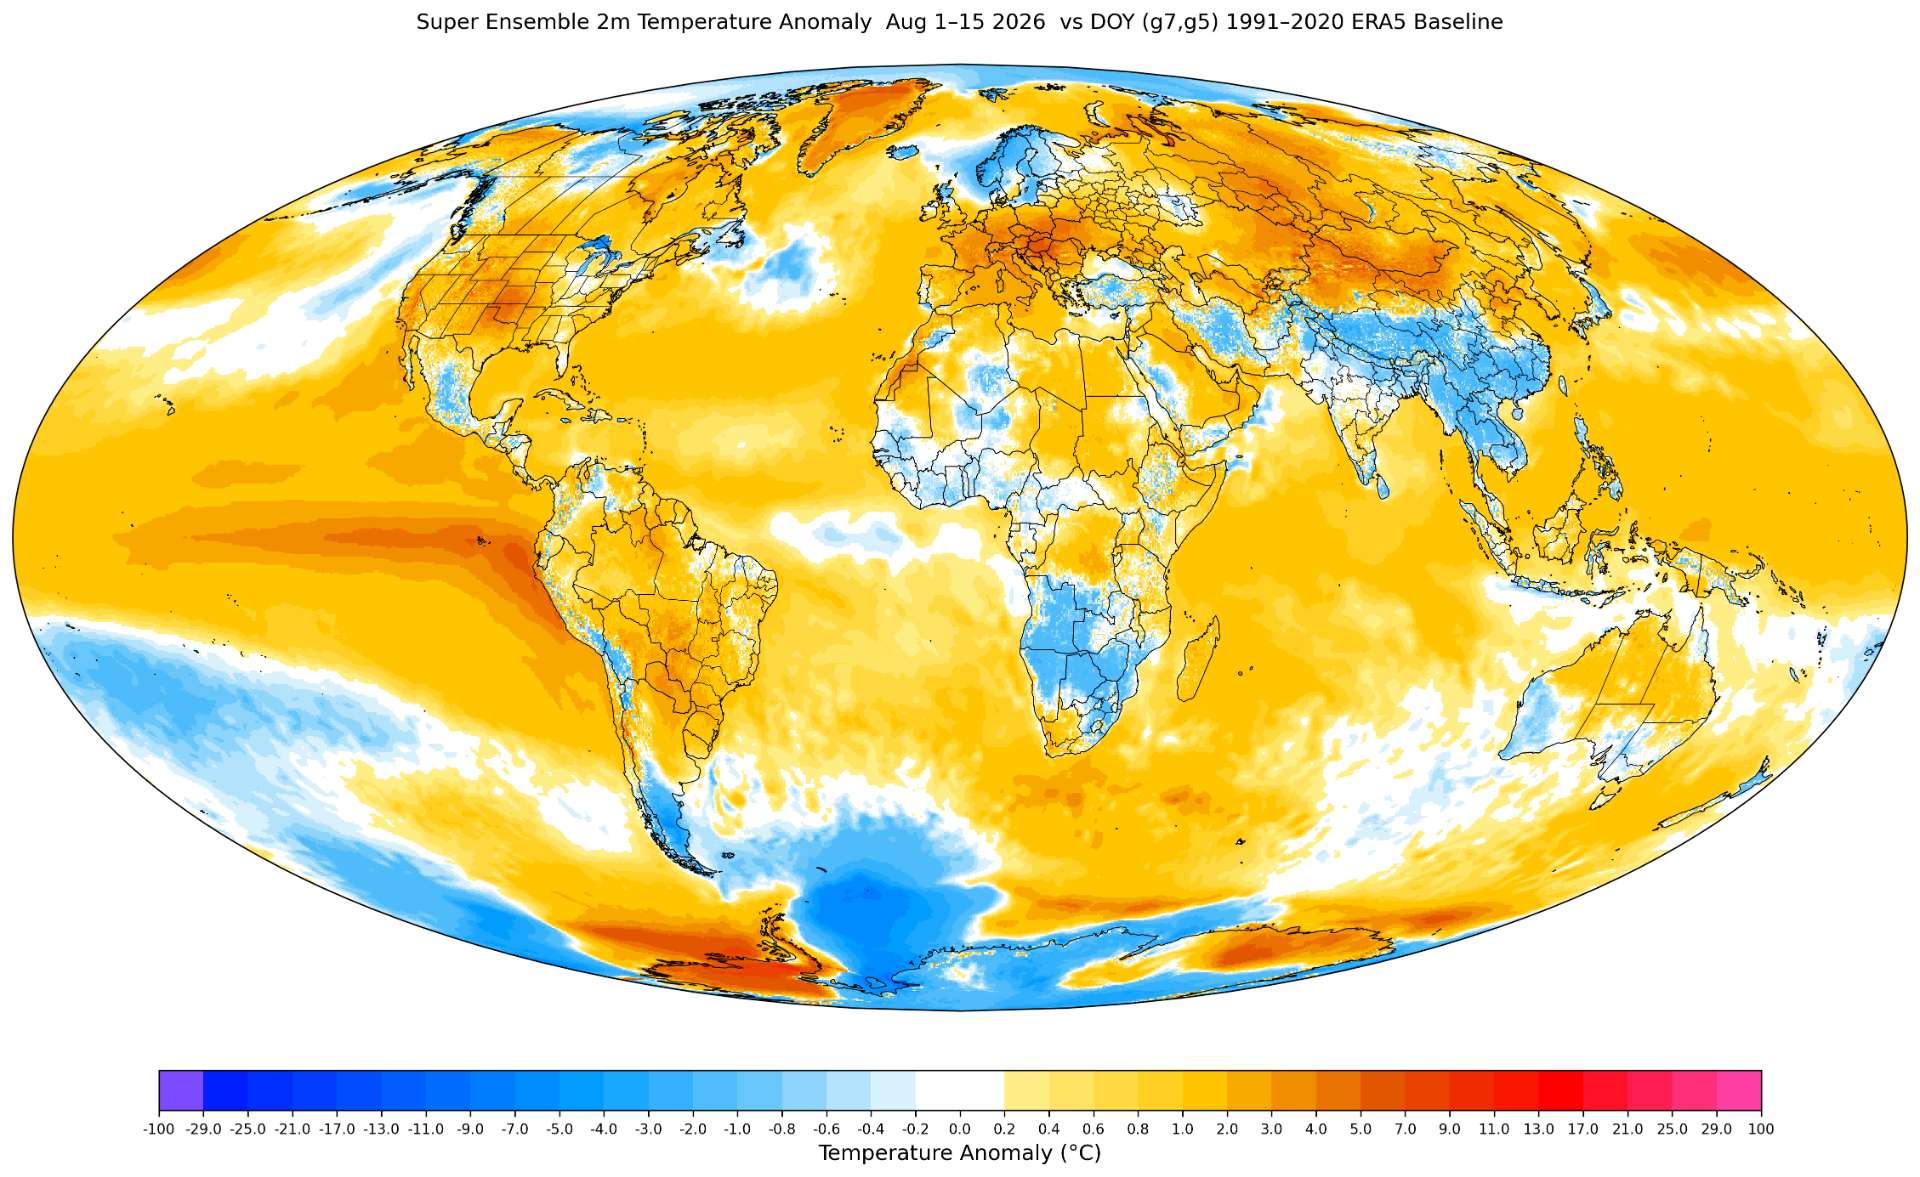
ERA5 + super ensemble anomaly plot for month
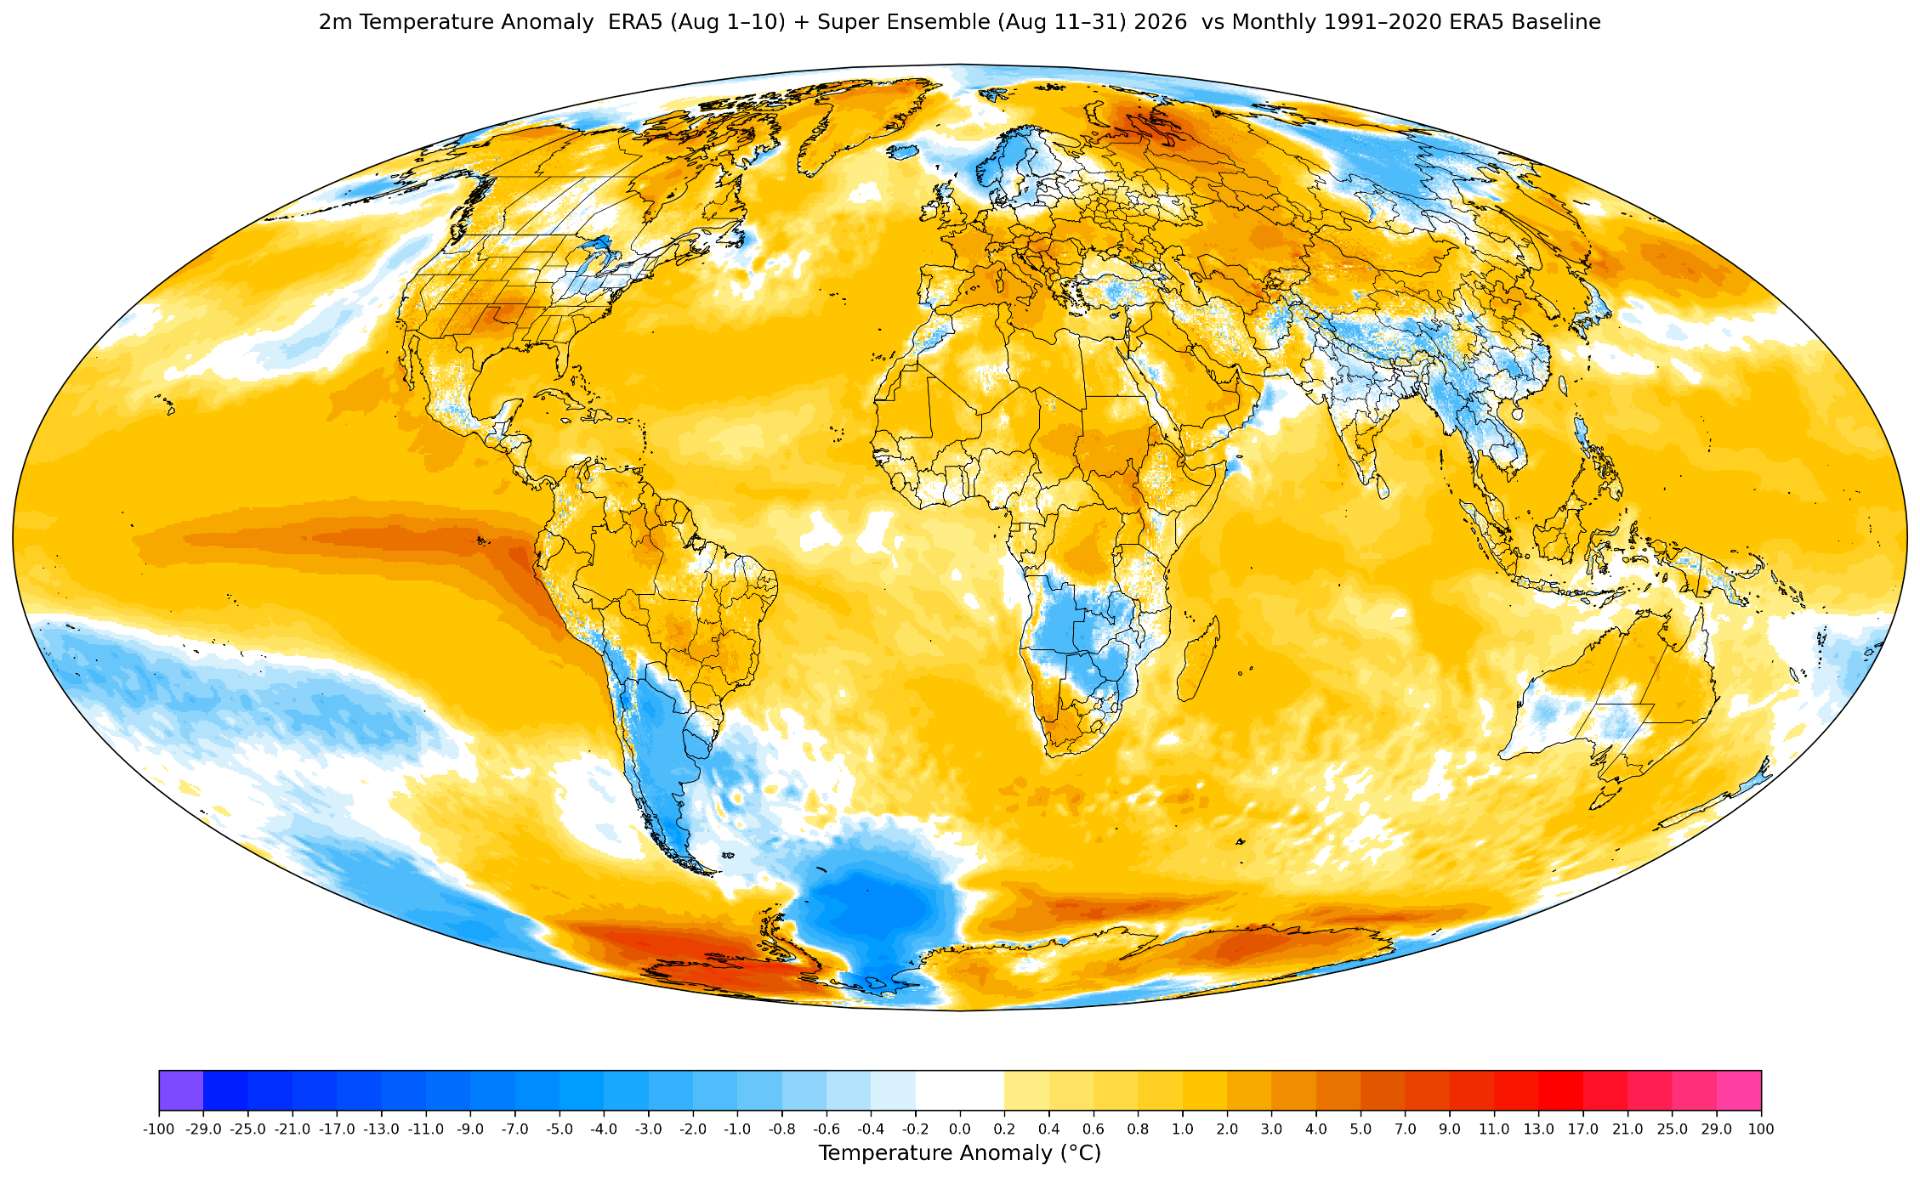
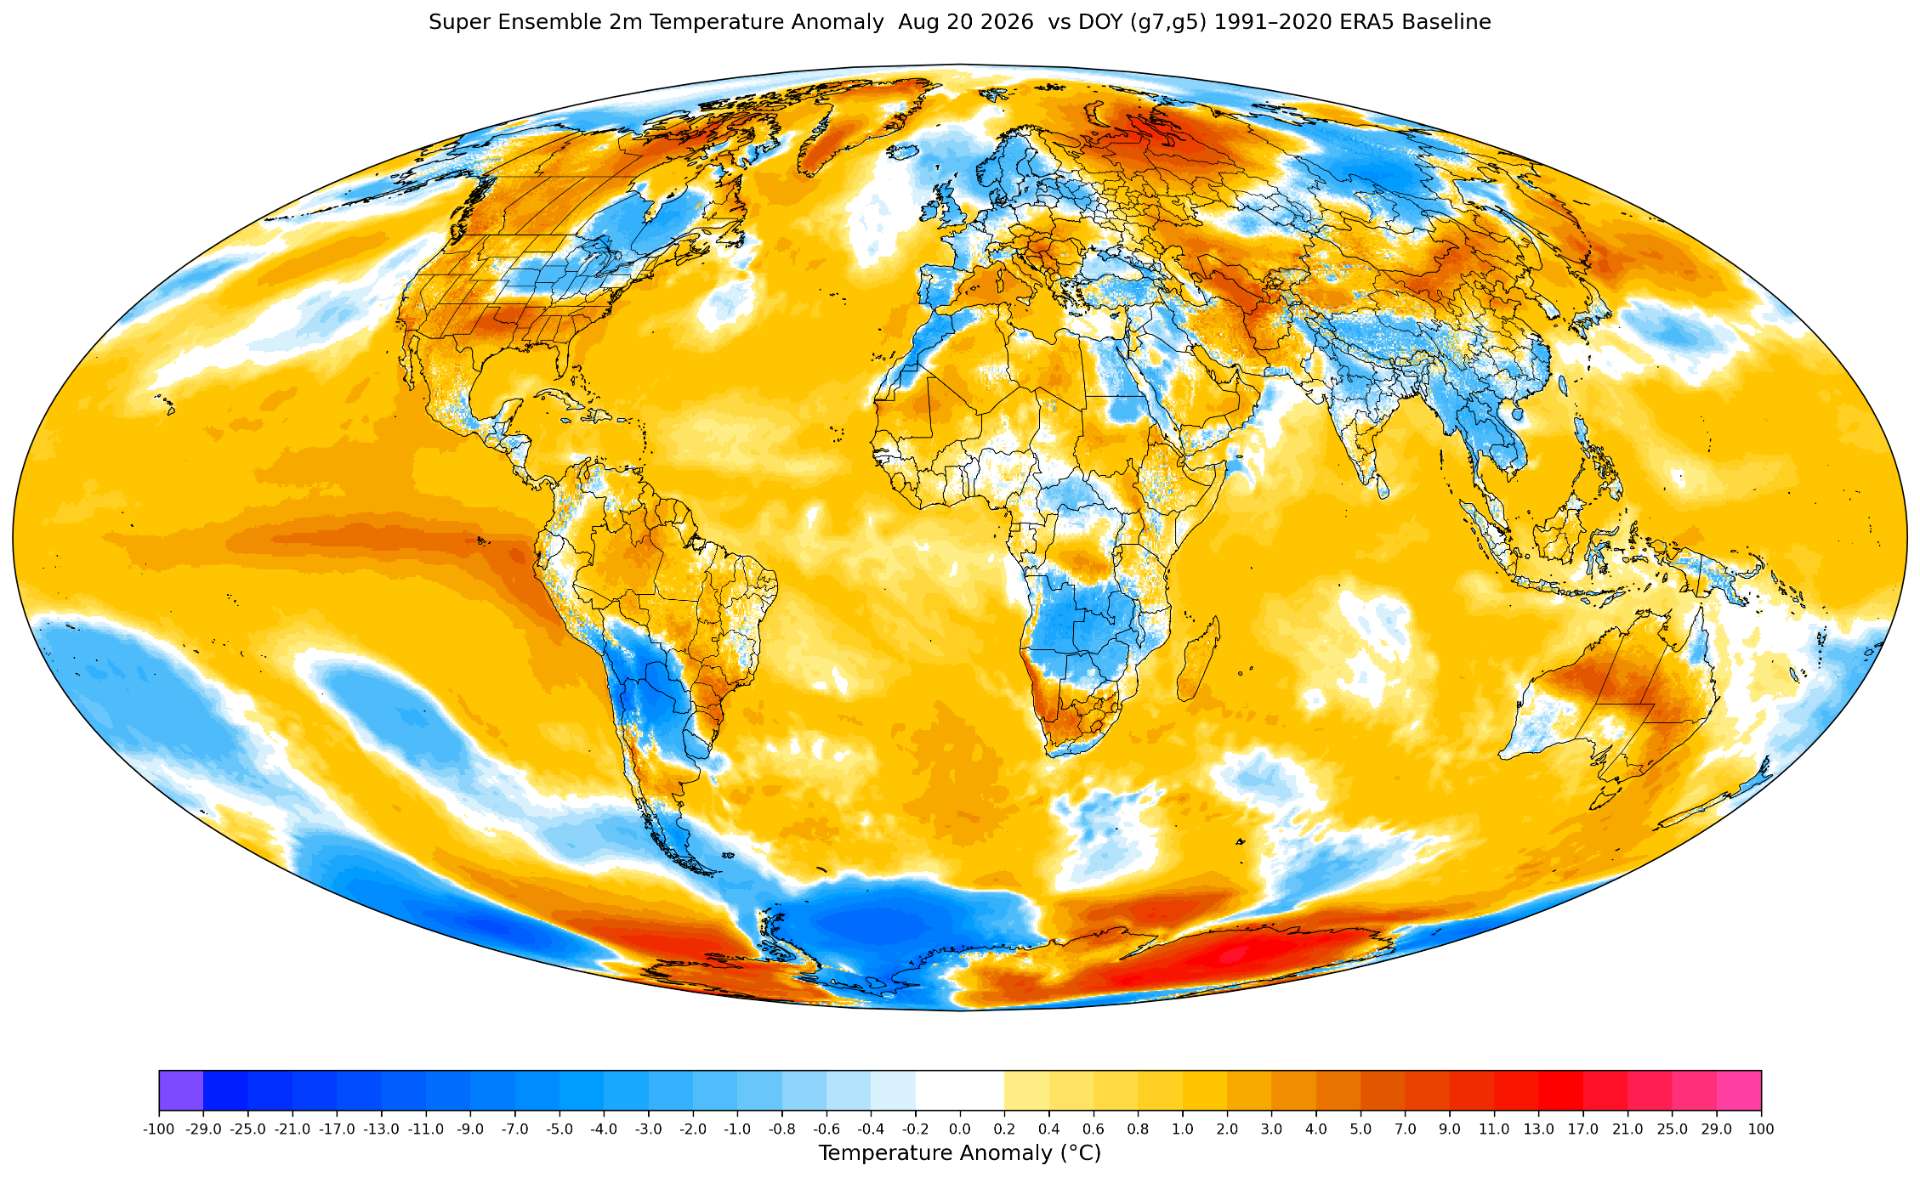
Western Antarctica still looks really anomalously warm, but Antarctica as a whole has gotten warmer compared to the DOY MTD anomaly plot from 16 days ago.
Also, northern Russia (near the Kara Sea) looks anomalously warmer than usual starting from about 3 days ago and all the way in the forecast for about the next 10 days (DOY plot):
Still quite a bit of disagreement but now two are firmly in the 1.345+ bin, making that the most likely at the moment.
Point estimate (old, delta2 method, loti3 method) adjusted by prediction error mean: 1.4337, 1.3209 1.3901
Point estimate (mix), pre-adjusted by member prediction error mean: 1.3666
~
Not related so much to this market, but in SST and related news to the El Niño:
Looking at my SST dashboard for EC46, I note that the daily September forecast for NINO1+2 now looks more like February ...

Some related tidbits I could find on fishery impacts:
https://www.seafoodsource.com/news/peru-ends-north-central-anchovy-season-after-lengthy-pause
This after a short observational study was done this last week where "the good growth status of anchovy was confirmed.":
Some more (dated) global context articles (the impact is global as it ends up in fishmeal and fish oil products):
Although the anchovet growth is described as good'' I do wonder in the next few months what will happen...
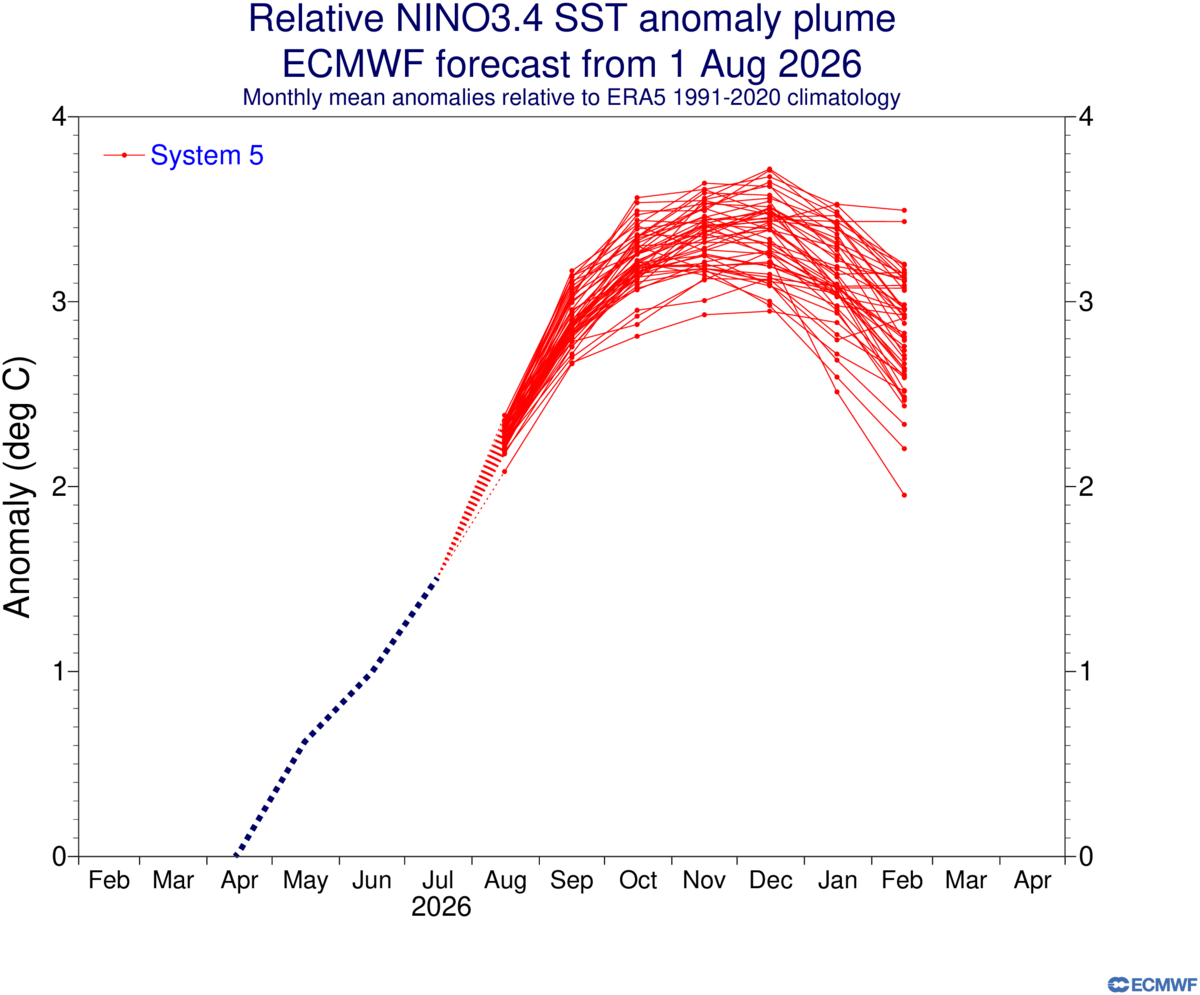
latest ECM NINO plumes out -- OND got revised upwards AGAIN, and spread is a lot tighter.
~~~
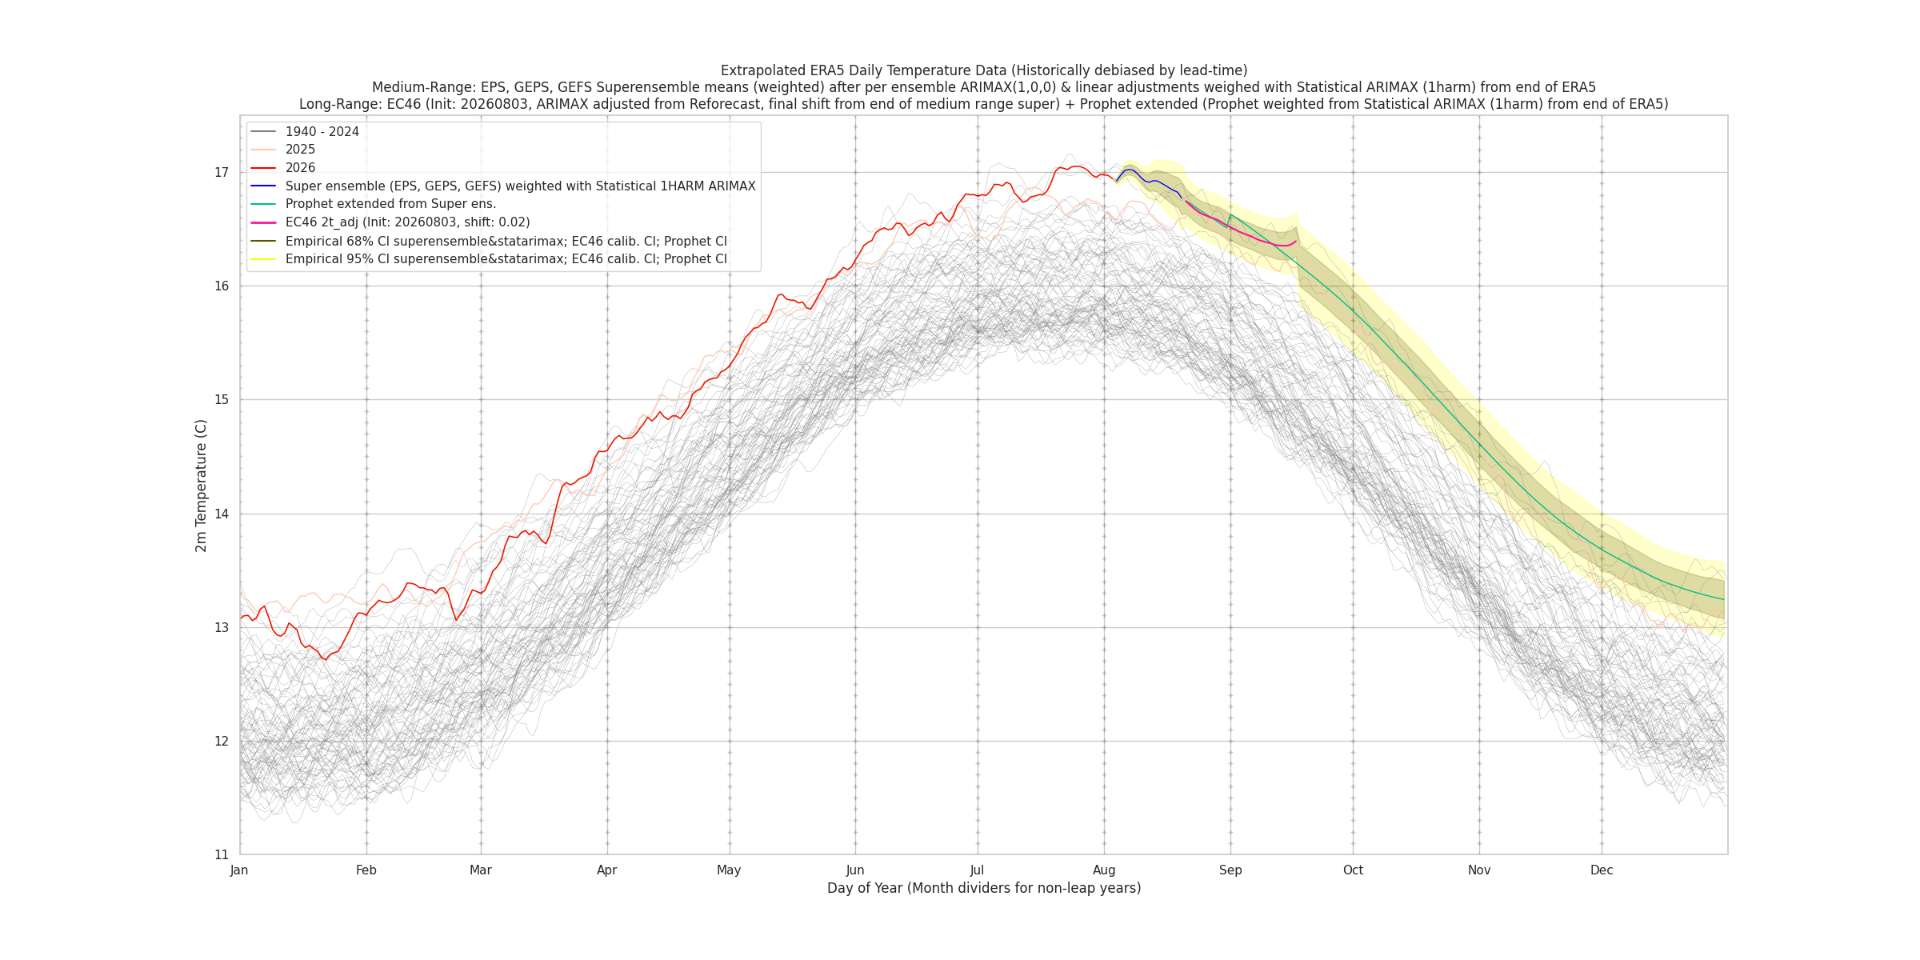
(Note only month of interest (August) is adjusted statistically (past errors & statistical mode))
The weighted with the simple statistical (harmonic) model (above) is bringing the (unweighted by statistical model) super ensemble (below) quite a bit lower ....
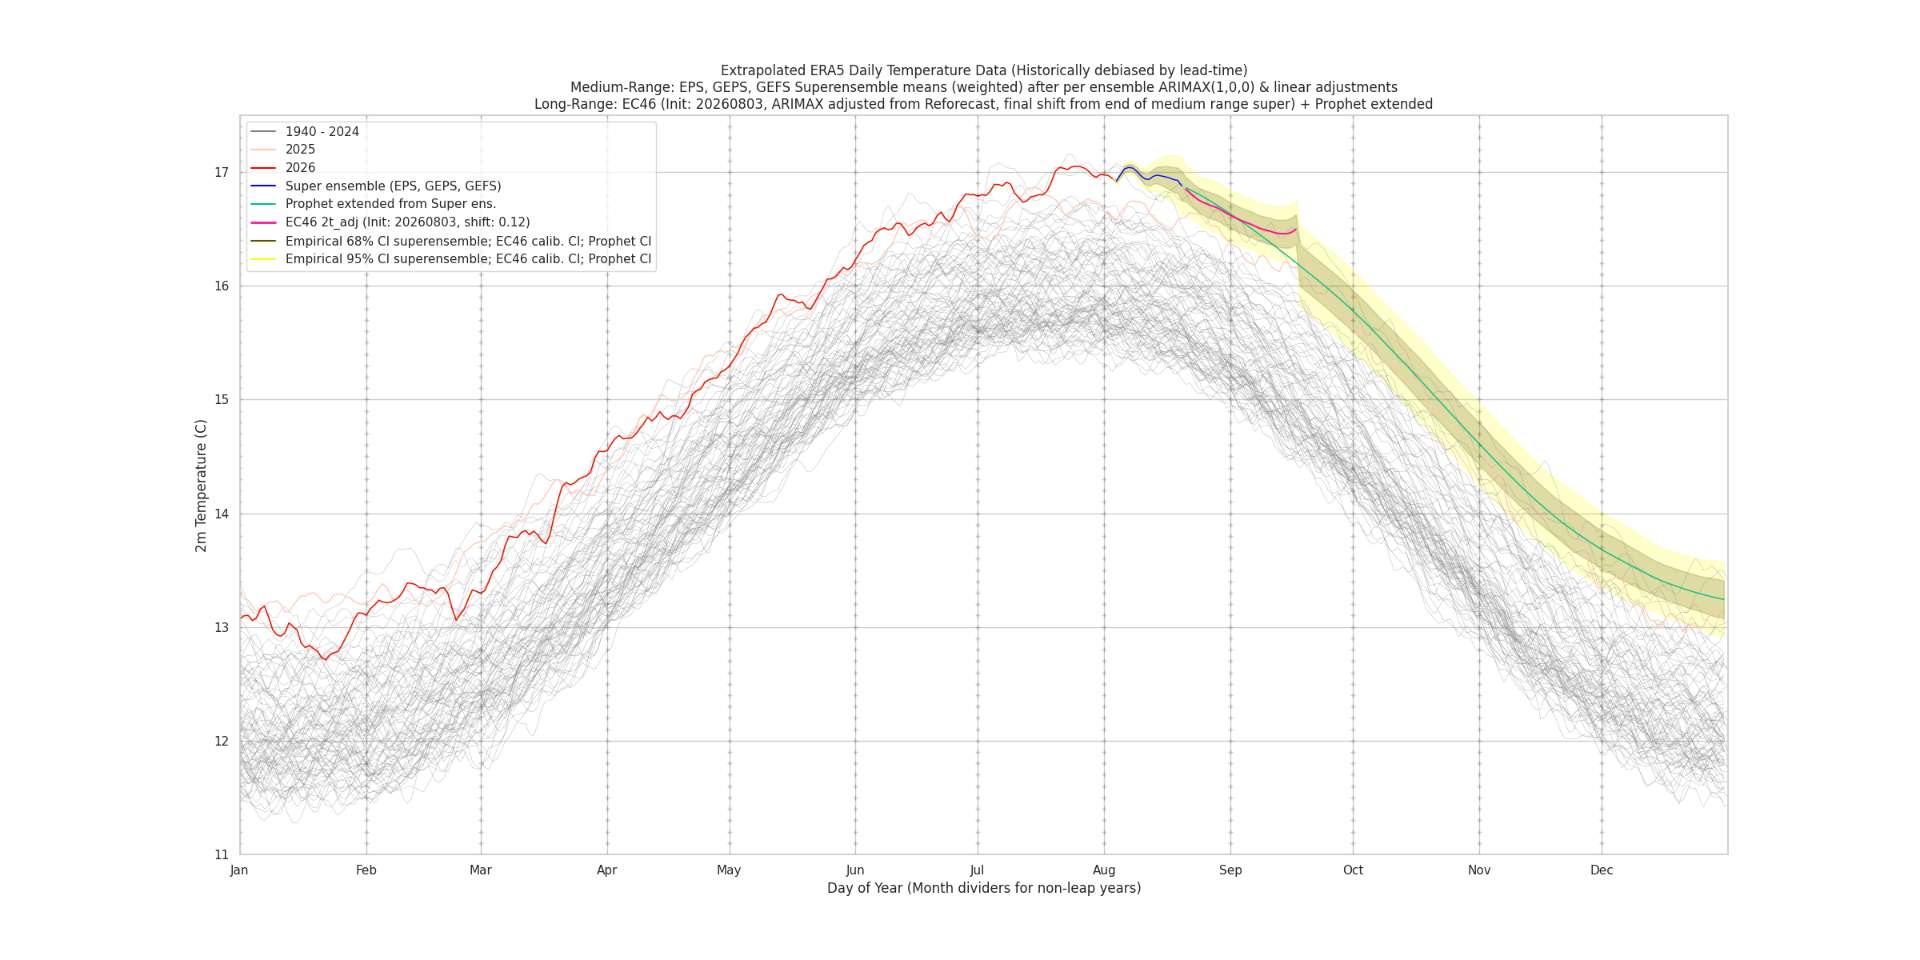
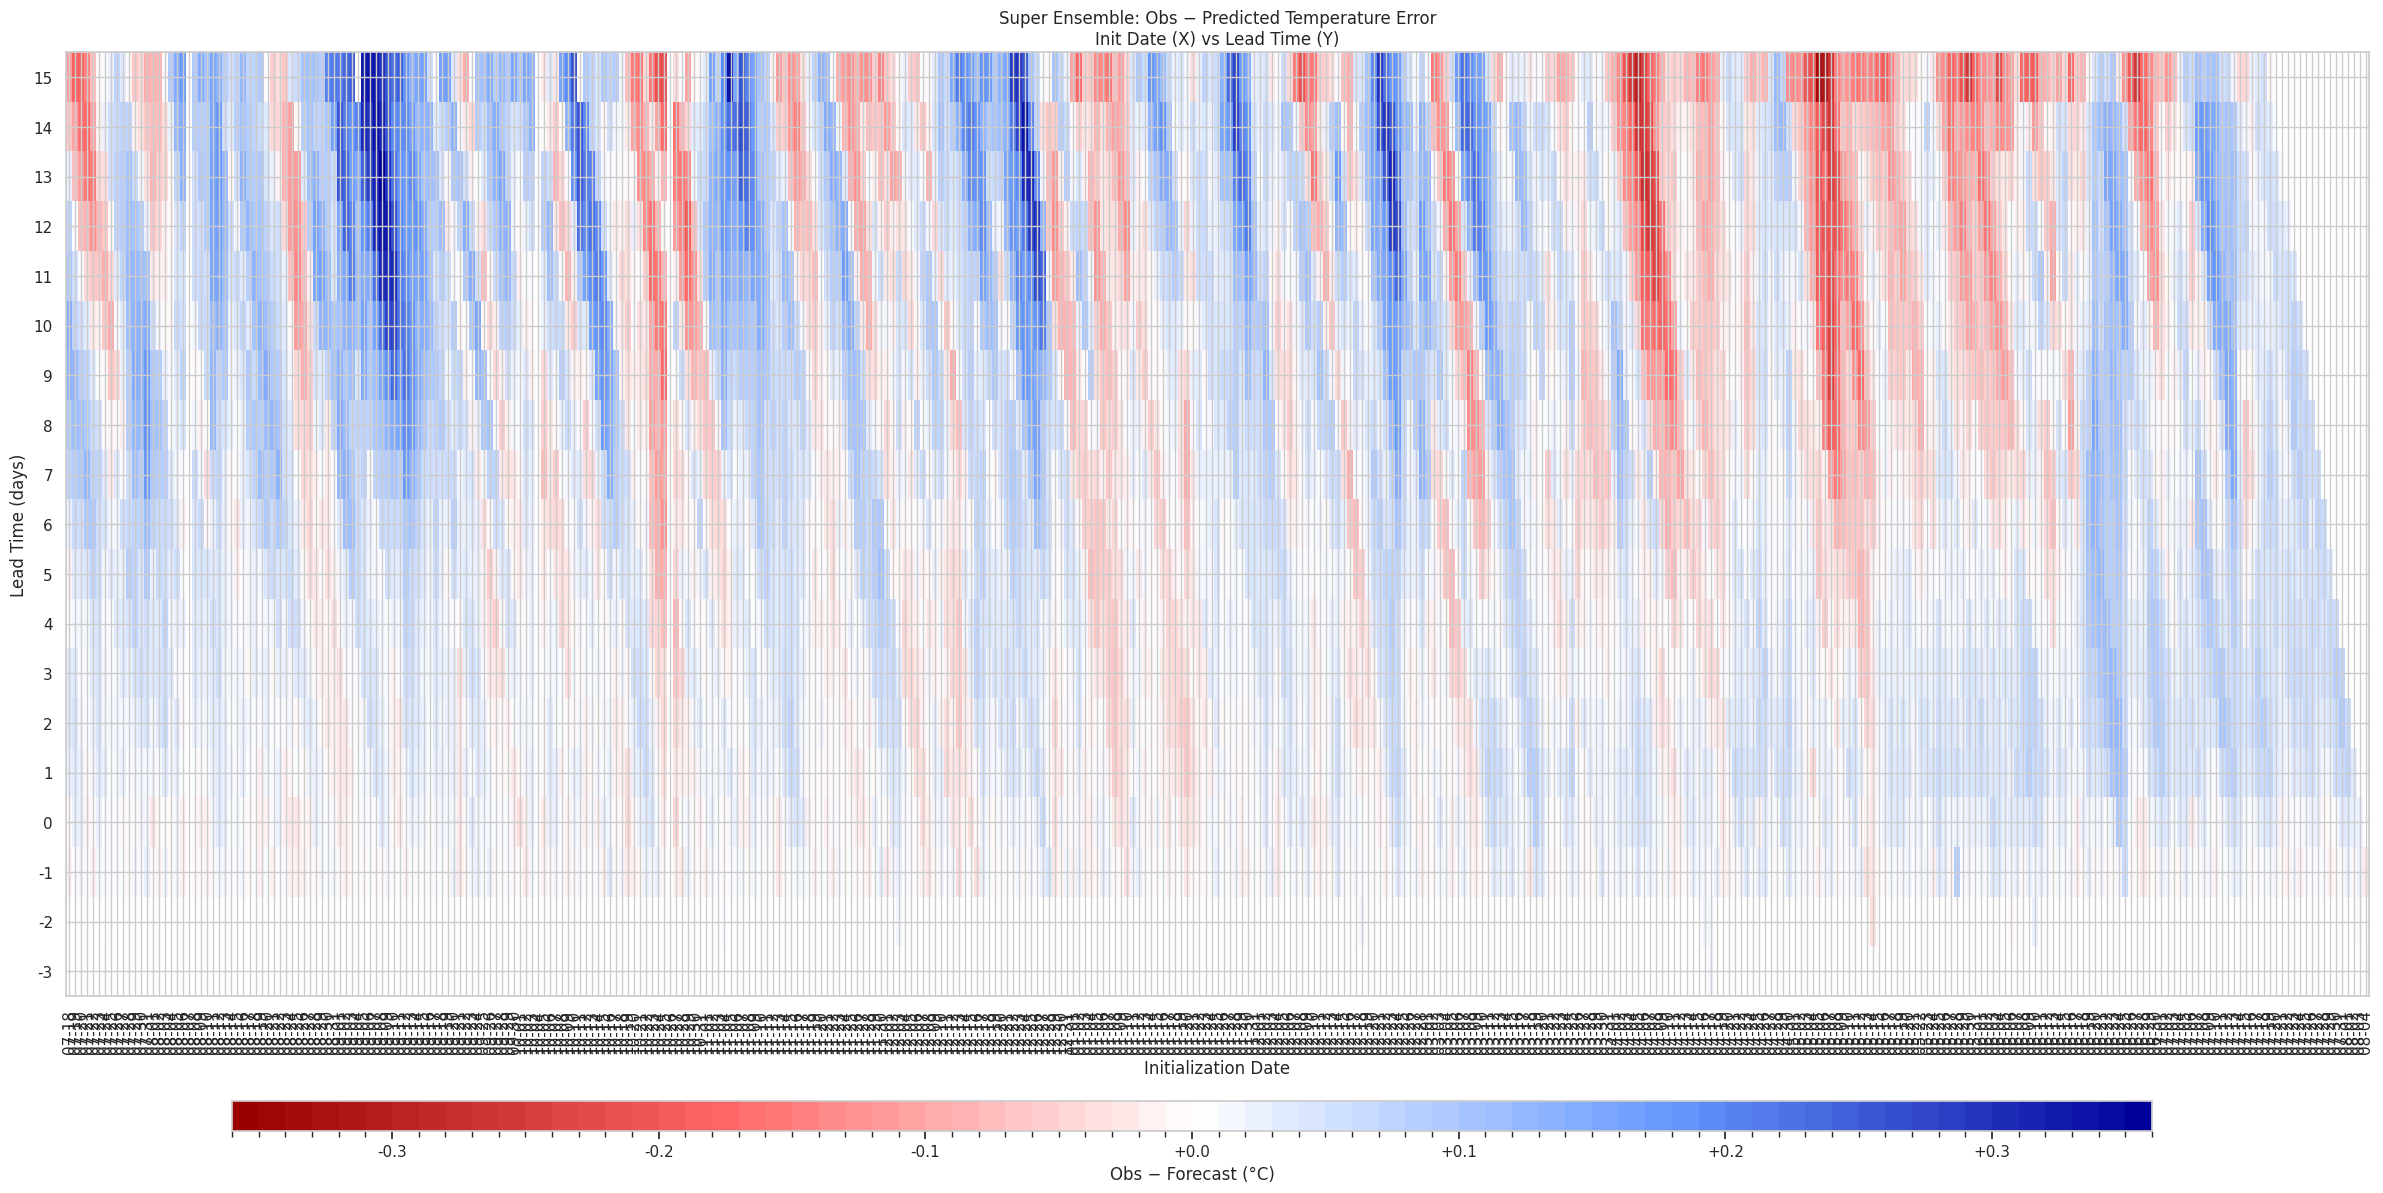
Superensemble was biased warm May-June at end of warm of medium range, now it looks like possibly its gone back to being slightly cool (at least temporarily), but not sure about the increased cold bias in first 10 days of forecast period since end of June.
~
On top of this the range of the output for the 3 methods is very large (old model looks really bad though):
Point estimate (old, delta3 method, analog3 method) adjusted by prediction error mean: 1.3964, 1.2709 1.3001
Point estimate (mix), pre-adjusted by member prediction error mean: 1.3141
(stddev of 0.784 this far out, with the three methods as an ensemble).
===
Reaching as high as a +6 or +7 C anomaly for Elizabeth in Antarctica next week.... East Antarctica also getting some large warm anomalies end of next week.
Kansas (and Oklahoma) still looks anomalously warm next week ....
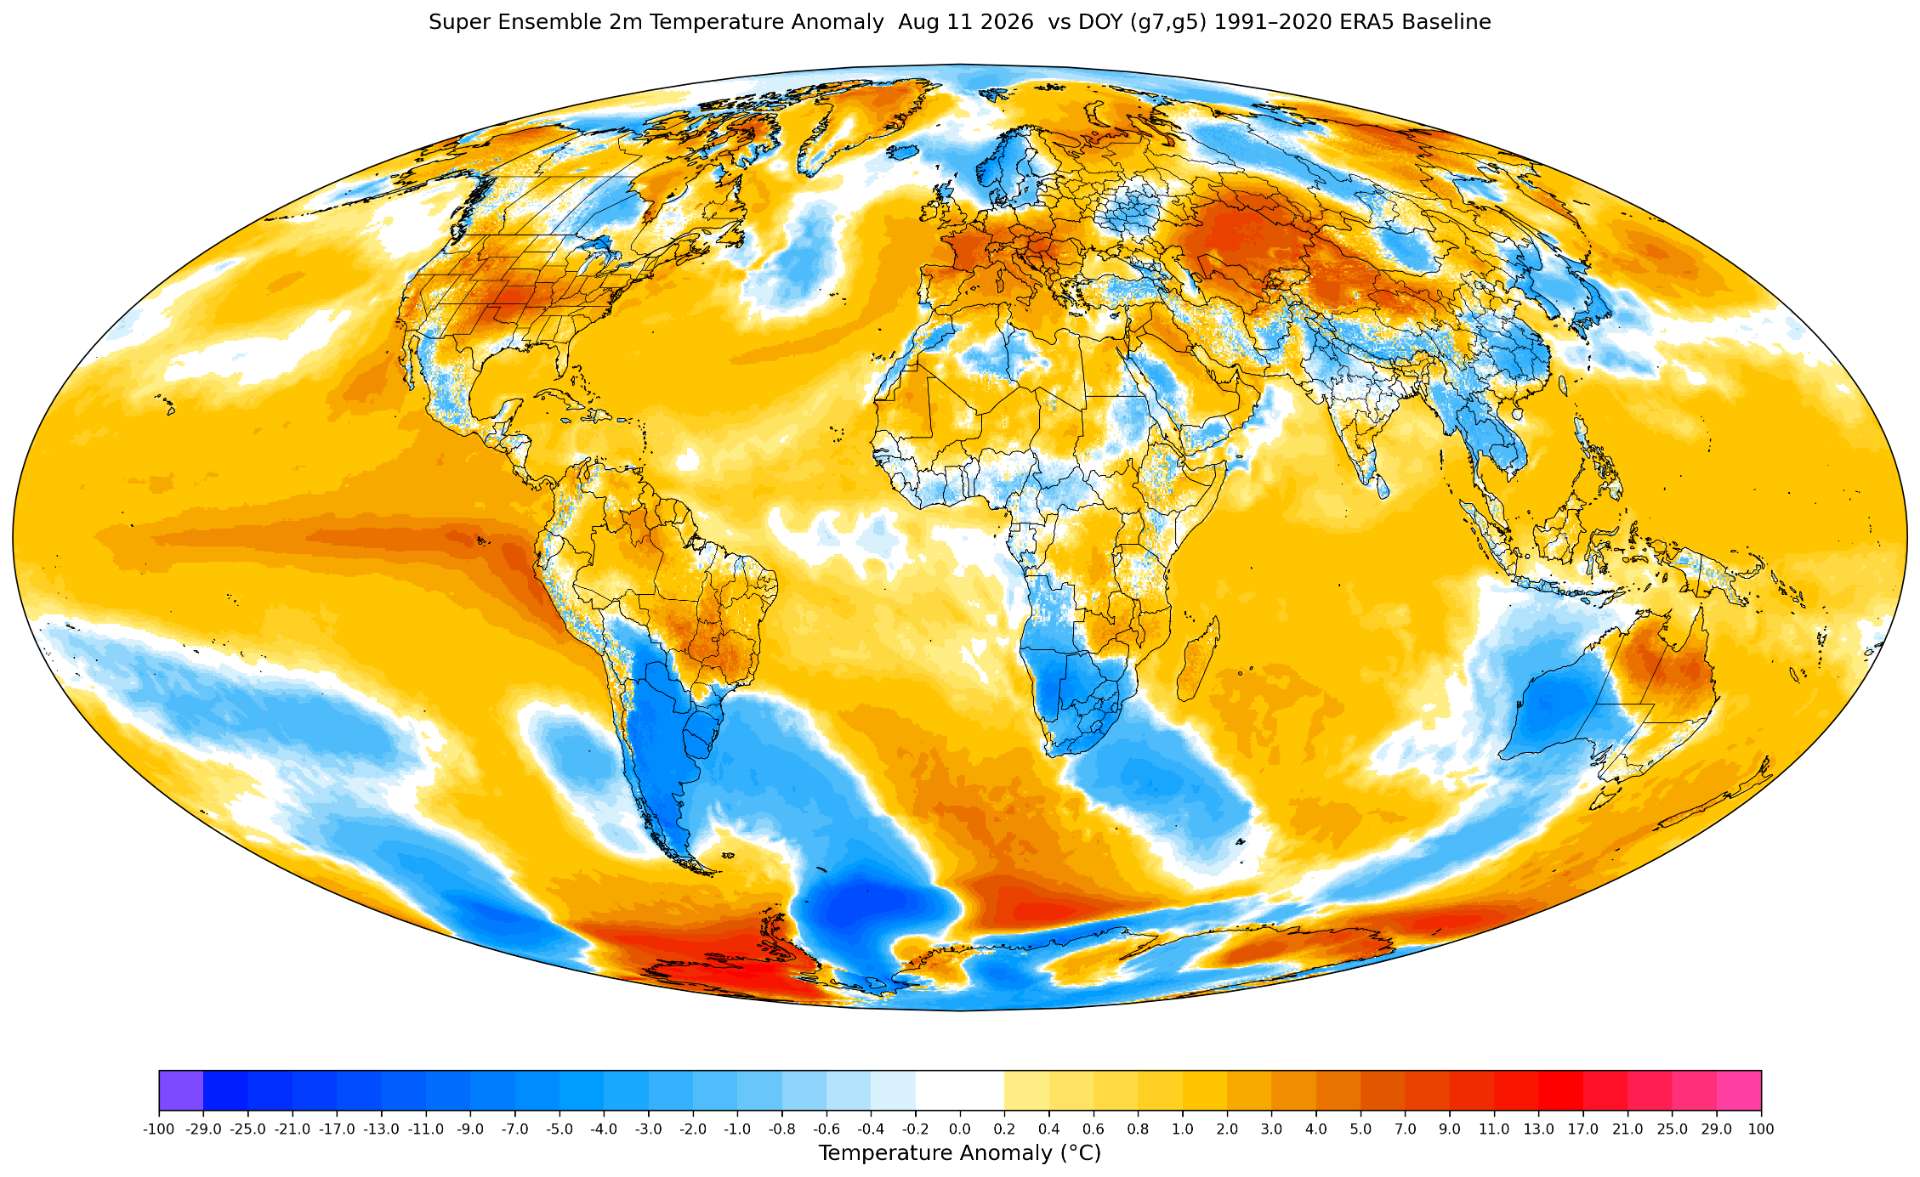
Checking my email I notice that ECMWF is going to eventually disseminate (Oct+?) for money the gridded ERA5T NRT (I assume it will be the one you see calculated on copernicus daily that many use? So even if its NRT perhaps it will only be lagged 2 days instead of 5 -- or could be even earlier):
"
We are working on adding two new datasets to the ECMWF real-time catalogue and to dissemination via ECPDS for a fee. We expect these to become available from early Q4 2026.
ERA5T (class=ea, expver=0005): the preliminary, near-real-time version of the ERA5 reanalysis. The plan is to offer the same parameter set as on the Climate Data Store (single levels, pressure levels and model levels), starting with hourly data and adding monthly data later. The existing five-day embargo will apply at launch, and the model name in the file-naming convention will be ifs-era5t.
"
(people on polymarket that actually spend real money on these markets will probably end up subscribing.)
~~
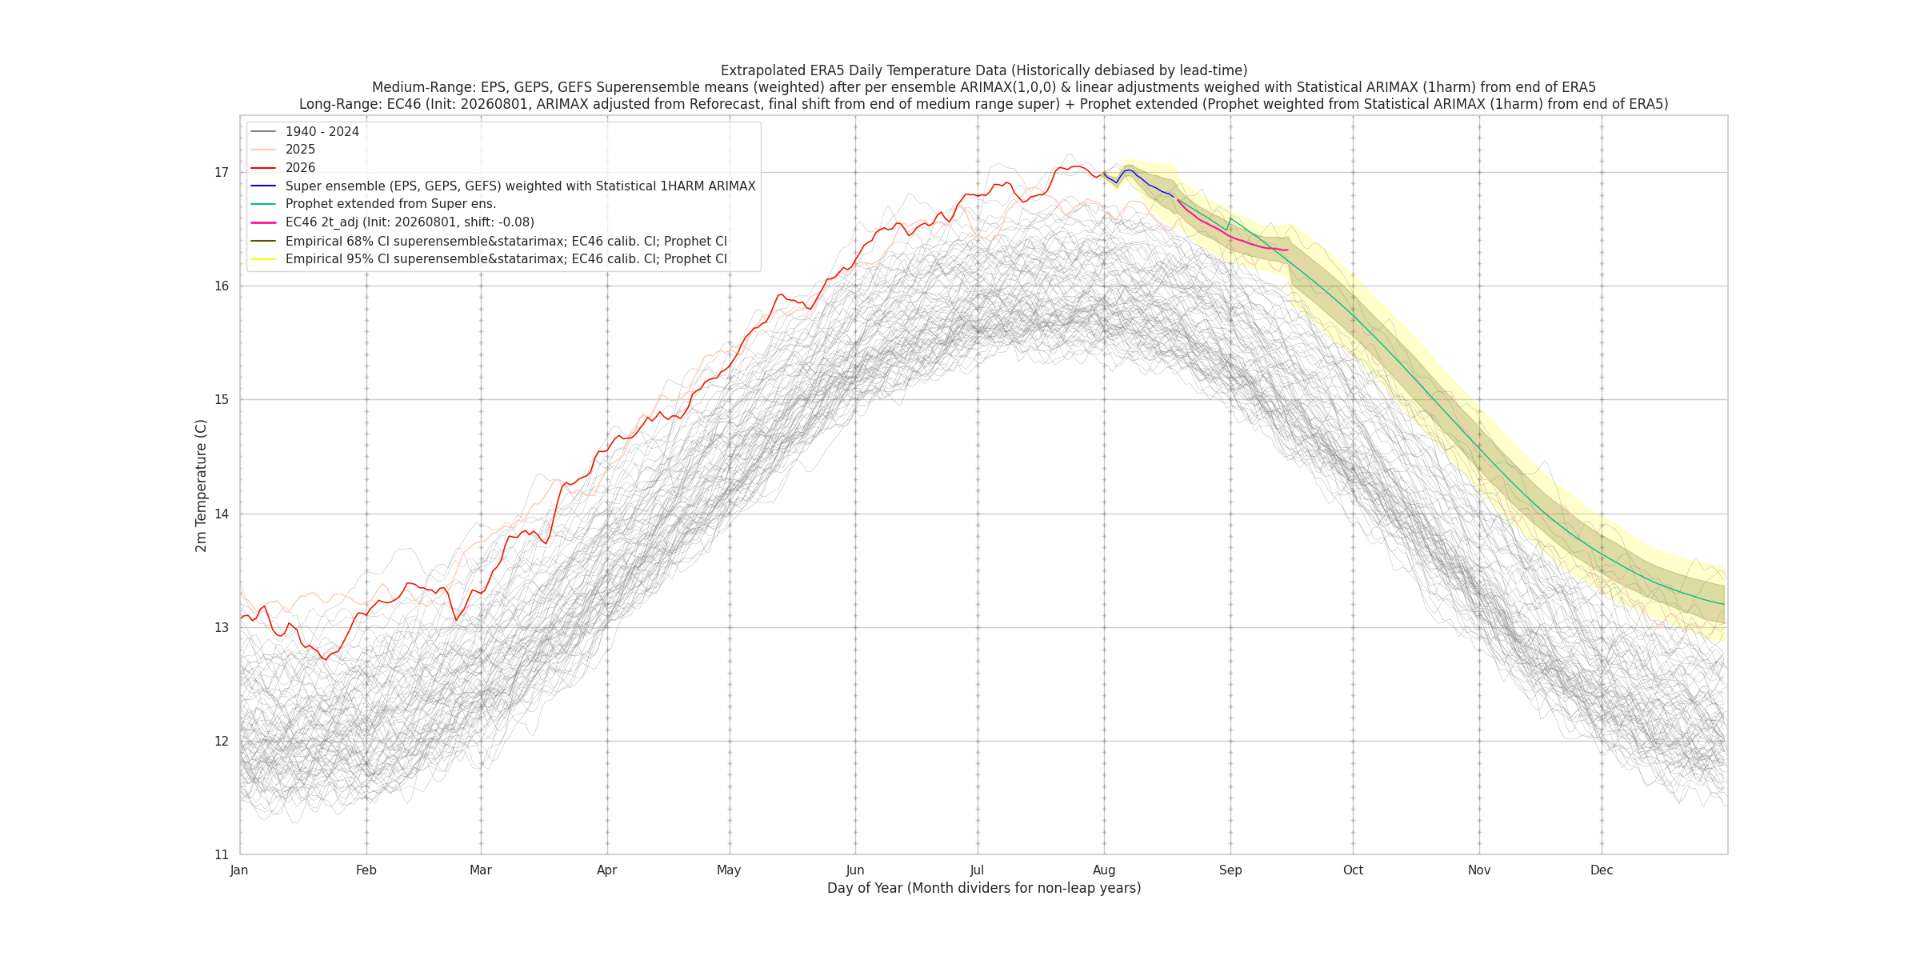
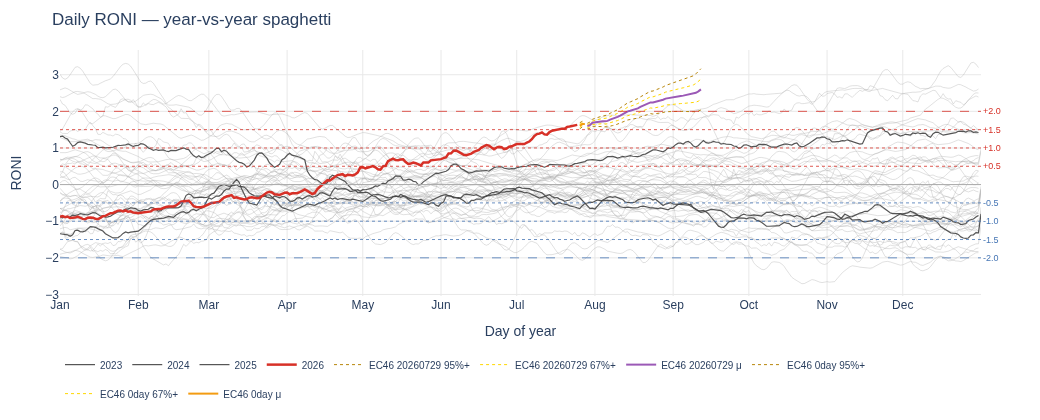
tau=0 for RONI (from NINO4 anomaly looks like) for Aug 1 (two days ago) has shifted upwards .(a decent +0.17 C jump in the daily RONI from the day before) (should be able to see this in ERA5 in a few days ...) -- but this puts us slightly above 1997 now (no longer crossing it) and the mean stays above for the rest of the period. Seasonal plumes in ECM in couple days should be interesting if this holds ....
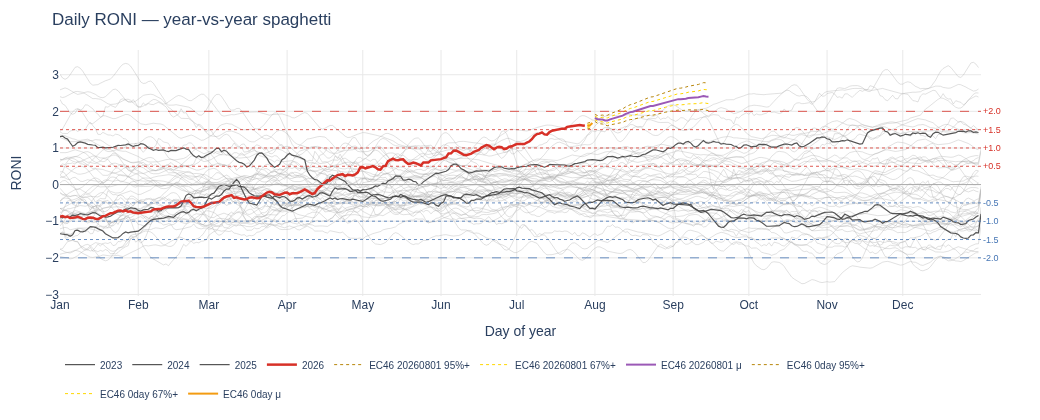

charts/plots:
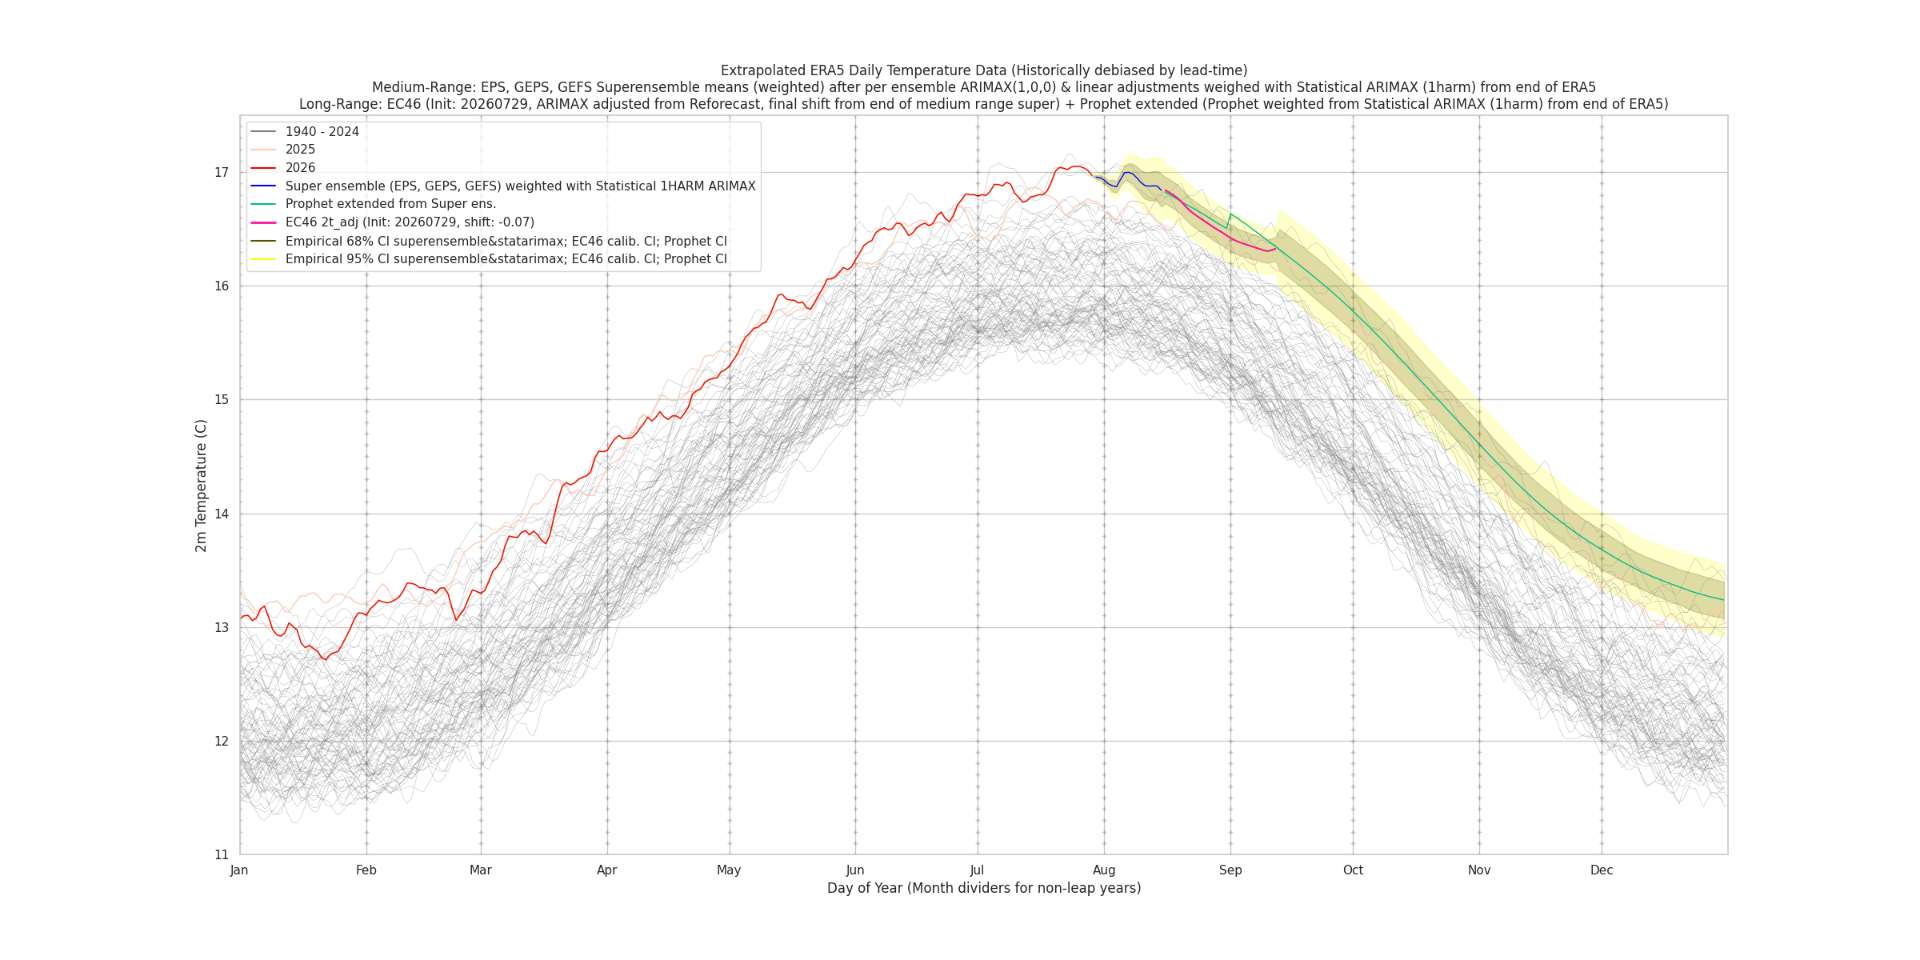
Don't have much faith in the end of August forecasts given how much more El Nino looks to fire up this month.
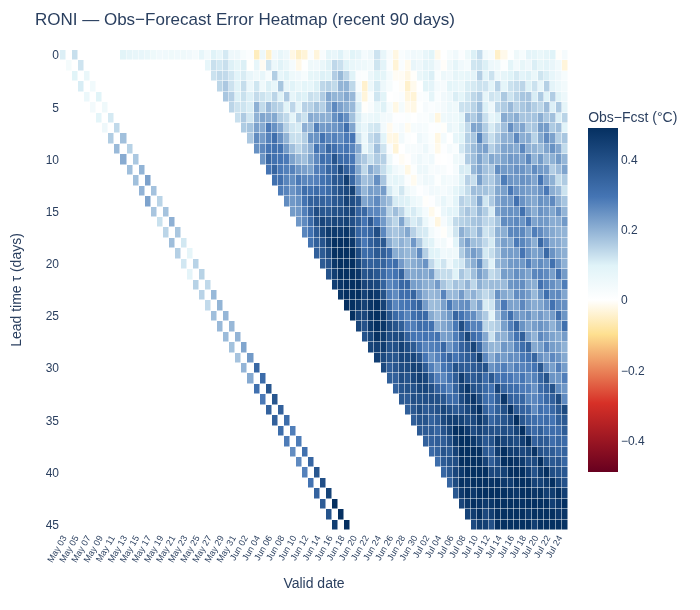
At the moment my processing of EC46 shows a daily RONI going above historical from August 12 onwards... and given how much my (poorly) "calibrated" forecast of it is biased too cold it will probably exceed that 4-5 days earlier around August 8 or so, if the past performance is any measure (the week where the bias was low was where the tropics and nino3.4 biases happened to cancel out).
~~~
Here is the doy anomaly for first half of August:
Western Antarctica still anomalously warm. Effects of El Nino still standing out.
Agreement among the three ensembles on anomalous warmth for Kansas/Oklahoma for second week of July, but GEPS disagrees about the western US.
Heat in Europe through the first week (with Hungary getting the longest lasting portion).
Greenland warm anomaly seems like there might be some easing at some point in the second week, or at least there isn't agreement on it in the ensembles at this point in time this far out.