
A combination of https://manifold.markets/Gigacasting/will-russia-nuke-ukraine and https://manifold.markets/MetaculusBot/will-a-coup-or-regime-change-take-p using their resolution criteria.
 1,000
1,000People are also trading
@1941159478 We should get Manifold to display something like this as part of the regular UI in these types of markets.
@Stralor Hmm yeah I should probably add some explanation to that site. Here is a good example visualizing this market: /EvanDaniel/bitcoin-etf-2023-x-new-alltime-high
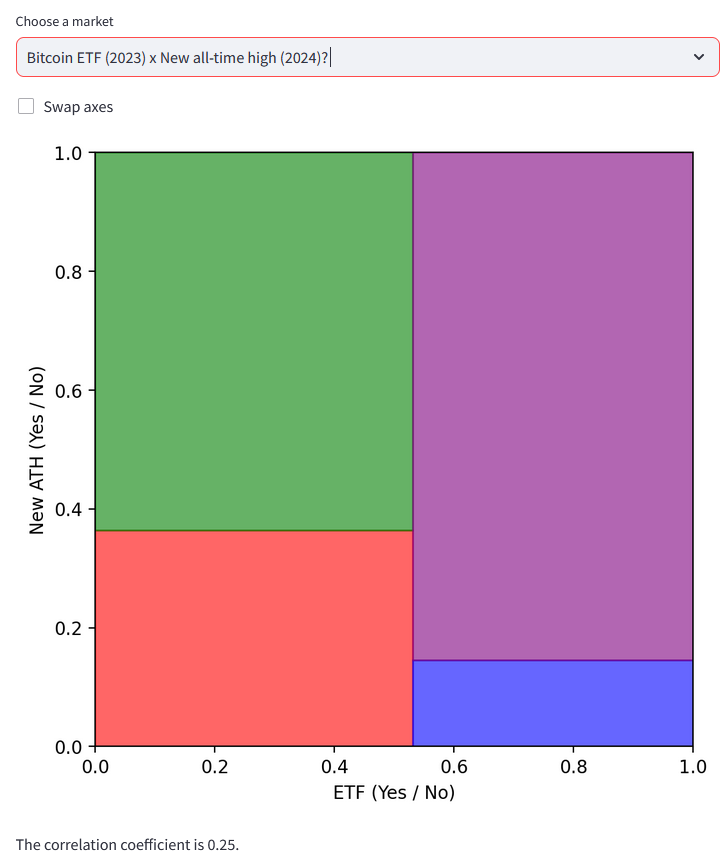
The four rectangles represent the probabilities of the four combinations of the two binary markets. The sizes are the same as the probabilities and add to 100%/a unit square. The lower left (red) rectangle is the probability that we get both a new ATH and an ETF for example. The two rectangles on the left (green, red) together are the marginal probability that we get an ETF, regardless of whether there's a new ATH. So we can read off the probability of a new ETF from the intersection of the x-axis and the red and blue rectangles. Here, the probability of a Bitcoin ETF is a bit over 50%. We can also read the conditional probabilities of a new ATH based on whether or not there's a Bitcoin ETF based on the height of the lower rectangles: Conditional on an ETF, the ATH probability is a bit under 40%. If there is no ETF, a bit under 20% (the height of the blue rectangle).
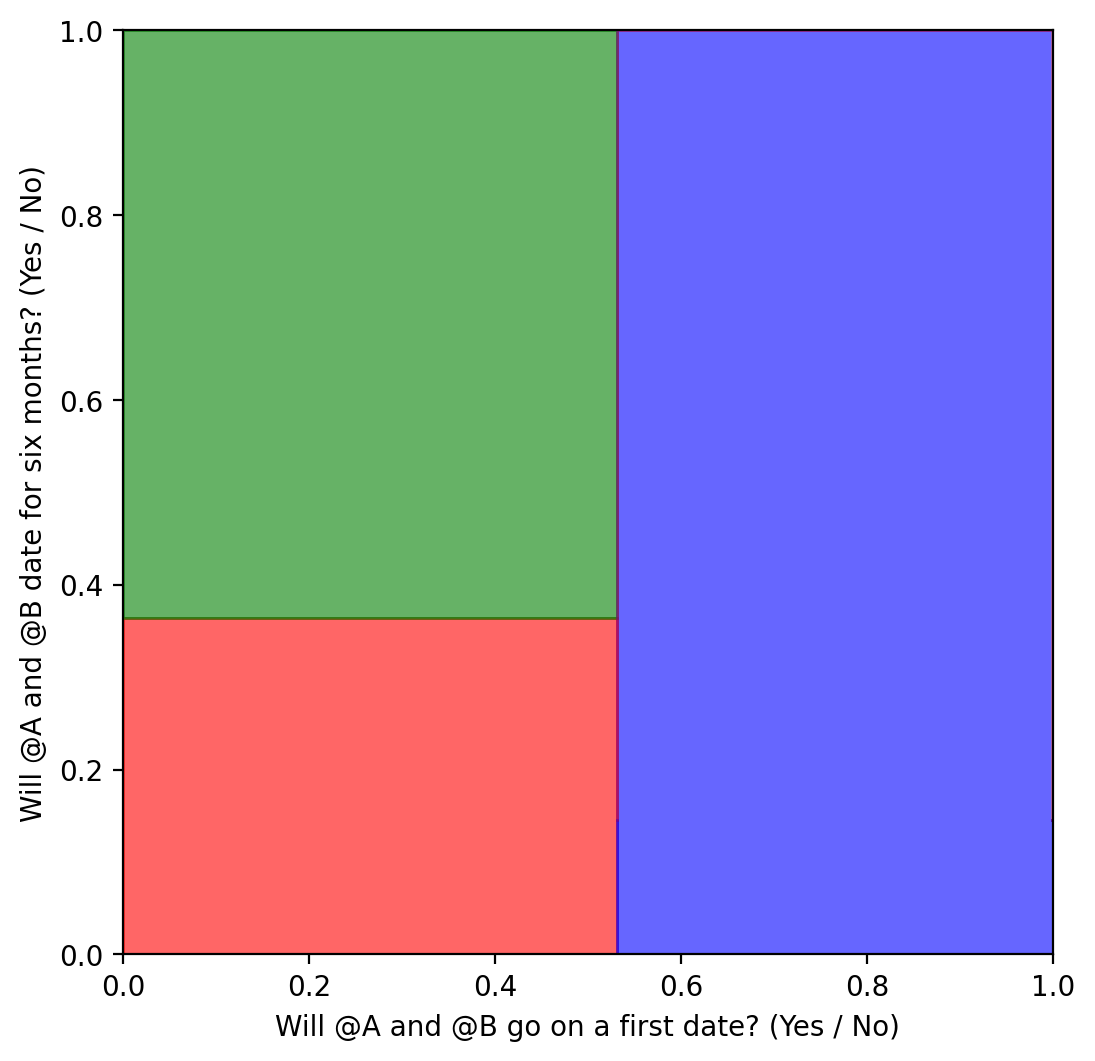
For the dating thing above I figured you can't be together without going on a first date and so collapsed that probability to 0. So the three rectangles: No Date (blue), a date but no 6 months (green), and a date and 6 months dating. And we could easily read off that conditional on a first date, the probability of lasting partnership would be a bit under 40%.