Elections

Live odds on 2028 and every race on the way there
In 2026, Manifold beat real money.Replay the map as it changed →

The race for 2028

Who wins the White House, and who gets nominated.
Which party wins the presidencyMarket →
Chart range

Who will win the White House?

Market →
  1. 1
    Jon OssoffDown 1 pt · 7d
    17%
  2. 2
    JD VanceDown 2 pts · 7d
    13%
  3. 3
    Gavin NewsomSteady · 7d
    9%
  4. 4
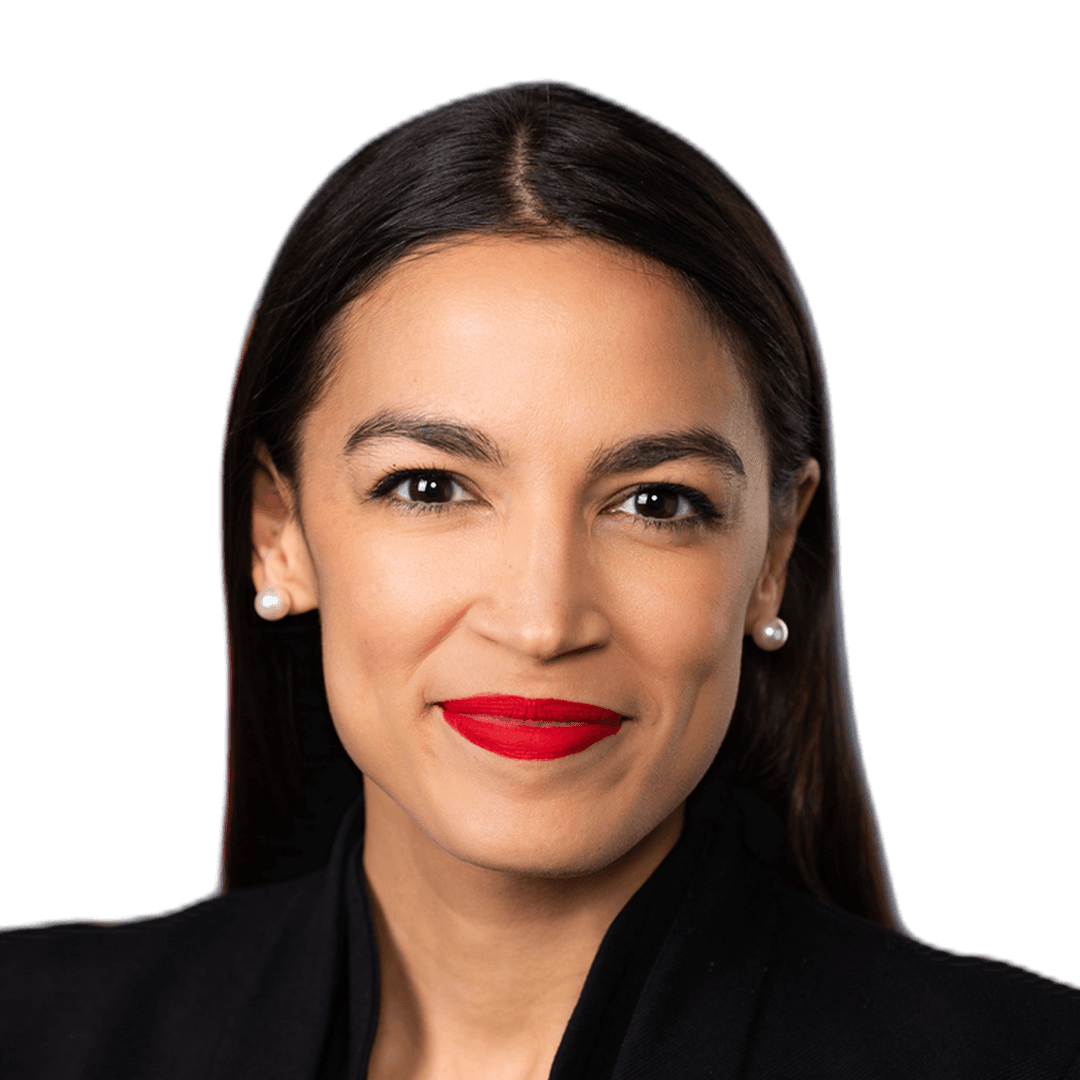
    Alexandria Ocasio-CortezSteady · 7d
    9%
  5. 5
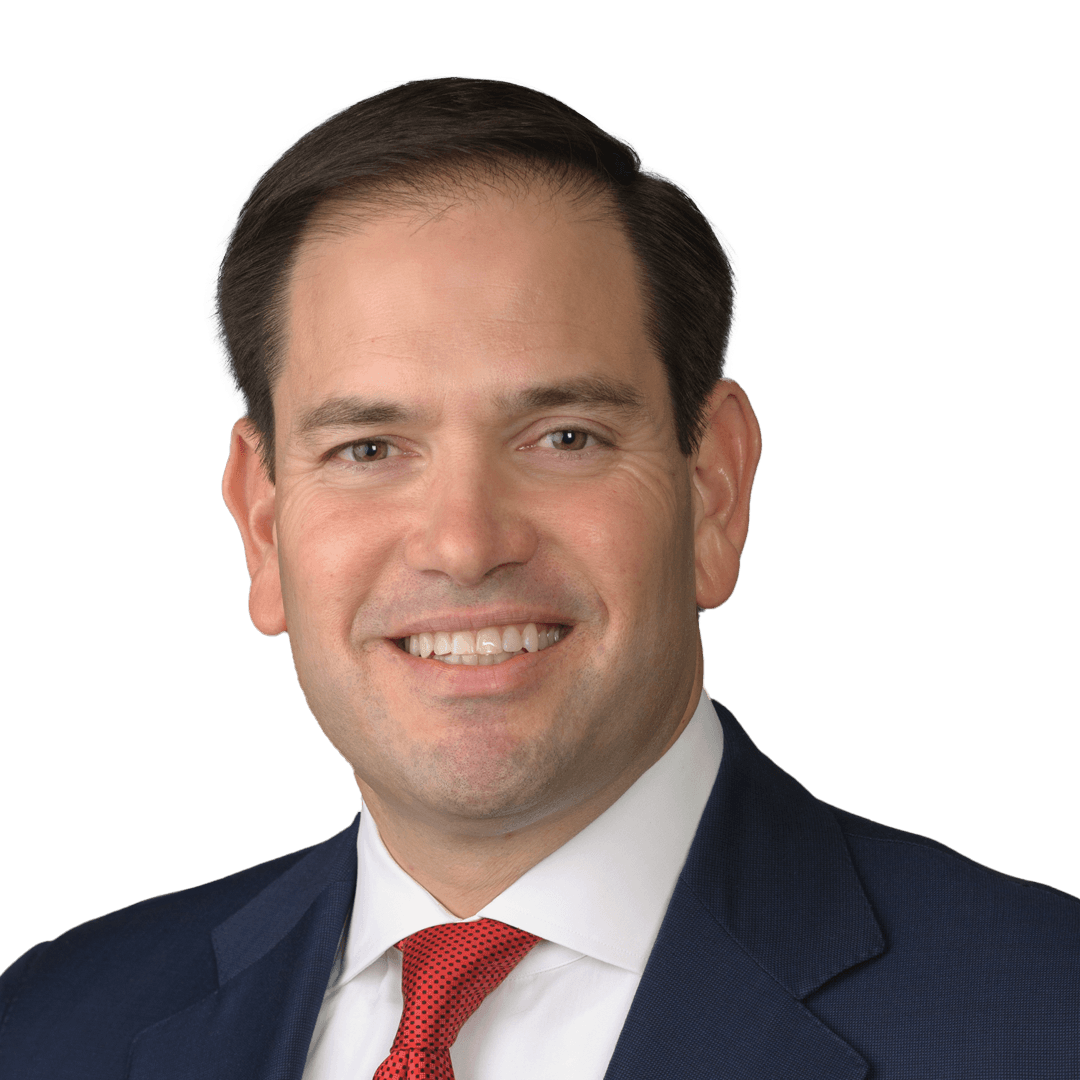
    Marco RubioDown 1 pt · 7d
    7%
  6. 6
    Josh ShapiroUp 1 pt · 7d
    3%
  7. 7
    Ron DeSantisDown 1 pt · 7d
    3%
  8. 8
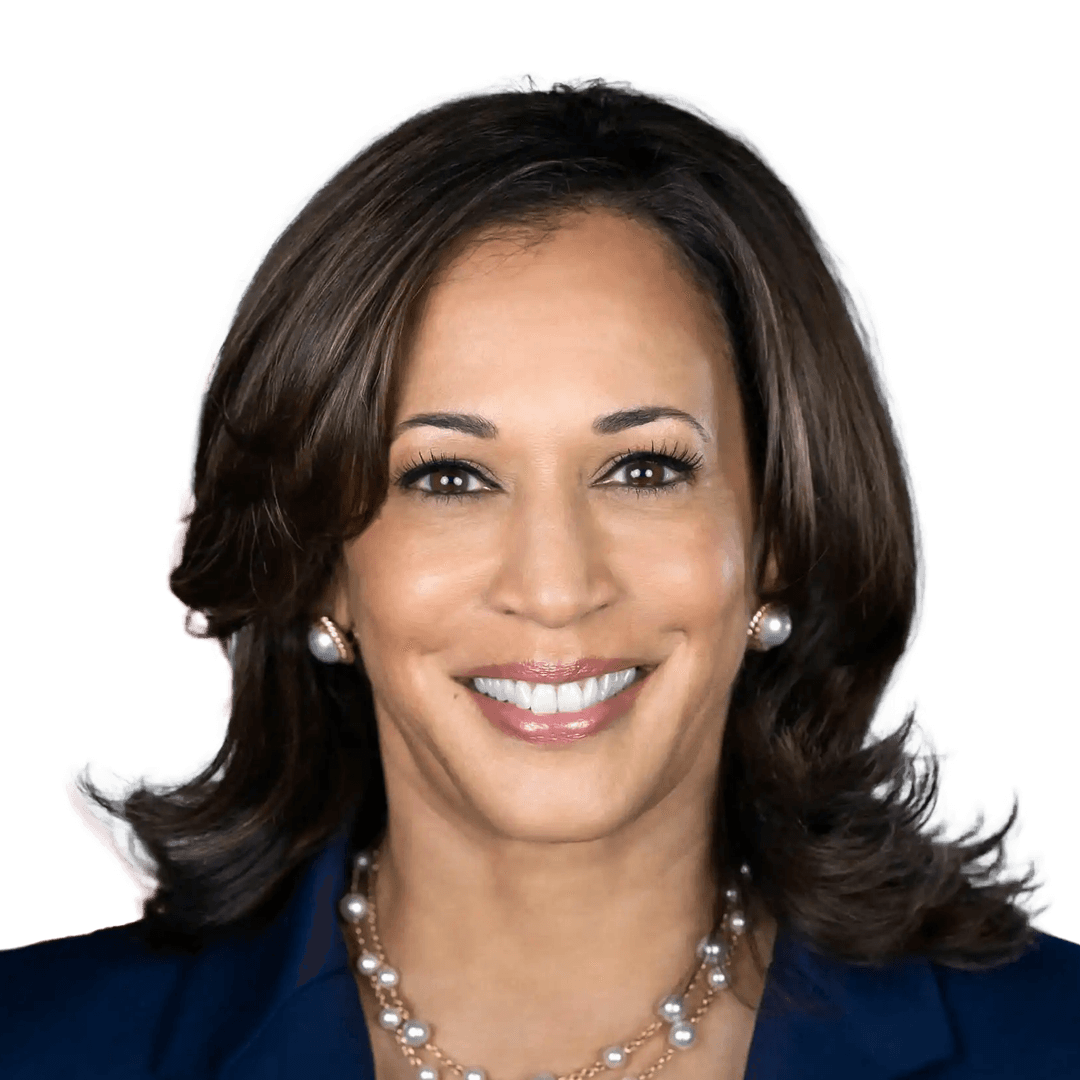
    Kamala HarrisSteady · 7d
    3%
All 100 answers →
Chart range

Democratic nominee

Market →
  1. 1
    Jon OssoffUp 1 pt · 7d
    26%
  2. 2
    Alexandria Ocasio-CortezDown 2 pts · 7d
    13%
  3. 3
    Gavin NewsomSteady · 7d
    12%
  4. 4
    Kamala HarrisDown 1 pt · 7d
    5%
  5. 5
    Pete ButtigiegSteady · 7d
    4%
All 86 answers →

Republican nominee

Market →
  1. 1
    JD VanceDown 3 pts · 7d
    30%
  2. 2
    Marco RubioDown 3 pts · 7d
    17%
  3. 3
    Ron DeSantisSteady · 7d
    12%
  4. 4
    Ted CruzSteady · 7d
    2%
  5. 5
    Donald Trump Jr.Down 1 pt · 7d
    2%
All 43 answers →

Photos: Donald Trump Jr. by Gage Skidmore (CC BY-SA 4.0), cropped.

Nov 7, 2028 · 725 days

The map

Every race by our odds, and the road to 270. Hover a state for its odds; click it for every market there.
319 DemocraticD270 to winRepublicanR 219

Electoral college modelDemocrats 67% · Republicans 33%Expected electoral votes: D 306, R 232. The national market says Democrats 67%.

Tipping pointsHow often each puts the winner over 270, in 20,000 simulations.
Loading the map…
Arrow keys move between places. Enter opens their markets.
Republican50 / 50Democratic
No race in 2028Likeliest tipping pointsMaine and Nebraska: badge = statewide votes

Hover for the odds; click a state for its markets and to bet. Scroll or pinch to zoom; drag to move.

Congress and the popular vote

Who controls Washington after 2028, by how many seats, the popular vote, and how big the win is.

Who controls Washington after 2028

Market →
Who wins the popular voteMarket →

By how much

Market →
D+3–6
Most likely · Democrat wins
25%chance
90% Democrat wins90% D wins
10% Republican wins10% R wins
Pick a bar to bet

Electoral votes

Market →
270–299electoral votes
Most likely · Democrat wins
19%chance
67% Democrat wins67% D 270+
33% Republican wins or ties33% R 269+
270 to win; at 269–269 the House picksPick a bar to bet

The tipping-point state

Market →
Count seats for

Democratic Senate seats after 2028

Market →
57–59seats
Most likely · Democratic majority
36%▲ 12.3 pts in 24h
93% Democratic majority93% D majority
5% 50–50: the Vice President’s party5% tie
3% Republican majority3% R majority
24 hours ago51 for a majority; the Vice President breaks a 50–50 tiePick a bar to bet

Democratic House seats after 2028

Market →
243+seats
Most likely · Democratic majority
26%▲ 5.9 pts in 24h
83% Democratic majority83% D majority
17% Republican majority17% R majority
24 hours ago218 for a majorityPick a bar to bet

Also on 2028

Nov 2, 2027 · 354 days

Off-year elections

Governors and legislatures in the odd years, the Speaker vote, and major elections abroad.
  • Kentucky
  • Louisiana
  • Minnesota
  • Mississippi
  • New Jersey
  • Virginia

Around the world

January–June 2028

The primaries

Who runs, and who leads each party's contest in the early states.

Who's running

Each one's chance of running. Click a face to bet.
Democrats
Republicans

The early states

Who leads each party's contest, in the order they vote. Click a name to bet.
  1. 1Iowa
  2. 2New Hampshire
  3. 3South Carolina
  4. 4Nevada
Super Tuesday Mar 7, 2028Last primaries June 2028The other 53 contests, and Senate and governor primaries, on the map →
Summer 2028

Conventions and running mates

Each party's pick for vice president, who ends up on the winning ticket, and whether a convention goes past its first ballot.

Democratic VP nominee

Market →

Republican VP nominee

Market →

Photos: Donald Trump Jr. by Gage Skidmore (CC BY-SA 4.0), cropped.

On the winning ticket

President or vice president. Each name is its own market.
Market →
2030–2036

After 2028

Which party holds the White House, Senate and House after each election, and the 2032 race.
Each party's chance of holding each office after each election
2030MidtermsMidterm2032PresidentialPres.2034MidtermsMidterm2036PresidentialPres.
White House
Senate
House

* Not on the ballot in a midterm year: the party holding the White House then. Click a cell to bet on who controls Washington after that election.

What the 2028 winner would change

The same questions, asked under a Democratic and a Republican president. Click a chance to bet on it.
Chance of…
If the Democrat wins · 67%
If the Republican wins · 33%
Gap
S&P 500 up by end of 2029 (vs Election Day)
GDP shrinks in a quarter, 2029–30
Supreme Court grows beyond nine (by 2033)
Marijuana federally descheduled (by 2033)
Legislative filibuster ended (by 2031)
Federal abortion-rights law (by 2033)
Bitcoin above $250k at end of 2030

Each market resolves N/A if its condition doesn't happen, so bets only count in that world.

Polling averages

VoteHub's live polling averages. Bet on whether they go higher or lower.

Trump approval

VoteHub average
38.5%
Past 7 days

Vance favorability

VoteHub average
39.9%
Past 7 days

Unprecedented politics

Things that have never happened in American politics, with the market's live odds that they do.
The 2028 markets traders are most active in right now.
Nov 3, 2026

2026's biggest swings

The races Manifold's odds moved most on, from a week out to the result.
Replay the map as it changed →
  • Senate controlDemocrats 70% → won+30pts
  • House controlDemocrats 94% → won+6pts
  • NC-6Democrats 10% → won+90pts
  • Wisconsin Question 2No 18% → won+82pts
  • IN-5Democrats 20% → won+80pts
  • South Carolina SenateDemocrats 23% → won+77pts
  • TX-9Democrats 26% → won+74pts
  • NJ-2Democrats 29% → won+71pts
  • NC-9Democrats 31% → won+69pts

Leaderboards

Who has made the most on election markets, and whose markets draw the most traders.

Top traders

#TraderProfit
1Ṁ1,025,397
2Ṁ242,788
3Ṁ220,894
4Ṁ110,745
5Ṁ55,693
6Ṁ43,216
7Ṁ27,061
8Ṁ24,612
9Ṁ20,959
10Ṁ20,323

Top creators

#TraderTraders
16,632
22,207
31,183
41,128
5805
6714
7434
8367
9284
10283
Profit, and traders on the markets each creator made, across the 2026 election topics.

More election markets

Search for markets, users, topics, and posts. Results update below as you type.
Total traders