Update 2025-06-12 (PST) (AI summary of creator comment): The creator has added answer options for the following values of N:
100
500
Update 2025-06-12 (PST) (AI summary of creator comment): The creator has provided the following definitions for how the market will be resolved:
A robotaxi service is defined as one where a user can request a ride on-demand, similar to Uber or Lyft. It will still count if riders must first join a waitlist.
The fleet size will be determined by the total number of Teslas used for an autonomous ride by someone other than the owner.
A vehicle is considered "actively operating" if it provides at least one such ride within any given week.
Update 2025-06-28 (PST) (AI summary of creator comment): In response to a question, the creator has specified that a vehicle will be counted as a robotaxi even if a safety monitor is present, as long as there is no human in the driver's seat.
 1,000
1,000People are also trading

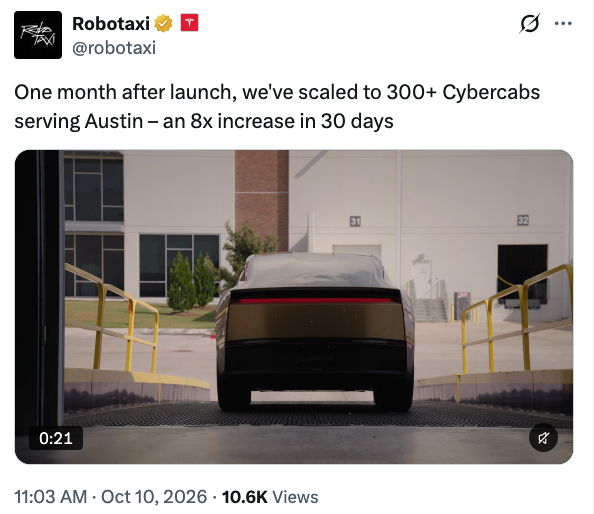
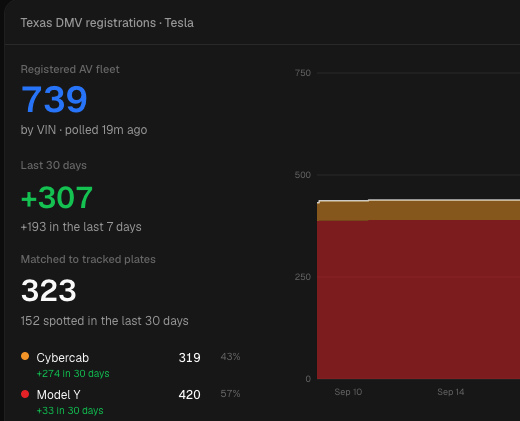
Tesla says 300+ cybercab in austin. robotaxitracker.com crowdsourced says 105 cybercab. This would mean 300 cybercab and 170+ Model Y in Austin. The total unsupervised could be 610+. close to the Texas registered amount of 739 +30 in florida
@brianwang Sorry, I don't think this is right. There are 319 Cybercabs registered in Texas. Perhaps they are all in operation but perhaps not. But it would seem this 300+ number in the tweet could refer to the registered count of 319. The number registered on 8 September was 42 so the 8X factor also looks like it might be being done on a consistent basis of registered vehicles rather than operating vehicles,
There are only 105 logged Cybercabs so applying a tripling of the number to other vehicles is a large and uncertain addition: Suppose in 10 days time we see 180 logged cybercabs are known about is it then a 3X factor or a 1.5X factor to be applied to the non cybercab vehicles? Or have the other vehicles been around longer so we should only apply a 1.2 factor or something completely different?
@ChristopherRandles Tesla official robotaxi accounts says there 300 Cybercabs in Austin. They are saying the registered Cybercabs are in Austin and available as robotaxi. The logged Cybercabs are the crowdsourced logging of rides. They added 150 Cybercabs yesterday. There have been 529 logged Austin Cybercab rides. No new cybercabs logged since Oct 8. The PROBLEM is with the low leveling of sampling. There are 2000 Tesla fan attending the X takeover event. I know some of those people and they are taking many robotaxi rides. BUT most do not use the robotaxitracker app or site. Tesla (@Tesla) on X
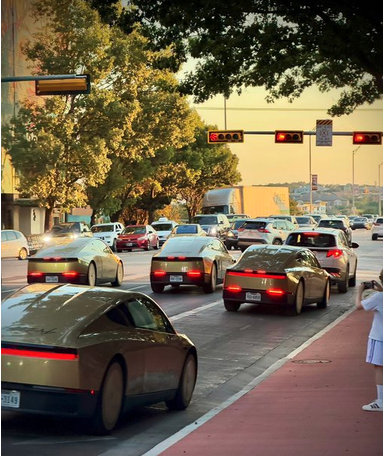
From the Tesla published picture we see active cybercabs. one has a plate ending in 3149, 6859 and 2249. Only one of those plates in the crowdsourced system.2249. There is evidence from the tracking site itself that it has low sampling. IF 20 rides per day per vehicle out of 300 vehicles, then 6000 rides per day and 180,000 rides per month. one in 300 rides logged.
@brianwang First Cybercab Ride 🤯 .
Cybercab video Austin. 2 days ago. 3203 last four on the plate. Not on the tracker. But need VINS. Tracker mostly has VINS. Only 46 people logging cybercab rides on the site.
@brianwang Recorded video of a cybercab ride from 3 days ago the plate is not the tracker.
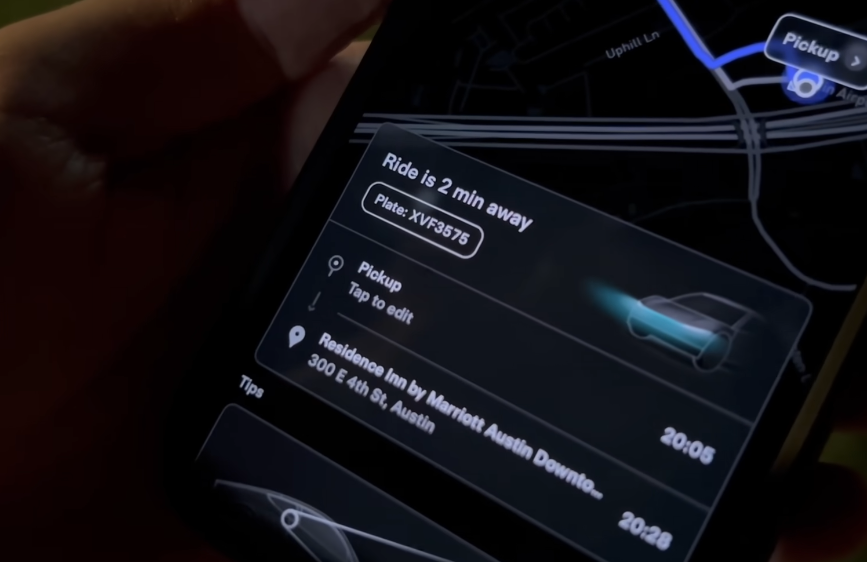

@ChristopherRandles I believe that 90+% of registered vehicles will be in operation. It is likely very close to the full number. AS the number get bigger and bigger in terms of miles and vehicles then we know we will be counting less and less. 4000 Waymo 1300 spotted and logged. Waymo over 100 rides per car per week.
410 count crowdsourced robotaxitracker.com, 275 count in Austin (last 30 days seen), 324 ever seen. sampling can miss some seen before and still driving. Should see the weekend surge to over 450 with the Tesla event this weekend in Austin.
@mods Inactive creator. I think 100 should now resolve yes.
I have now counted 103 tesla vehicles spotted in last 20 days (today plus up to 19 days ago excluding Bay area which have safety driver) on https://robotaxitracker.com/vehicles?provider=tesla
This is after the excitement period of high interest for a week after the 3 Sept Cybercab launch event. There is only a small number of trips logged in this period so this is certainly an underestimate. 7718 logged trips 8 days ago to 7767 now is only 49 logged trips in last 8 days so spotting 103 vehicles in 20 days suggests there is quite a few more than 103. Some may have been removed from service before others were added but this seems highly likely to be a much smaller effect.
It is possible the 332 number at https://robotaxitracker.com/ is an undercount due to low sampling or it could be an overcount if some models Ys have been removed in favour of more Cybercabs. We might in future be better using a vehicle mile travelled metric to convert to estimated vehicles but with 100 spotted with low sampling rate I think the 100 should now resolve rather than continuing to wait for more data.
Silly clarifying question for @TimothyJohnson5c16: Suppose Tesla paraded out 100 robotaxis and invited 100 people to take 100 rides, all in one day. And suppose they proceeded to then shut the entire program down. Would "N=100" resolve to YES because there were technically 100 vehicles that all were active within the same week?
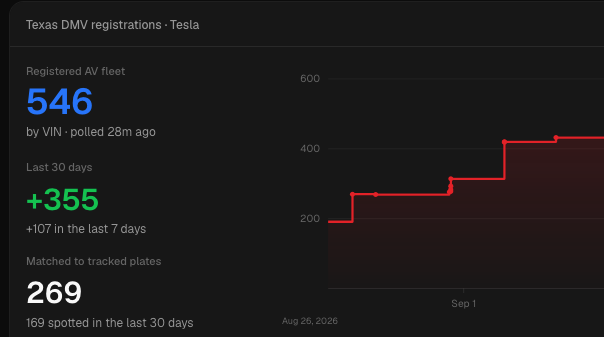
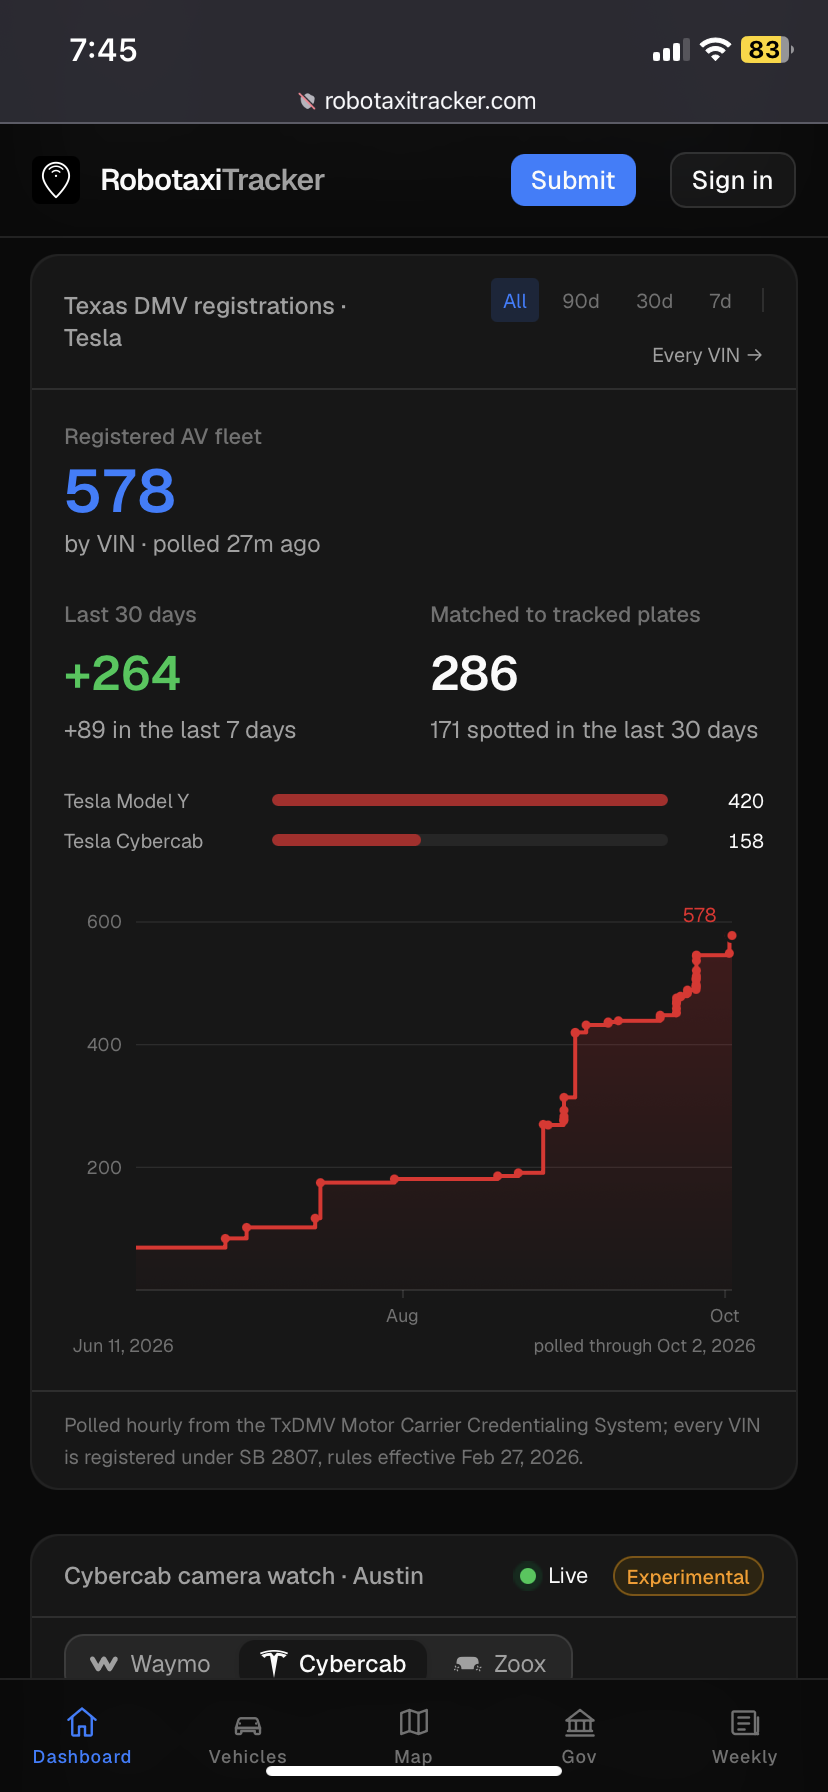
578 registered unsupervised in Texas plus at least 23 in Florida. Over 600. Dallas is at 59 crowd counted. In October November the Texas cities should each be in the 200 to 400 ranges.
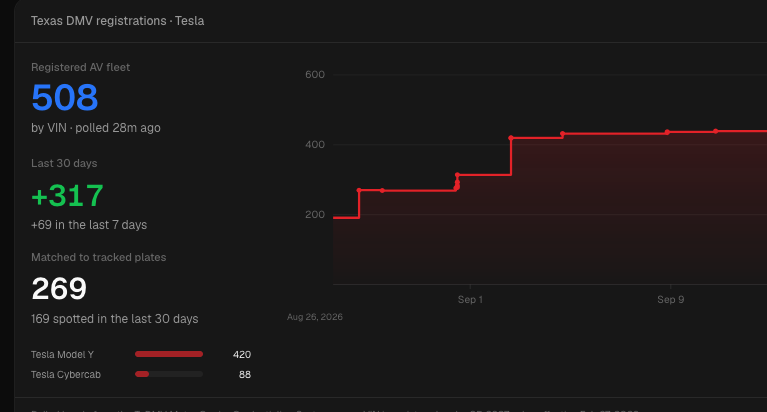
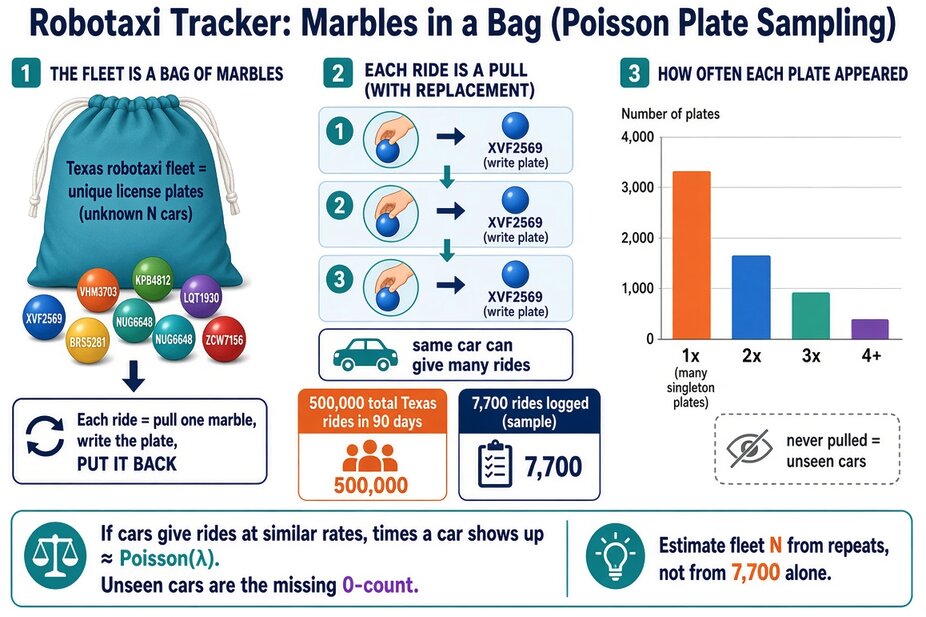
@brianwang 500.000 rides where does that come from?
1 million unsupervised miles might well be less than 400,000 paid miles and at 5 miles average ride length (if not slight more than 5 miles) that looks like it may well be less than 80,000 rides. However that 1m miles was only up to 3 Sept, so if the 500,000 rides is a lot more recent maybe it makes more sense? (The 1m+ miles was AFAICS "unsupervised", I see no evidence for it being paid mileage.)
2% sampling can be adequate. More relevant is samples per vehicle. For Texas 7700 for 200 to 500 vehicles is likely well over 15, whereas for Florida 108 trip logged for 23 vehicles is only 4. So Texas which reached 290ish seen in 30 days is not likely to be many more than this 290 vehicles. Also note some of those 290 may have been operating in 1 or 2 of the weeks in 30 days while other cars were only operating in different weeks. So I think it is quite possible for this 290 number to be an overestimate. Probably is more likely to be an overestimate than an underestimate.
The Florida 23 number is more likely to be an underestimate but I doubt the real actively operating (at least 1 ride in a week) is much over ~30 unless there are a surprisingly large number of vehicles only doing between 1 and 10 rides a week. Why would you do the actual level of rides being given by using so many more vehicles than is needed to do so?
@ChristopherRandles 1 million unsupervised miles was over 23 days ago and we have doubled to tripled the number of vehicles vs the average used in the 90 days that did the bulk of the unsupervised. The recent sampling had longer rides. About double the distance. 2X the vehicles and 2X the ride length. Is 4X the miles per week. 5 weeks to go from 380000 cumulative unsupervised earnings call to 1 million unsupervised cumulative at cybercab day. 150,000 miles per week average but increasing. last week likely at 200,000 miles in that week. Three weeks after 400,000 miles, next week 600,000 miles, 800k miles. I think at 3 million cumulative. 2 million. About 700,000 rides. at 3 miles per ride. 400,000 rides at 5 miles per ride. 200,000 miles and 60,000 rides in the last week before cybercab day using at about200 vehicles is 1000 miles per week each. 300 rides per vehicle. is 40 to 50 rides per day.
@brianwang I think Florida are not necessarily driving less may half to one third per vehicle but rider reporting and logging is less, not 2%, maybe 0.2%.
@ChristopherRandles 7700 ride samples down over more than 90 days. the 100 vehicles added in the last 7 days. being observed by 80 samples per day IF all 7700 observations made in 90 days and this was average. Wayback machine for July 22 for Austin. 2764 logged observations. now 4668 logged observations for Austin. 1900 observations in 64 days. Less than 30 observations per day in Austin.

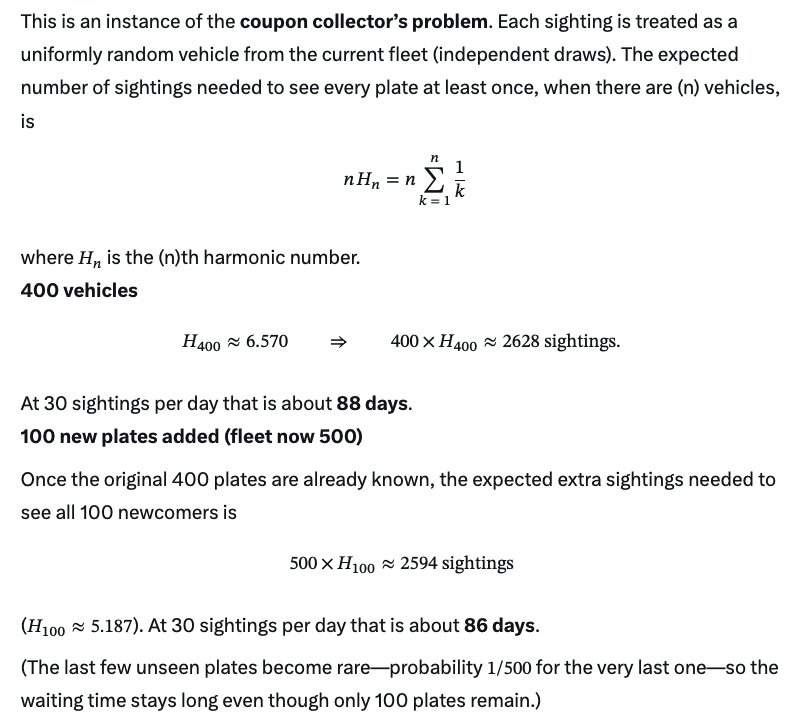
This is an instance of the coupon collector’s problem. Each sighting is treated as a uniformly random vehicle from the current fleet (independent draws). Siting 400 vehicles takes 88 days. Then adding 100 new vehicles to the 400 takes 86 days. (The last few unseen plates become rare—probability 1 in 500 for the very last one—so the waiting time stays long even though only 100 plates remain.)These figures are expectations; the actual number of days fluctuates (standard deviation is on the order of (n), i.e., a few weeks). The calculation also assumes every vehicle is equally likely to be seen on every observation. seeing any vehicle is 1 divided by the total number of vehicle population. if there 1000 vehicles it is 1 in 1000.
@ChristopherRandles BTW: FYI: I passed the first two insurance actuary tests (calculus and statistics). And a few years of statistics in university. And worked in Corporate finance for seven years. But with AI just asking the right questions about poisson distribution observations and coupon collector problems, this can all be explained.
@brianwang >"150,000 miles per week average but increasing"
What evidence do you have that this is increasing in the past couple of weeks?
Recent addition of ~70 extra Cybercab vehicles might be suggestive of an increasing trend. However, it might more likely be preparation to add Cybercabs to other Texas locations. It seems realistic to think there may well have been a peak in demand before Sept 3 due to more rides equals more chance of invite to 3 Sep event and for a week or so after that event for people to try out Cybercab. The rapidly dropping number of vehicles spotted in last 30 days is now down to 167, yes this lowering trend can be due to a lower rate of sampling but 30 days still includes period from 26 Aug when sampling was likely higher.
It just seems like you are pushing too much for too high an interpretation of the number of vehicles. To justify resolution, we should be looking more to the low end interpretations. If there is a growing trend then there is plenty of time for the data to show this rather than pushing an extreme high interpretation of the data so soon. I think there will be Cybercabs added to other locations and more vehicles will be in use by the year end but it is too soon to be pushing a view that this has already happened.
We seem to have good circumstantial evidence that we've exceeded 100 weekly active distinct vehicles. For 500, probably not. I'm not sure how we're going to end up certain of this. Number of vehicles registered with the Texas DMV is pretty weak evidence for number of active vehicles. And Robotaxitracker.com is also hard to extrapolate from.
@dreev Perhaps "we"(mods?) should use the best evidence i.e. whatever seems to give the smallest range for the number of vehicles? 'Best evidence' seems more sensible than requiring a 'certainty' threshold for resolving?
What do you think are the most and least estimated numbers for average miles driven in a day by an actively operating robotaxi? Take the best period we can find with the highest unsupervised miles driven (so far AFAIK 620k+ miles in period 22 July to 3 Sep) and figure a range for the number of vehicle from that? While I think there may be some vehicles doing only ~30-50 miles a day used only for a peak hour or two, others would be used more continuously for 200-400 miles. Perhaps more vehicles at 40 miles than at 300 miles so maybe an average of 100 miles to 180 miles? This would seem to give a range of ~80 to 150 vehicles to do 620k miles in 42 days. This is perhaps on the low end of what we are inclined to think has happened so maybe there are a lot more vehicles only being used an hour or two compared to the number of vehicles used more continuously?
I imagine this estimated average milage method would be better than extrapolating from small sample of spotted vehicles on robotaxi tracker.
If other measures provide tighter constrains also use those constraints. e.g. if vehicle miles driven per day / lowest average miles for a robotaxi per day exceeds the number of registered vehicles then use registered vehicles as the upper bound.
Use midpoint of the remaining range as the number of vehicles to use for resolution?
If Tesla start publishing other data like number of rides and for whatever reasons we can better estimate average number of rides per vehicle per day then I don't think we should ignore this new data source even though that makes establishing a method to use more difficult.