
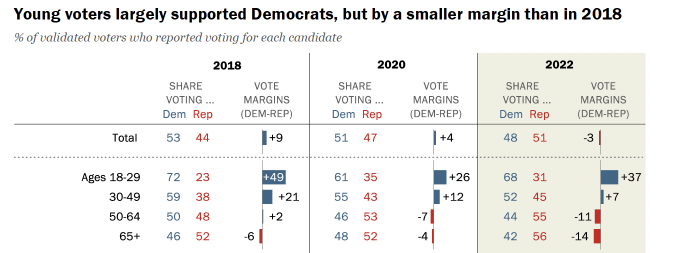
Pew Research surveys validated voters after national elections and askes them about their demographics and vote. Here are the results after the 2022 midterms:


You can also see the results for the 2016 election here.
This market will resolve based on Pew's findings after the 2024 election, by comparing the change in vote % from 2022. You can submit any Race/Age/Education/Gender combination shown in the images above to this market.
The option that has the largest percentage point increase in democratic vote will resolve Yes, all other options will resolve No.
In 2022 this would have resolved to Black men with a 12 point increase, with overall voters 18-29 in second place with an 11 point increase.
In 2020, this would have resolved to Black, college grad+ with a 1 point increase from 2018. Second place would have been "some college" which stayed neutral. Every other demographic listed became more conservative.
I've added the favorites from previous years as starting options here, but perhaps they've shifted so much that it will be a new category that shifts most from 2022 to 2024.
In the case of an apparent tie, I will dig into the crosstabs to try to find which demographic shifted more. In unforeseen ambiguous cases, I will do my best to resolve according to the spirit of the question.
 1,000
1,000