
BEGINNING 2 WEEKS AFFER HE IS INAUGURATED - I.E., BEGINNING FEBRUARY 3RD, 2025.
DECIDED BY REALCLEARPOLITICS AVERAGE.
Last term, his approval rating went underwater February 1st, 2017 and never surfaced. Joe Biden’s went underwater August 23rd, 2021 and never surfaced.
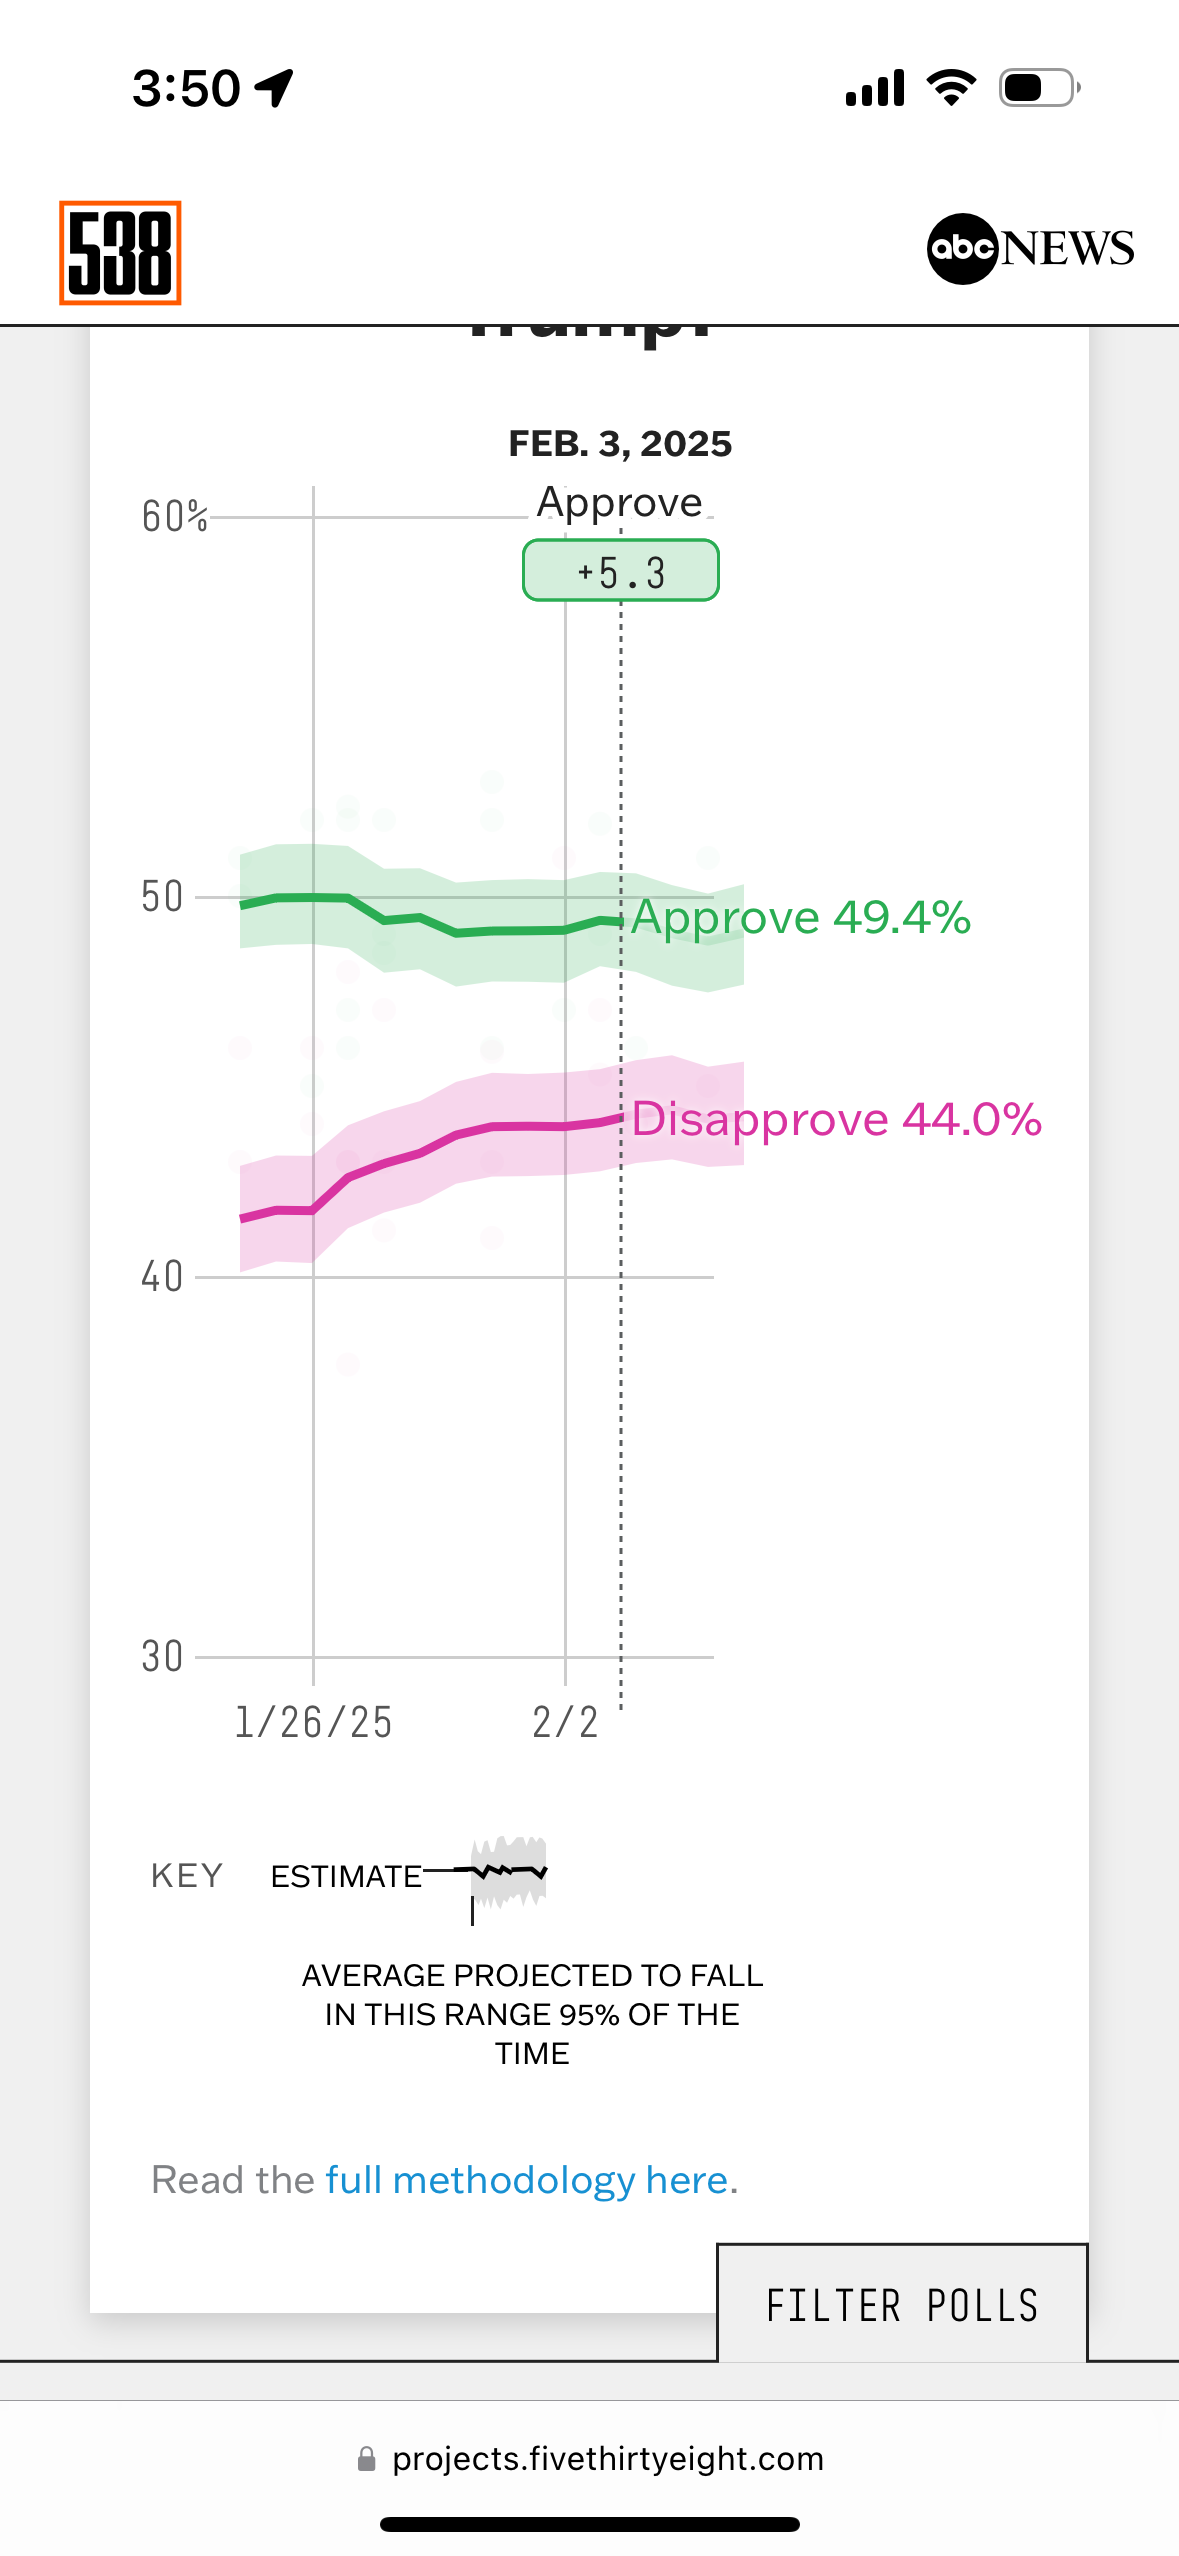
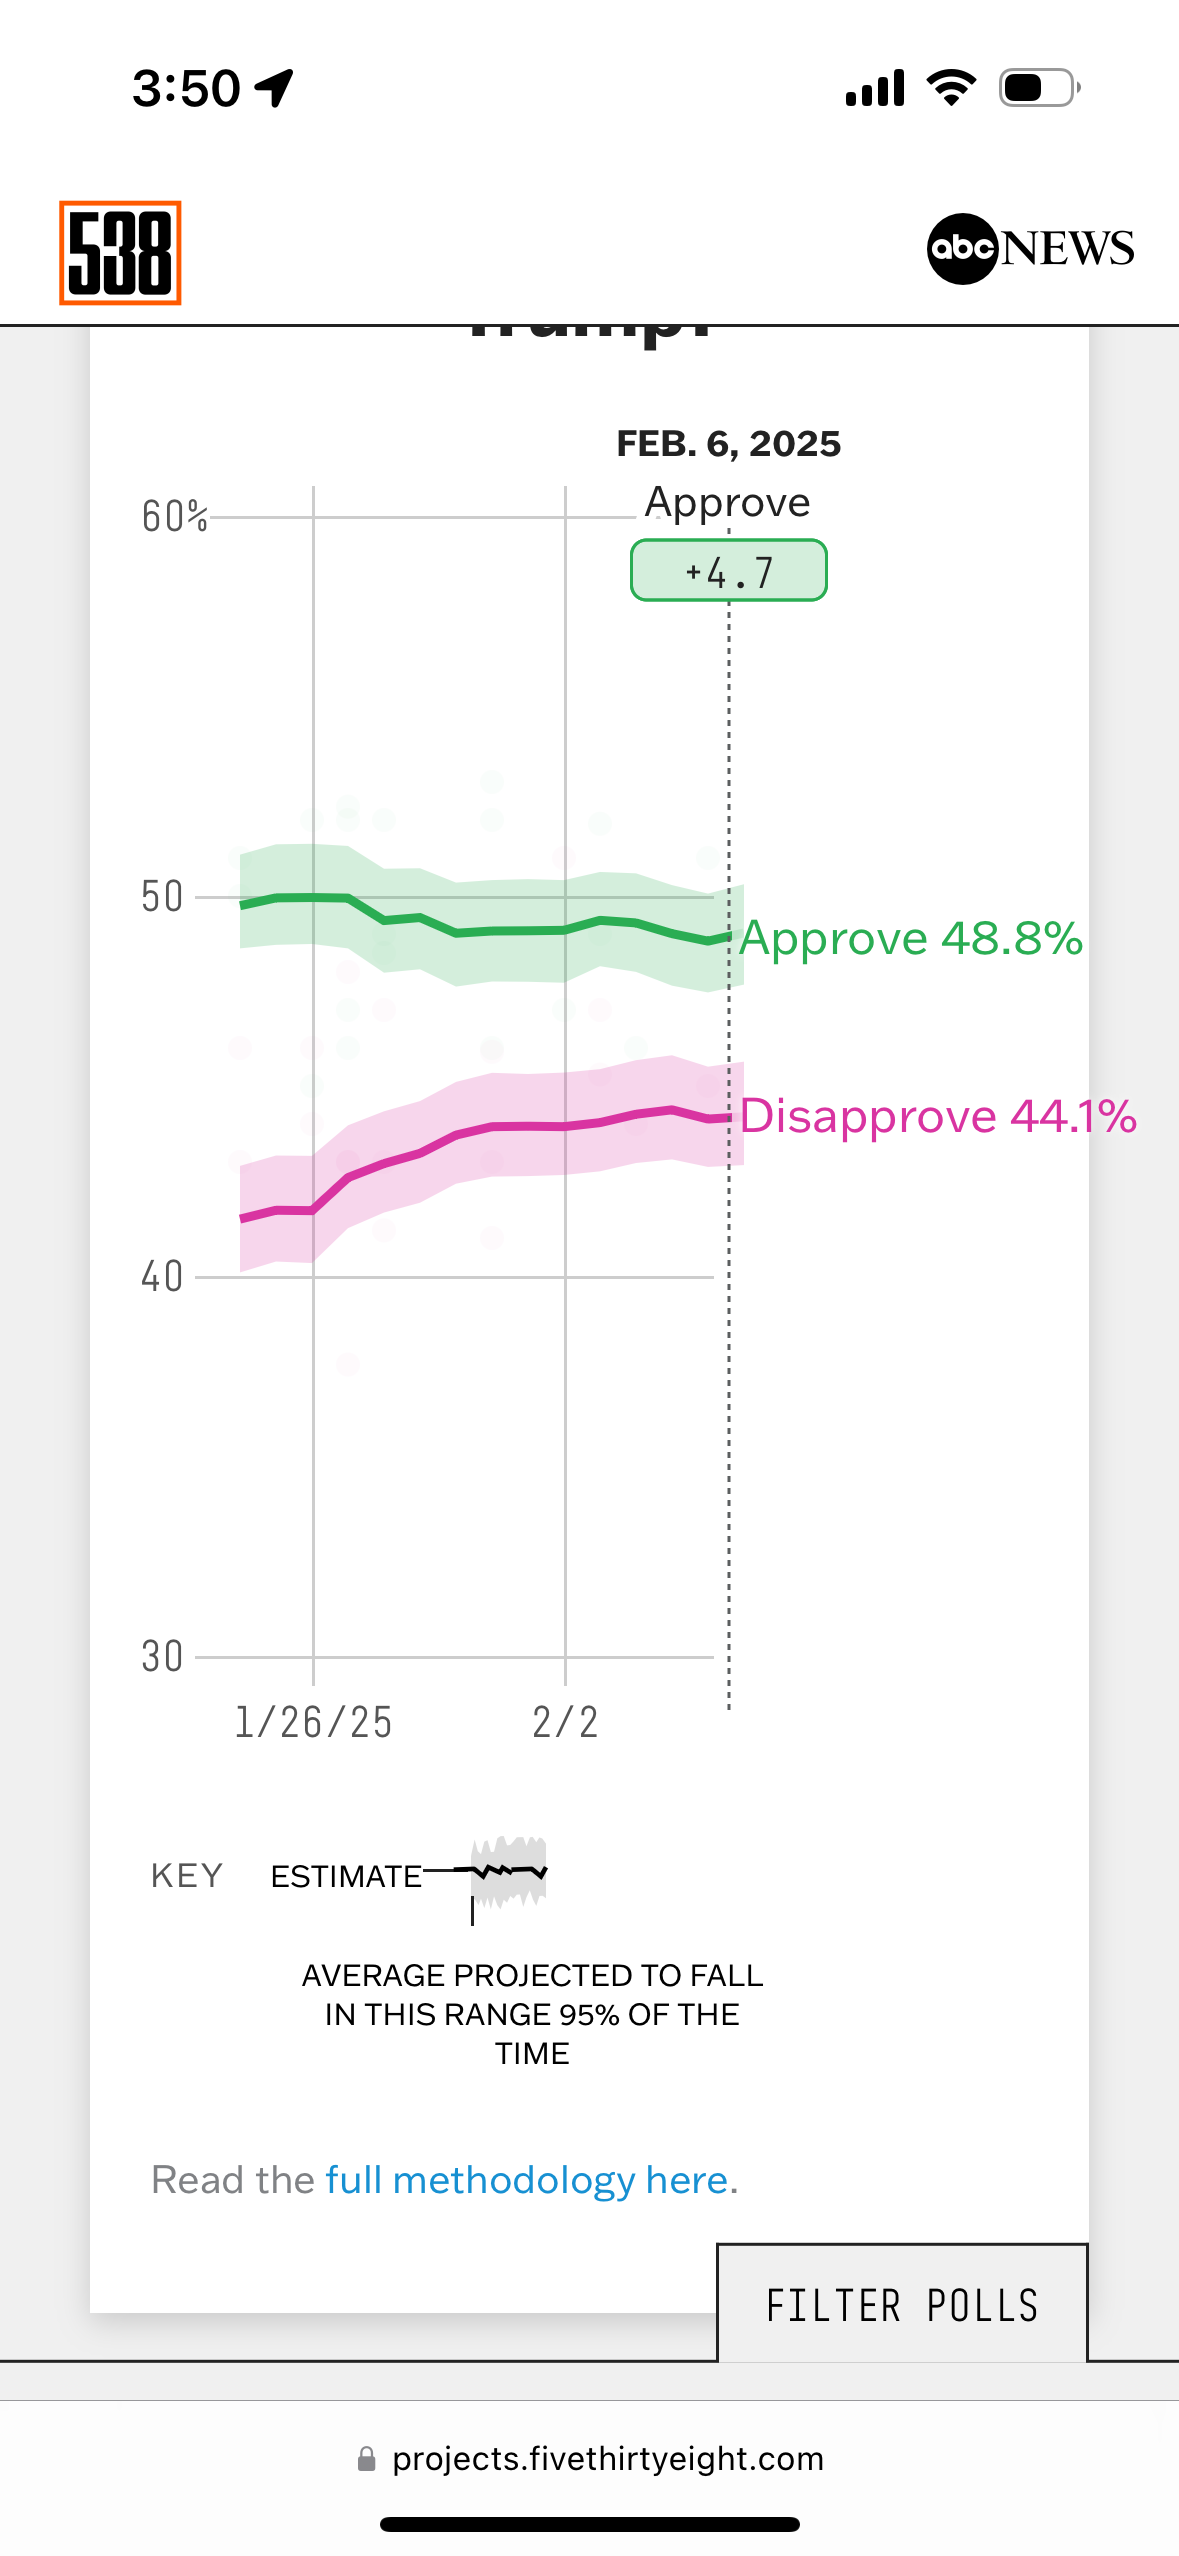
If RCP shuts down for whatever reason, then decided by 538’s average.
Update 2025-02-02 (PST) (AI summary of creator comment): Additional Resolution Detail:
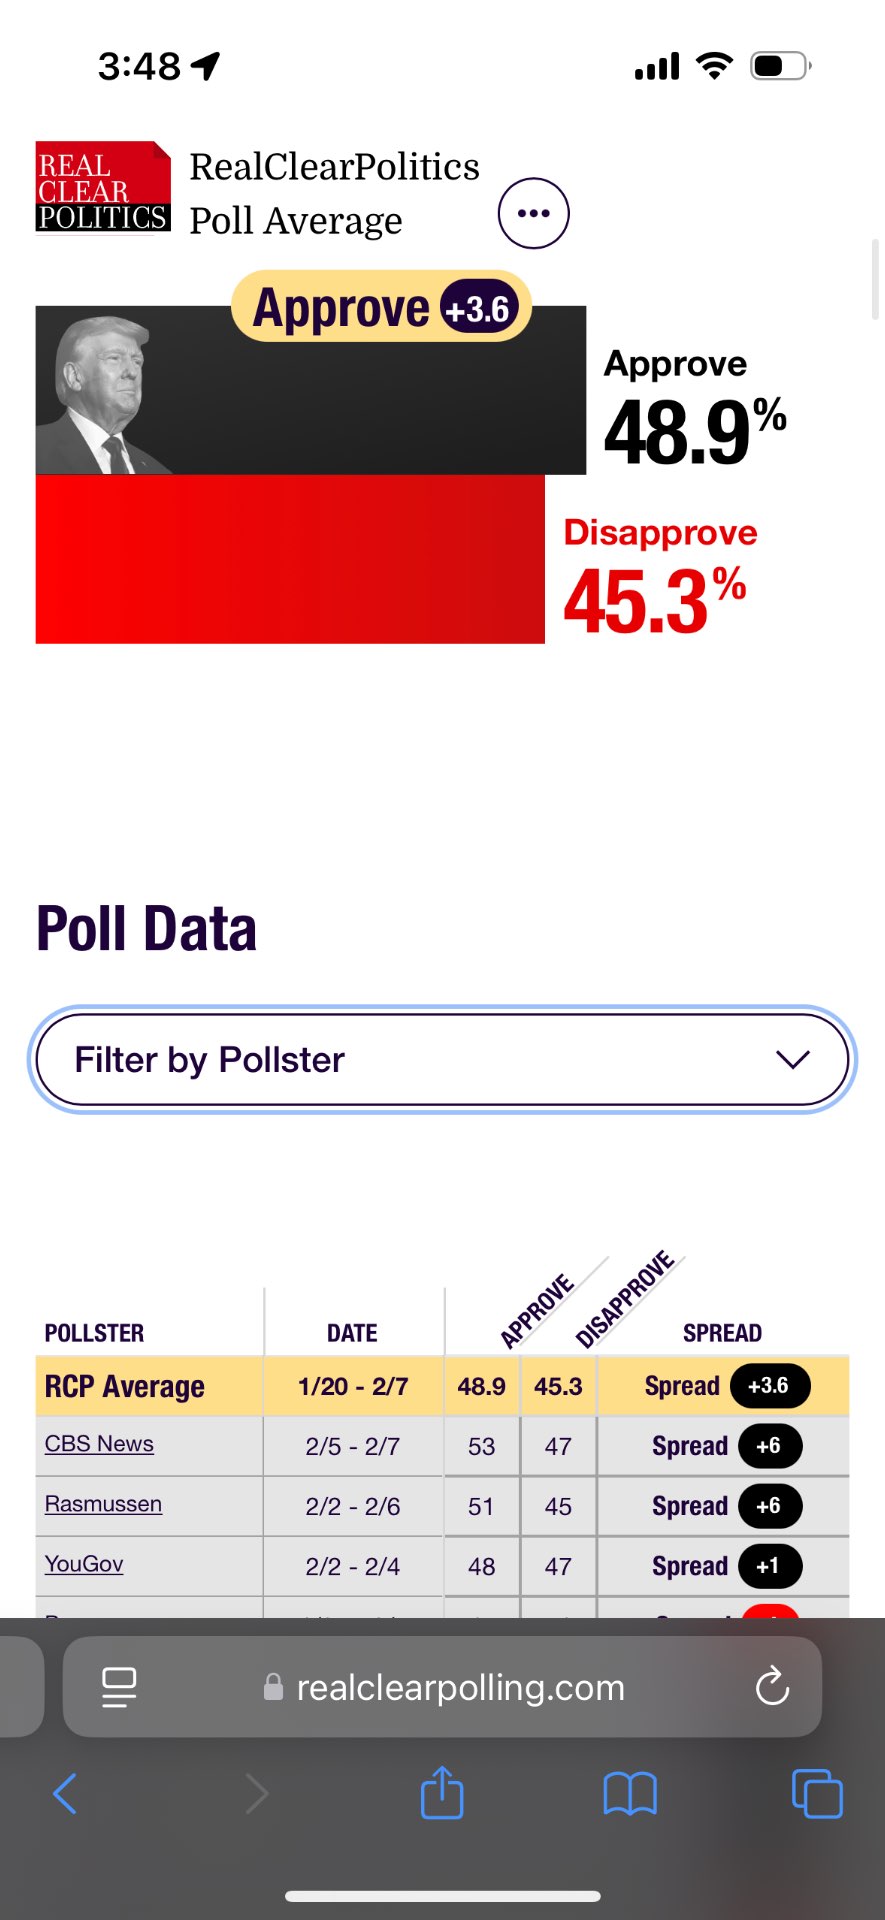
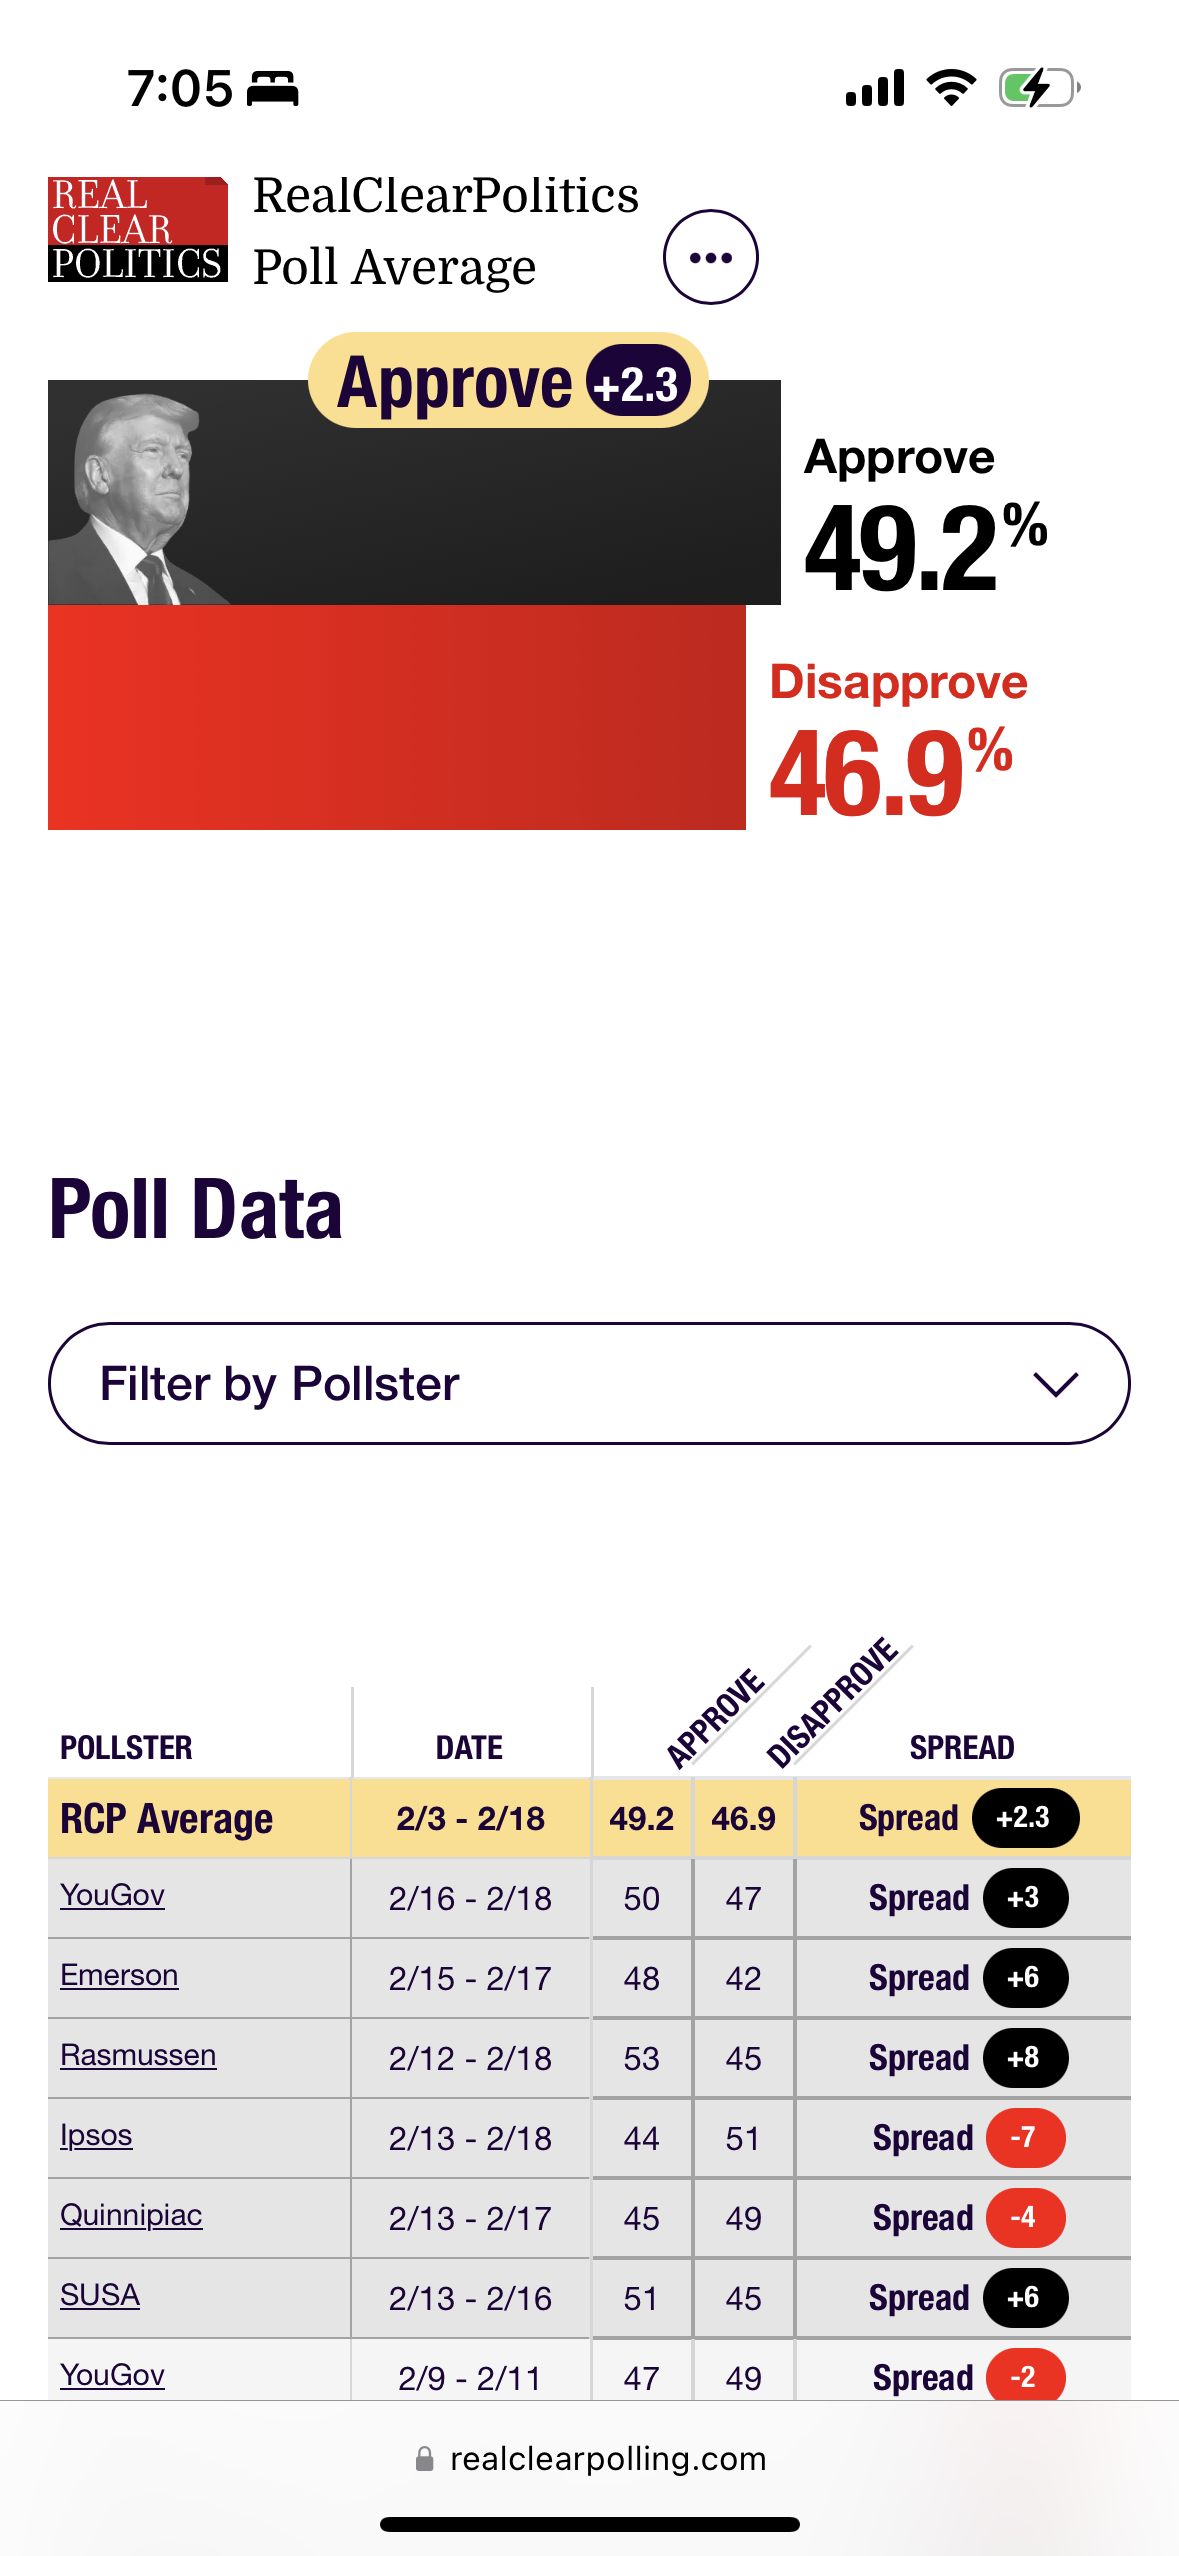
The market will only resolve if a RealClearPolitics average for February 3rd (2/3) is available.
The current data (average covering 1/20–1/30) will not be used; the resolution depends on being able to hover over the graph and pinpoint the average for 2/3.
Resolution will occur as soon as the February 3rd average is clearly posted.
Update 2025-02-09 (PST) (AI summary of creator comment): Poll Data Clarification:
The resolution requires using the RealClearPolitics poll average for February 3rd.
If an exact February 3rd average is not identifiable, a poll average from a period beginning on or after February 3rd will be used.
A graph based on emerging poll data will be generated once enough polls have been accumulated.
 1,000
1,000🏅 Top traders
| # | Trader | Total profit |
|---|---|---|
| 1 | Ṁ1,017 | |
| 2 | Ṁ420 | |
| 3 | Ṁ143 | |
| 4 | Ṁ88 | |
| 5 | Ṁ63 |
People are also trading
@FoxKHTML understood but this covers the range including 2/3 now (1/20-2/7). Unclear if it needs to be a different range, as the newest poll there is now after 2/3.
@FoxKHTML also unclear if the graph you want showing a specific day like 538 is going to be added or is hidden somewhere else/not loading for me.
@LiamZ There aren’t enough polls yet. In time a graph will materialize. We’ll look for the poll average as of 2/3 or a period beginning on or after 2/3
@FoxKHTML If there isn't a graph how will this resolve? IMO pretty unreasonable to resolve this No or N/A at this point - RCP average has him at net approval right now, so does Fivethirtyeight, idk why a graph is necessary to resolve?
@LiamZ Okay, resolving yes. At this point I’m wondering whether RCP will ever make a graph. But it’s clear that if they did, it would show positive approval in line with 538’s graph.
@traders looks like this will resolve yes, but I’m not going to resolve until rcp has an average posted for 2/3. Currently, it’s just a list of polls with the current average that covers 1/20-1/30. I want to be able to hover over the graph and pinpoint the average for 2/3.