Resolution source will be the JSON from VISHOP https://ads.nipr.ac.jp/vishop/#/extent from which I will compute the mean for March 2026 when the entire month's data comes in.
In the very unlikely event that it ends up exactly on a bin edge (i.e. 14.0000000), the bin edges will be interpreted as [low, high).
Question will resolve once March 2025 data from VISHOP becomes available.
If data is still unavailable by end of April I will consider N/A'ing the market. I'll leave the market open.
At the moment this market closes on April 15, as an arbitrary cutoff date to keep it open while data is outstanding, but will likely resolve earlier as the data should arrive well before then.
 1,000
1,000🏅 Top traders
| # | Trader | Total profit |
|---|---|---|
| 1 | Ṁ3,924 | |
| 2 | Ṁ85 | |
| 3 | Ṁ37 |
People are also trading
In the 18 years 2008 to 2025 the gains from 12th Feb to March average were
1 at -0.22
1 at -0.16
14 in range +0.14 to +0.56
1 at +0.63
1 at +0.69
Value is 13.57 on 12 Feb 2026 so roughly, before considering weather or other data, a 14 in 18 chance of being in range 13.71 to 14.13
Perhaps the low side tail stretches further while the high side tail is initially fatter but tails off faster and doesn't stretch as far? There is only 3 of 14 above the midpoint of 0.14 to 0.56 gain range.
More catching up of sea ice....
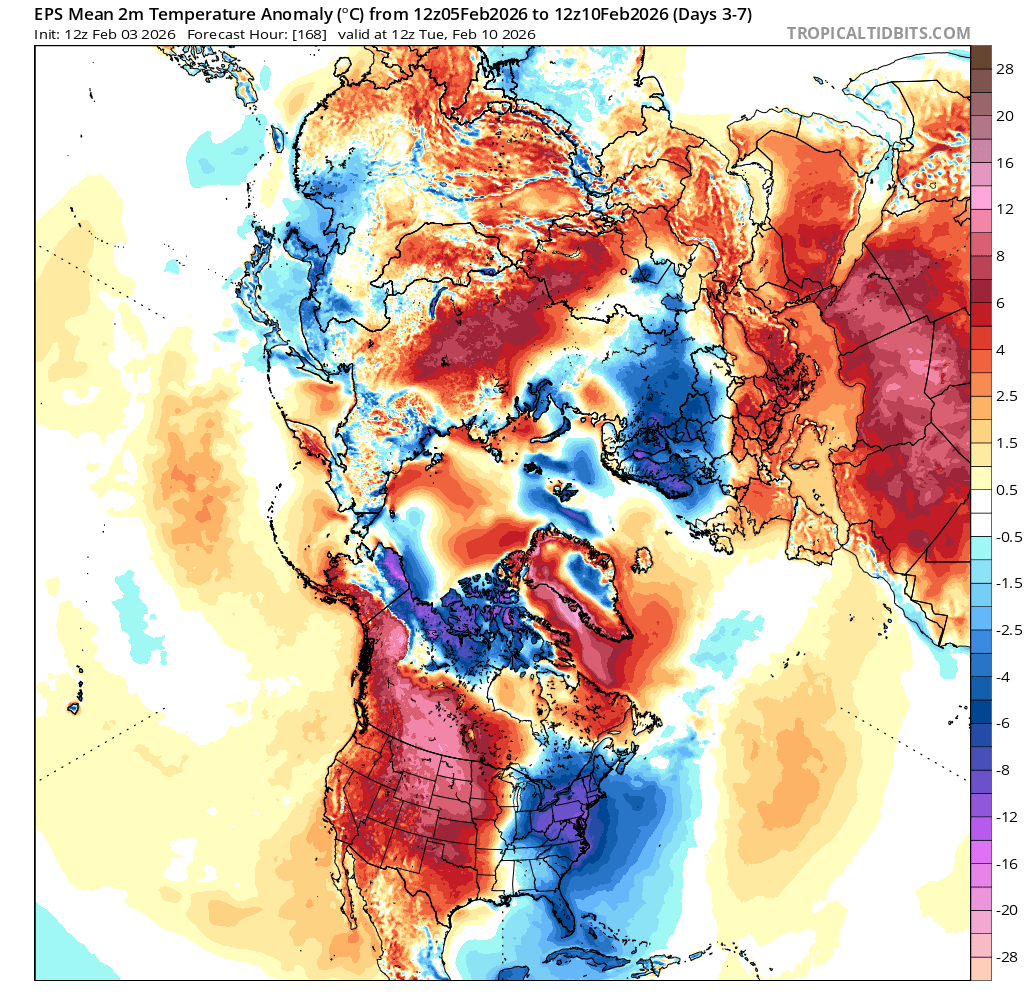
Although warm for the first 10 days of Feb ECM/EPS forecast, it looks more favorable in the middle of February with recent model runs.
Given the abnormal drop in Feb 2025 it looks less likely now that we will end up below 2025 at least for the March mean, and perhaps closer to the 2017, 2018 which would imply around 13.7 million km^2. Although, who knows what might happen in March....
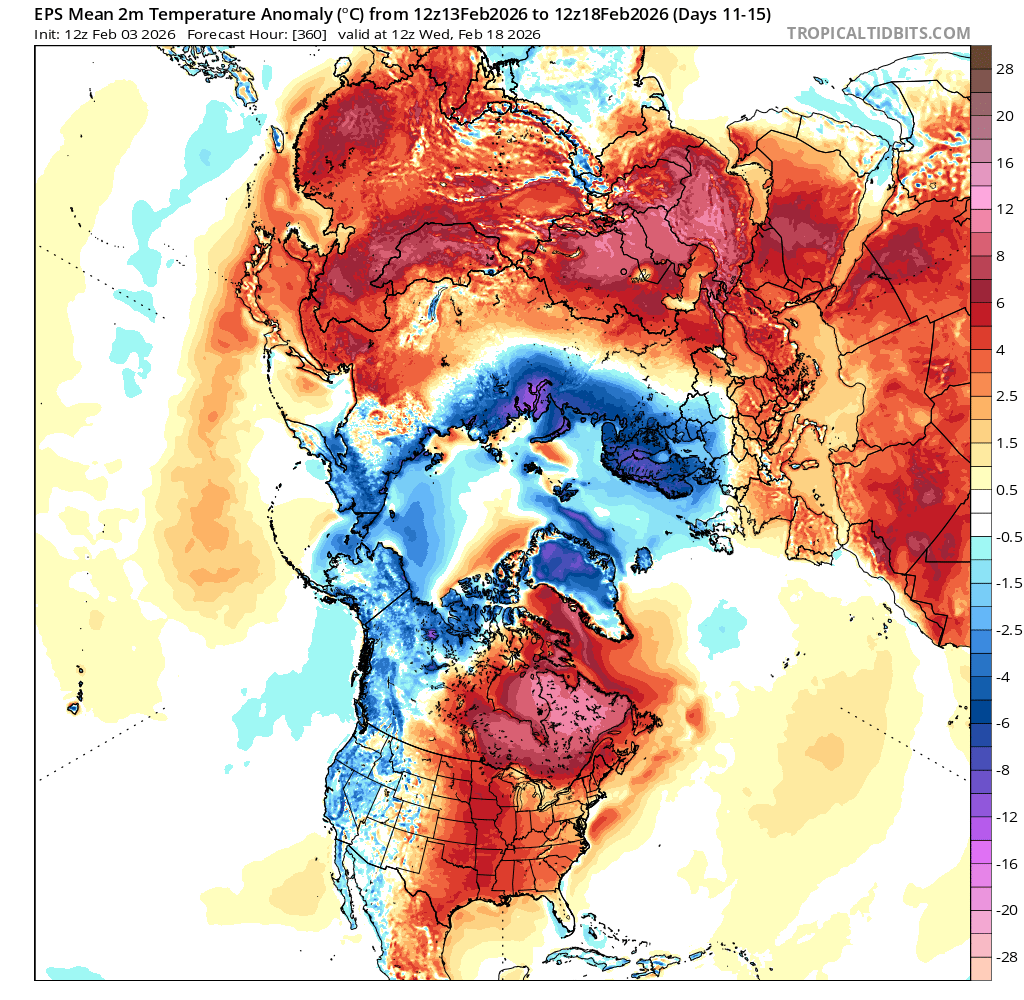
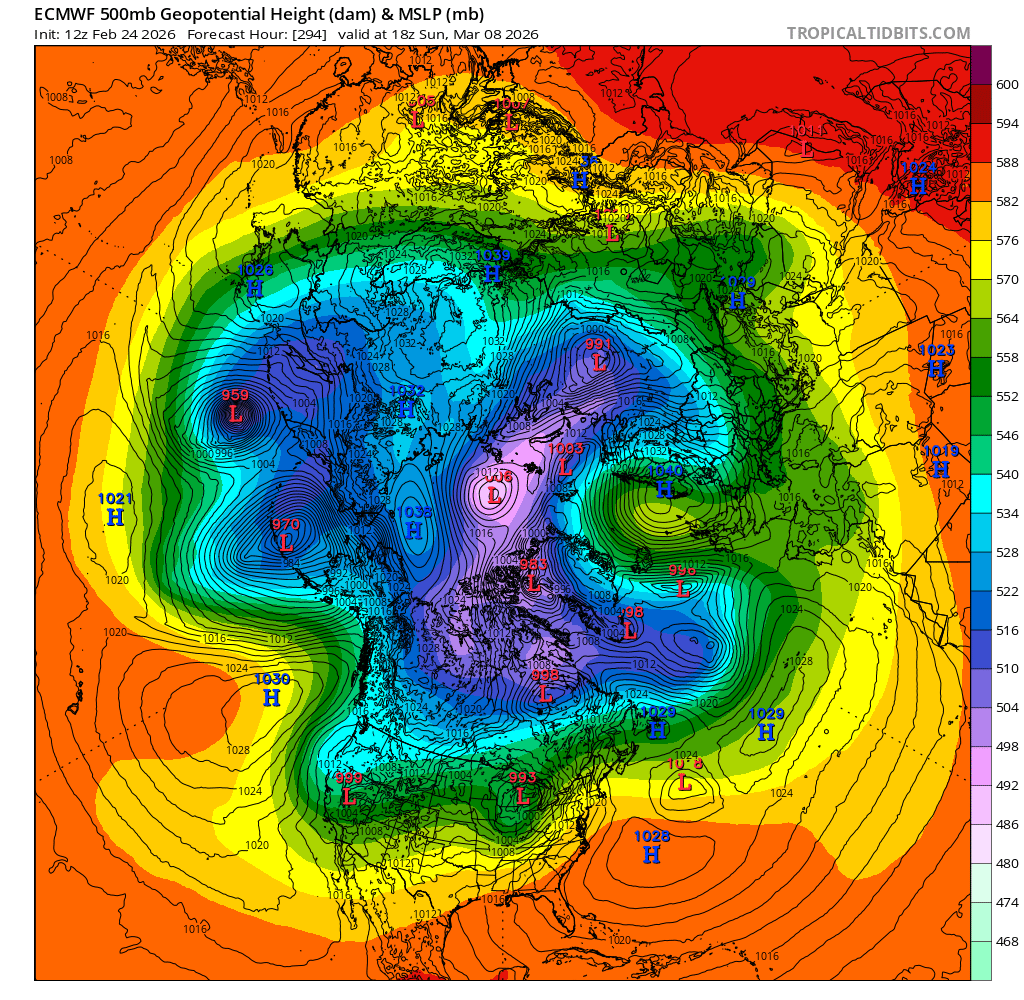
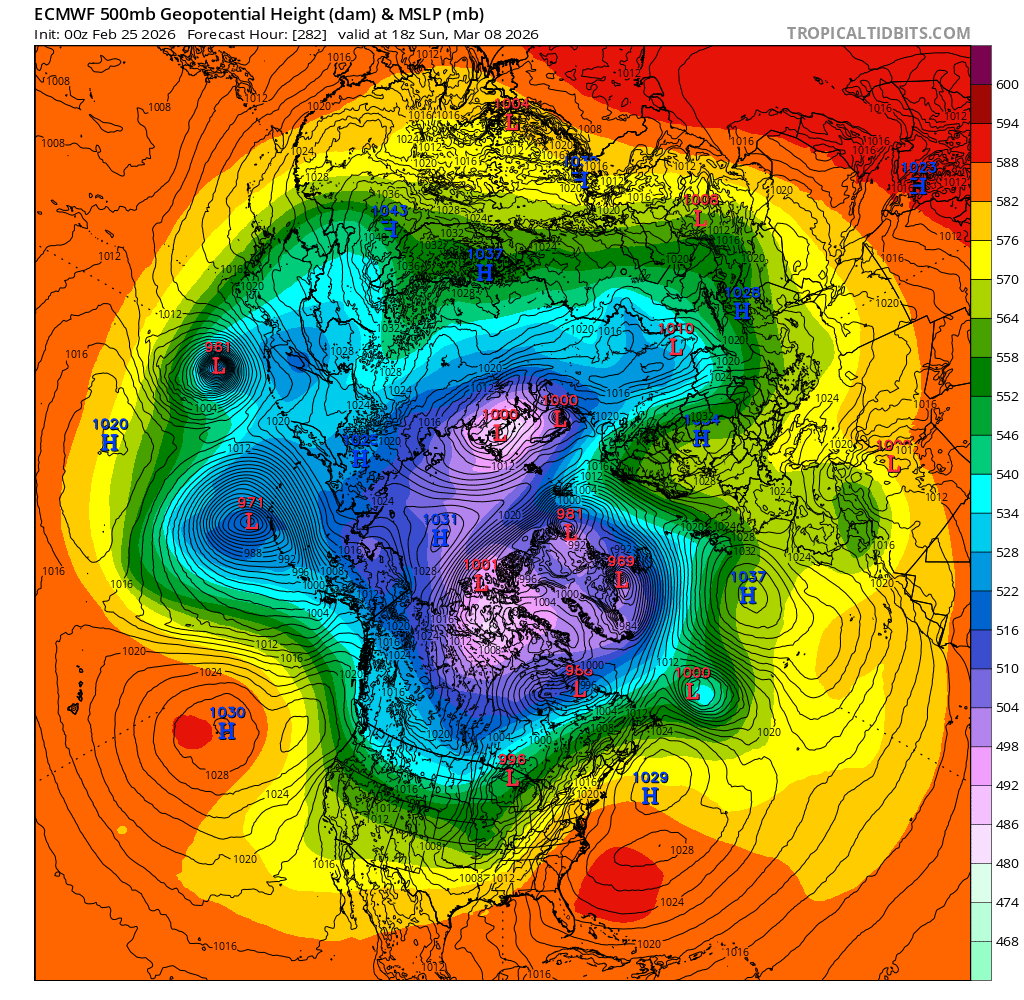
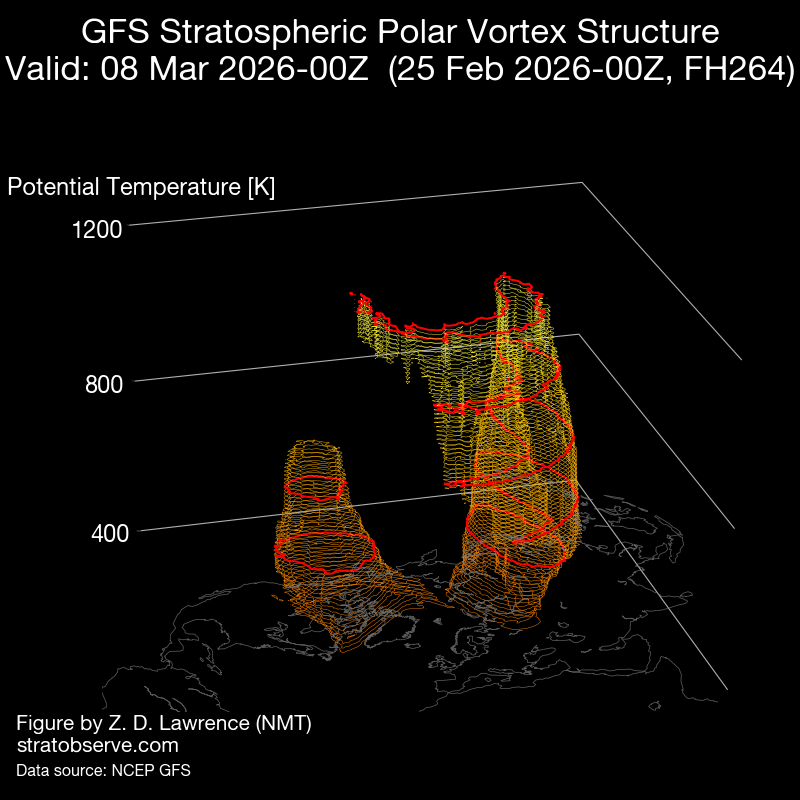
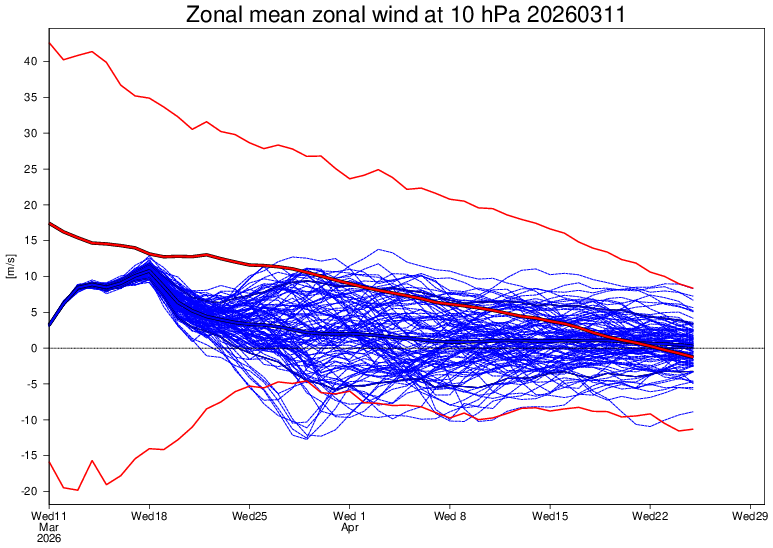
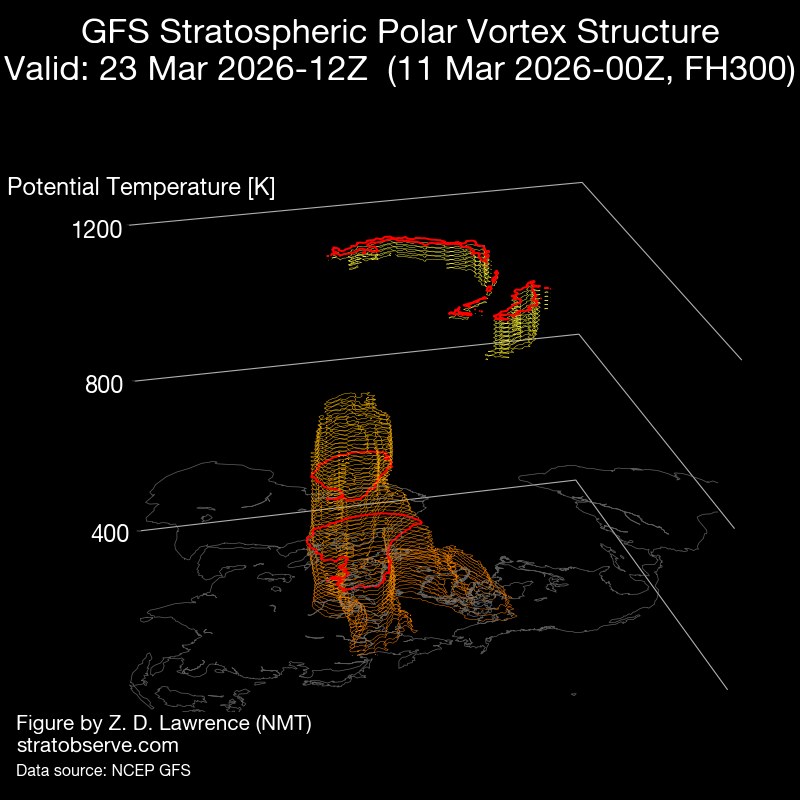
The PV split that may/may not happen after the strat. warming in the next 2-5 days is still uncertain but I'm leaning more towards a stretched vortex. The GFS analysis on stratobserve shows the upper levels of the PV being split while the lower levels keeping coherence, but its still very far out.. GEPS seems less bullish on a PV split from what I can observe. Similarly perhaps for ECMWF and the ensembles as far as I can tell...
@parhizj
The 5 nearest years to the value on 3 Feb 2026 13.29 which were
2018 13.28
2017 13.37
2016 13.37
2023 13.43
2019 13.43
The March average for each of these year ended up 13.68 to 13.97.
Perhaps suggesting that narrow range is likely.
However the 6th nearest 2012 ended up at 14.22.
Perhaps suggesting there is still considerable uncertainty. Should it also be taken to suggest the risk is on the high end?
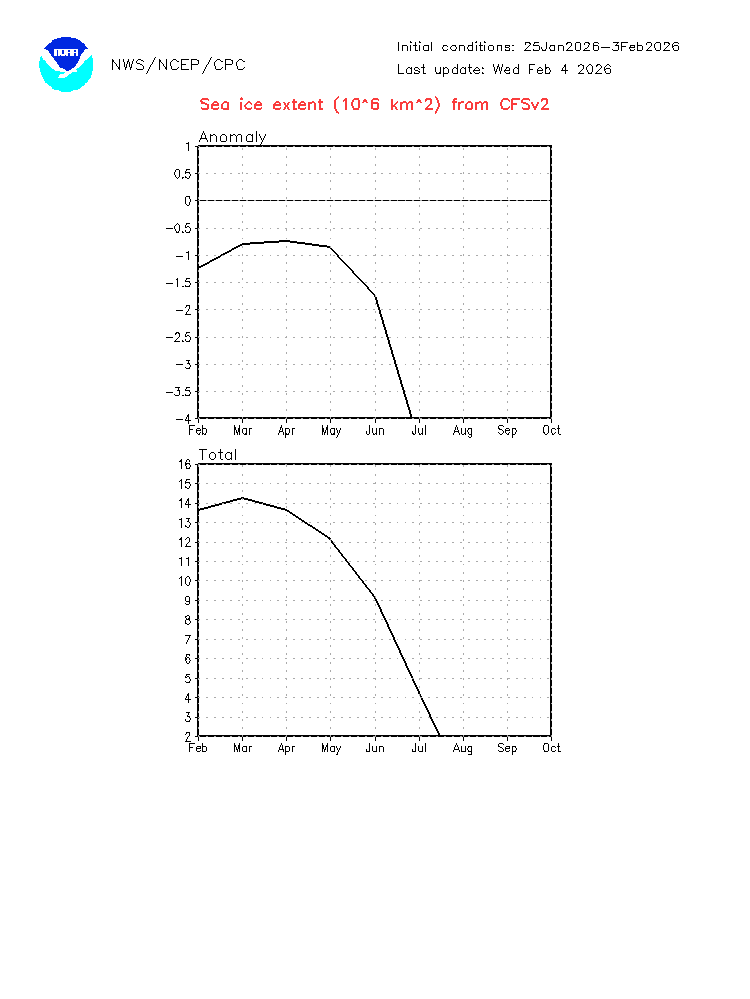
@ChristopherRandles The subseasonal models I recall are fairly good at forecasting sea ice extent one month in advance... The Feb. CFS run for March’s SIE is near ~ 14.2-14.3 which still puts it around ~14 to 14.1 for ViSHOP mean based on my earlier eyeballing.... (hasn't changed much at all)
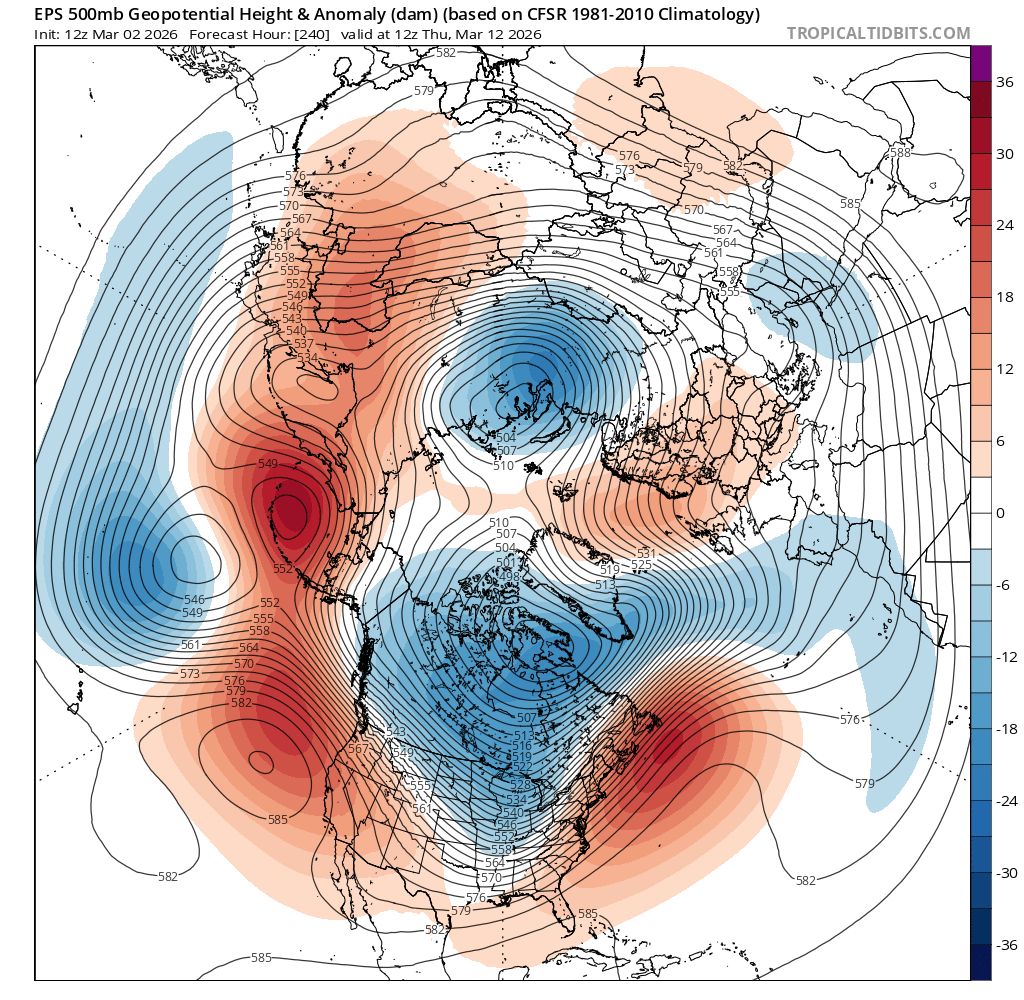
I also went through the 500mb anomaly maps for February from 1991-2025 using PSL's tool, and compared them to some of the subseasonal 500mb anomaly maps for February from tropicaltidbits (CANSIPS, CFS monthly and the more recent CFS weeklies also) . The closest analog seems to be 2007:
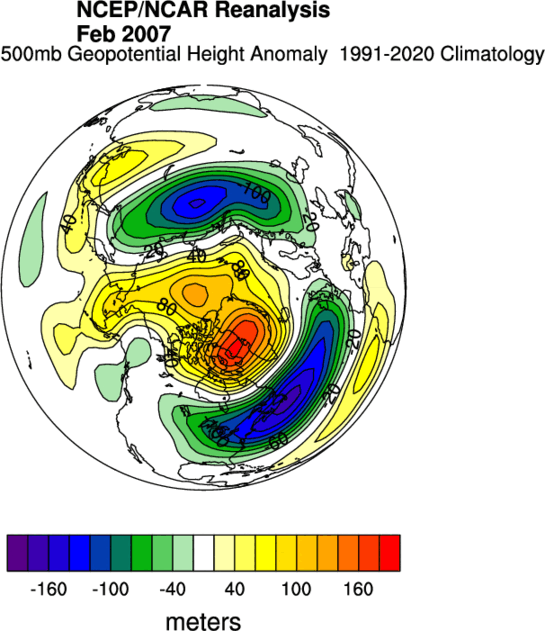
(I'm generally ignoring the difference in datasets and just focusing on the pattern)
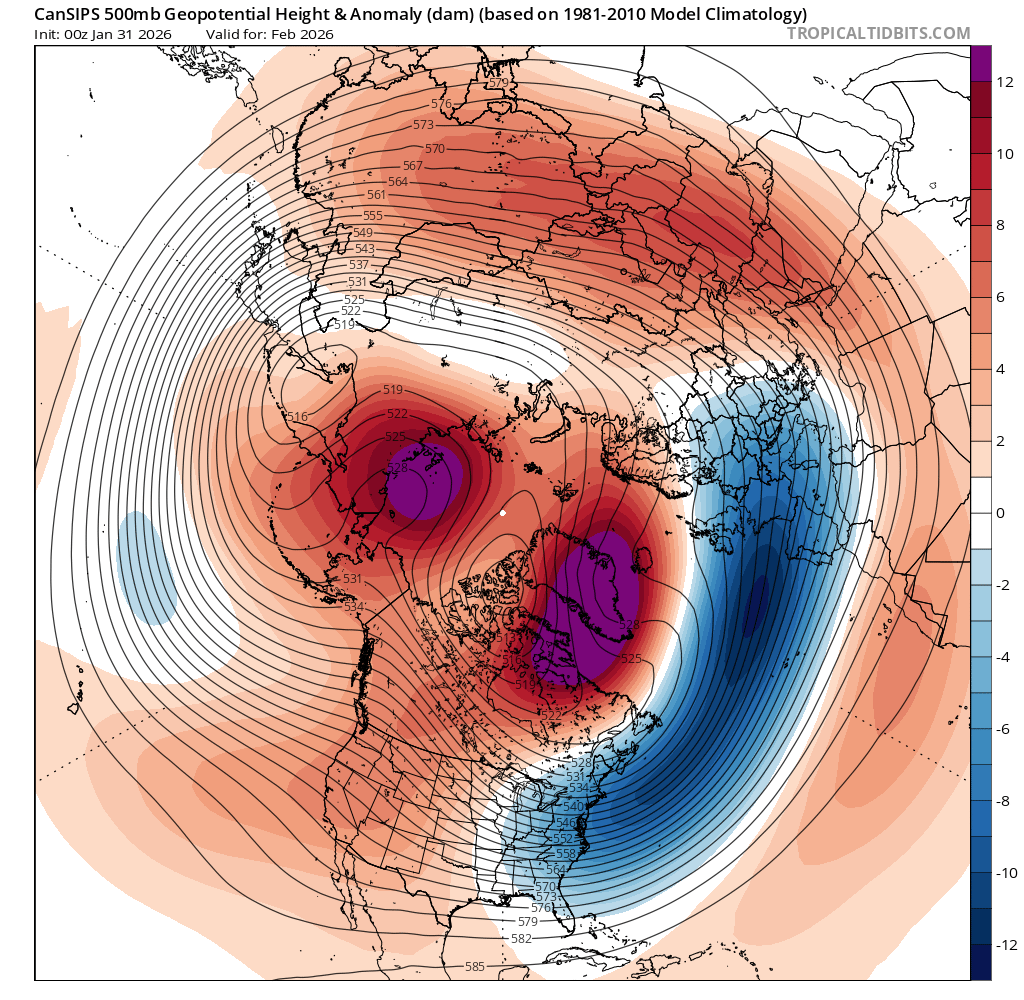
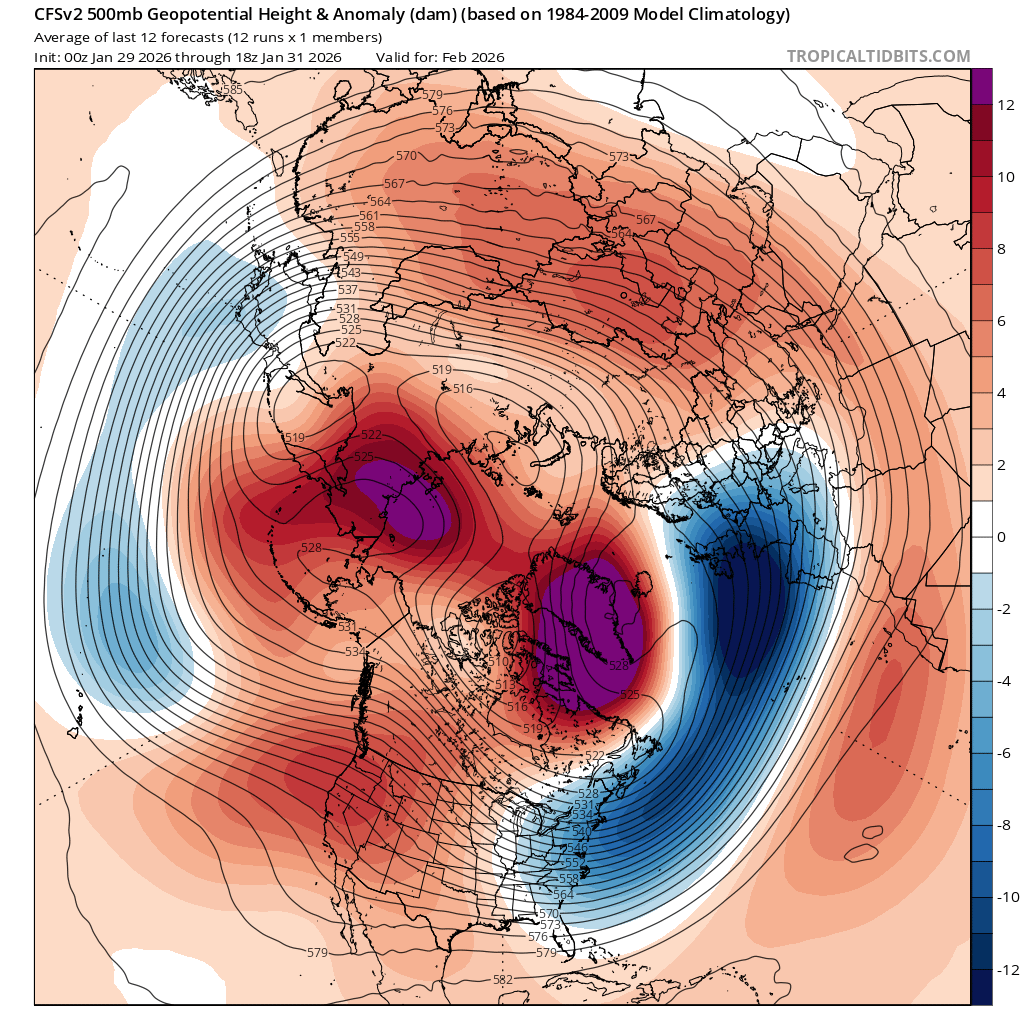
The weekly CFS shows more lows across Northern Russia than the earlier monthlies and a stronger Aleutian high.....
Looking at Feb 1 to Mar 1 daily 2007 from ViSHOP:
(14.11 - 13.79) = 0.32
Looking at your reference years and calculating the same daily differences from Feb 1 to Mar 1..
0.62, 0.50, 0.60, 0.48, 0.76
The mean from these five is then 0.59.
Given that we have had a steady strong rise for the first few days of February and with the conditions for more ice melt last year per the reasons you mentioned below (with faster reversion in this case) I think then 13.2 + 0.32 = 13.52 is probably a fairly good but weak lowerbound for what is reasonable to start off March 1 daily value. The mean of March is usually around 0.04 less then March 1 value, so I think 13.47 then would be a decent monthly lower bound for the mean. If we take the 0.59 value + 13.2 = 13.79 - 0.04 = 13.75 for a middle point prediction.
So yes, I think there is a bit more room for upside given the we still have a high CFS prediction, but subjectively 13.7-13.8 seems like a good bet then if we discount the CFS prediction and rely on these ad hoc methods...
@ChristopherRandles Daily vishop from 2/23 has dropped to 13.488
Still far out when models aren’t considered skillful but the trend has been increasing again for a PV split
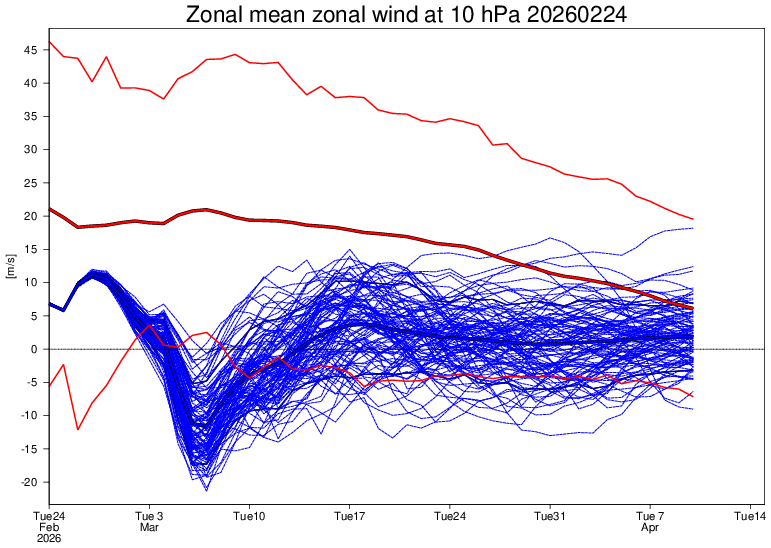
in which case it validates I would expect less buildup than usual and more plateau for March overall …
Based on the last daily vishop its between 2018 (13.663) for the date and t 2025 (13.324).
So +0.164 off 2025 and -0.175 off 2018, would be some weak evidence to put it on the lower end of the previous center prediction 20 days ago (13.75). So naively interpolating puts it around 13.63.
This might be on the low side given the recent priors of faster buildup when there is buildup and the CFS prediction.
Edit:
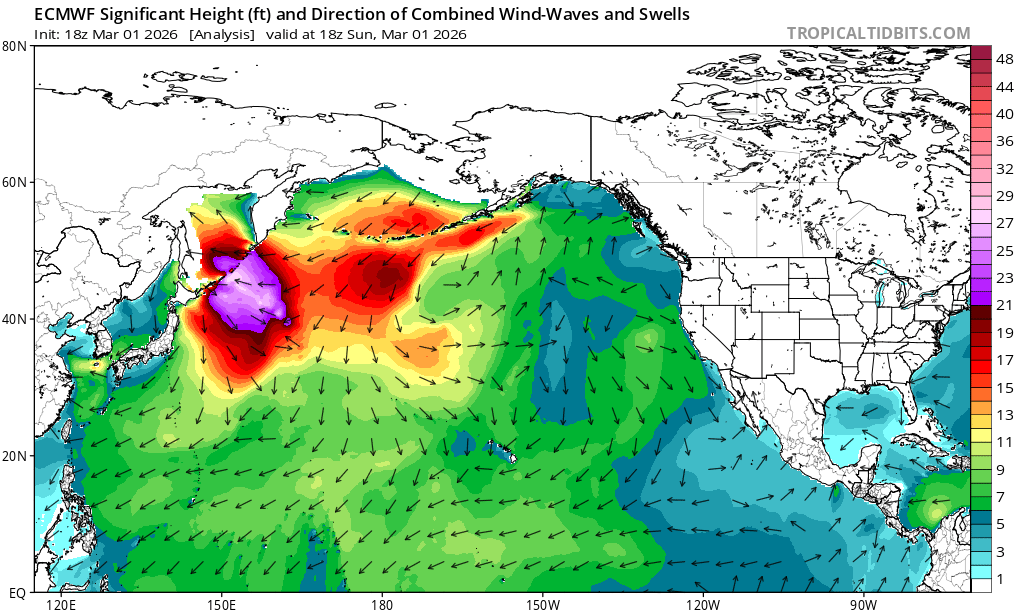
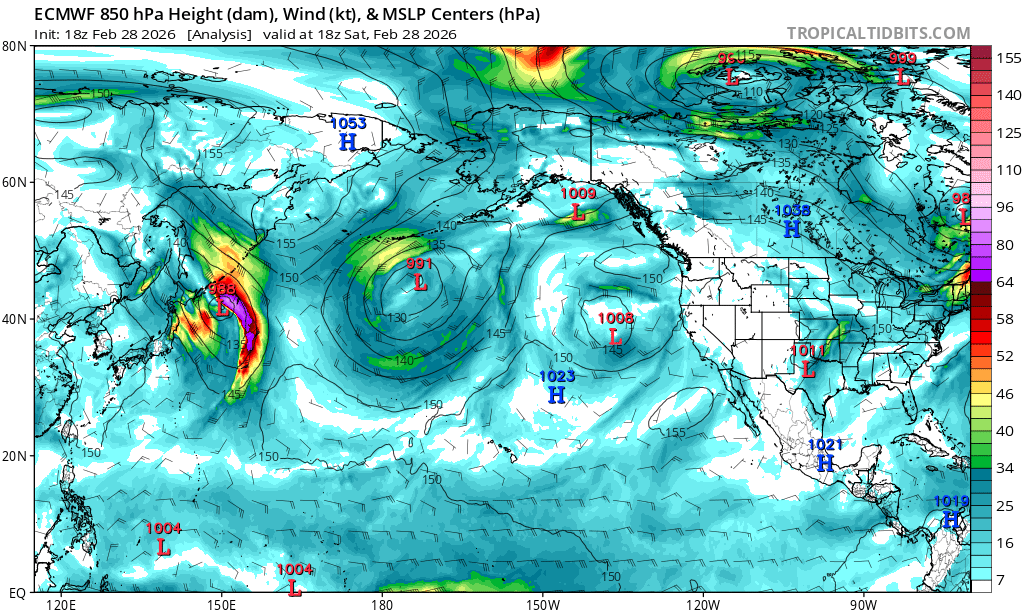
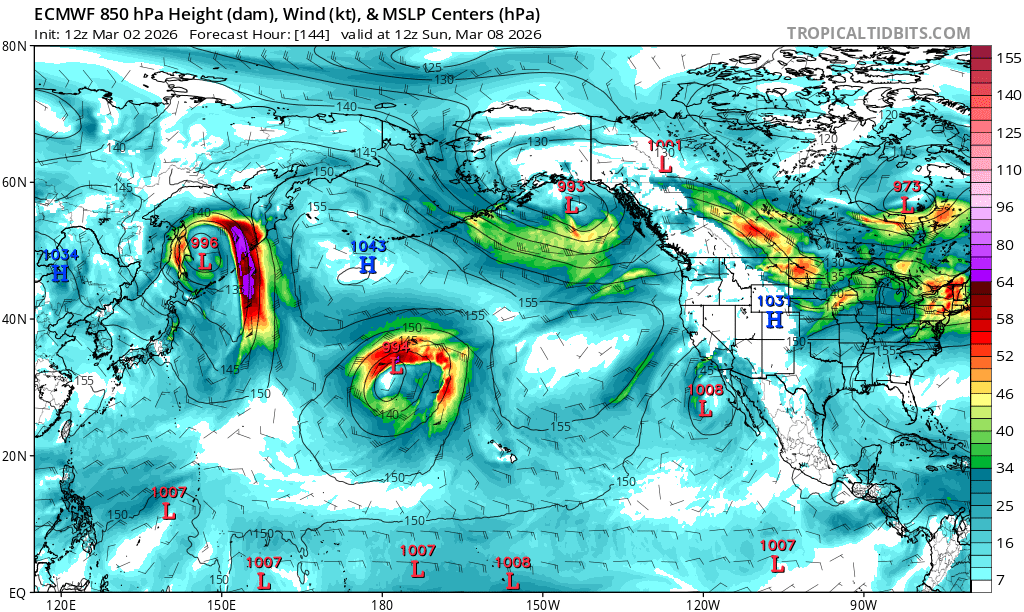
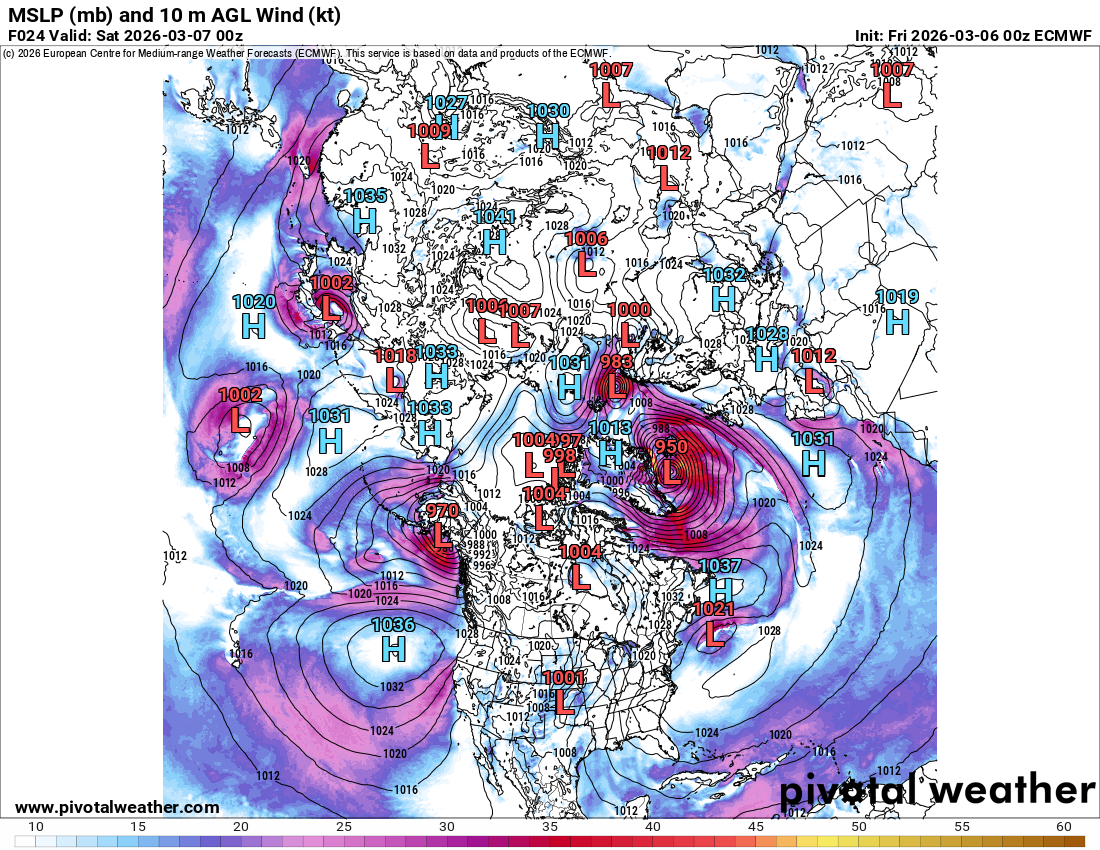
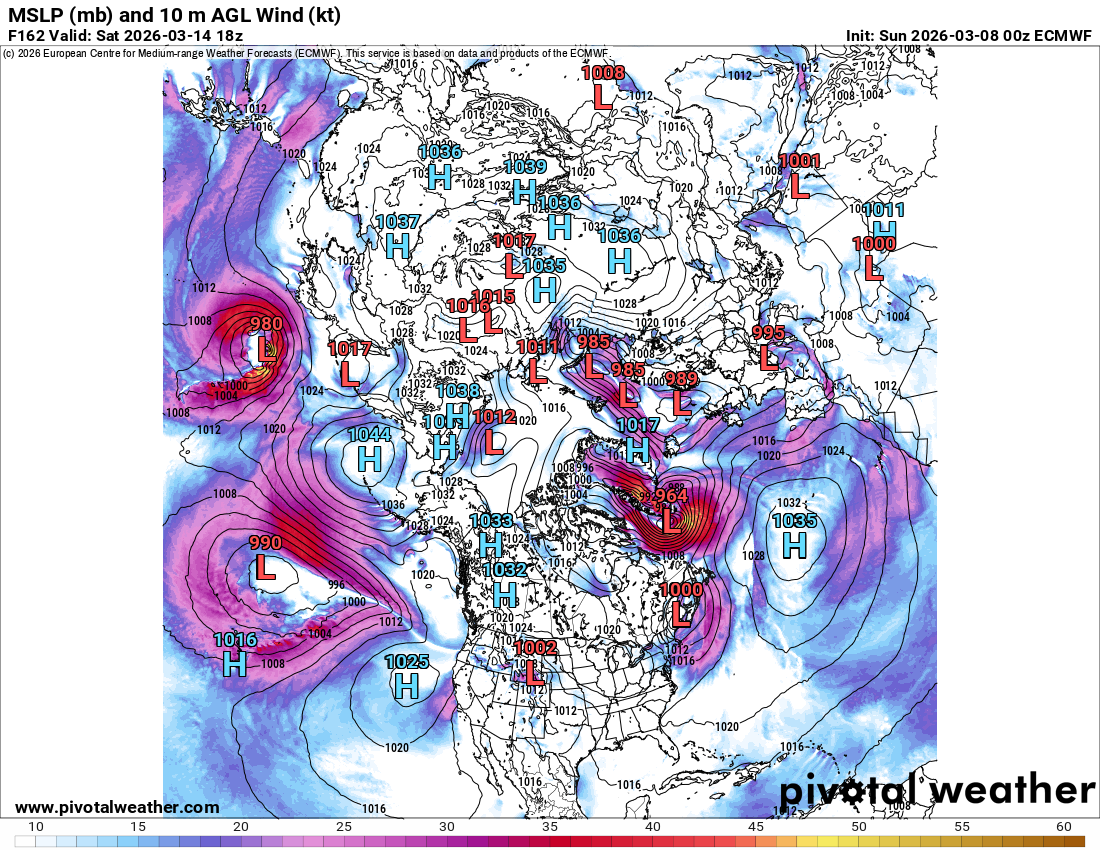
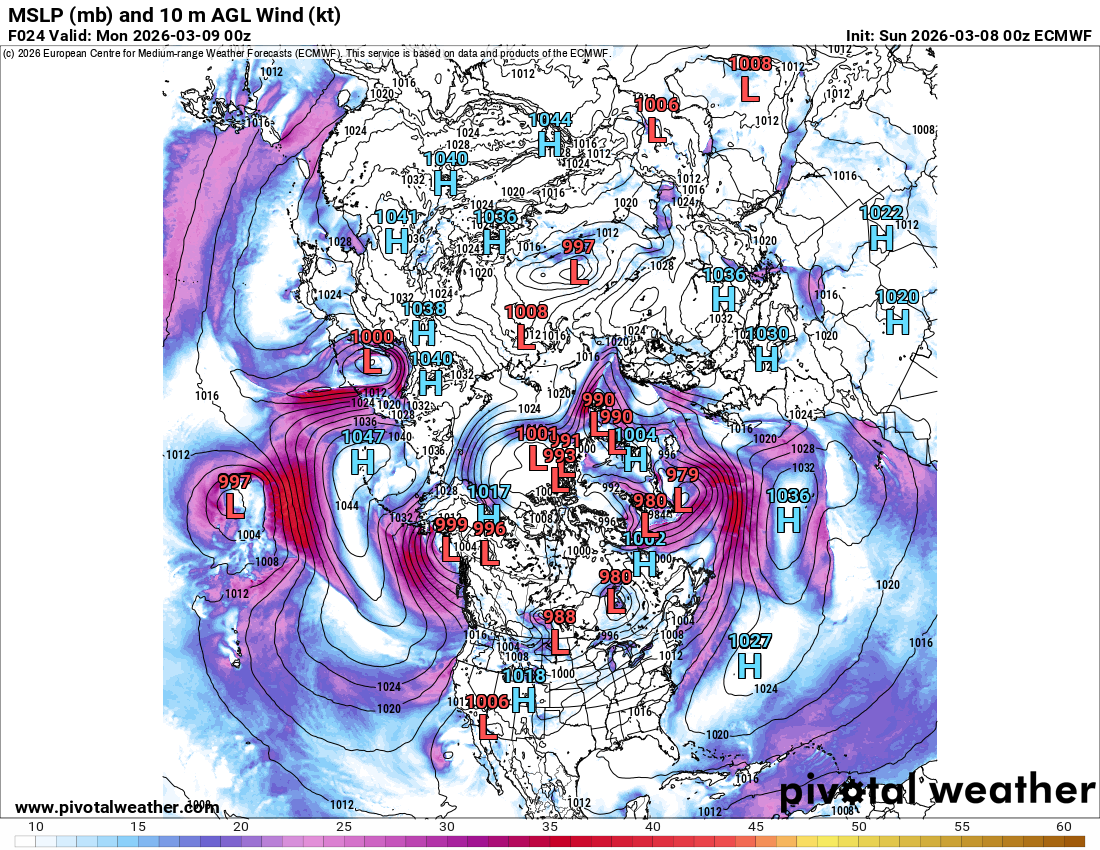
The omega block that has brought above freezing air temps to the Bering Sea should resolve soon after which from the last few ECM det. runs show there won't be further chances to disrupt ice build up in that region until the second week of March. Regardless of how many lows develop in the Pacific it won't mattter if the conditions don't favor them entering the Bering sea under the forecast synoptic setup. The 12Z run yesterday showed them entering whereas today the 00Z run showed them not entering (less meridional flow)
Still depends on how this potential split plays out to a large degree...
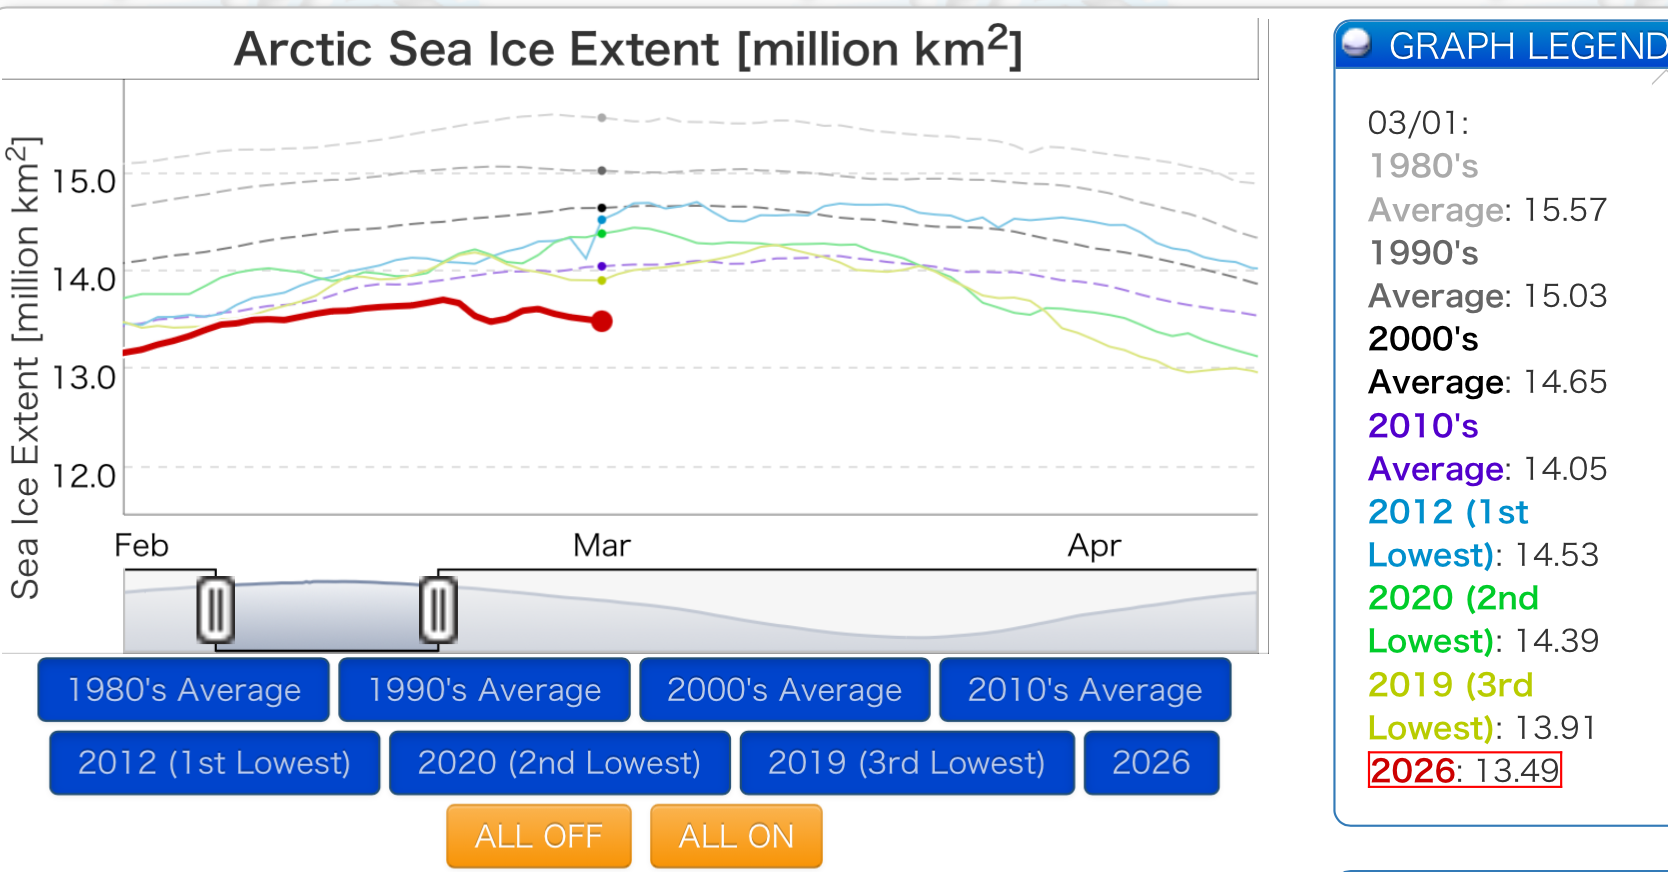
ViSHOP sea ice is 13.49 for March 1, same value as a week ago…
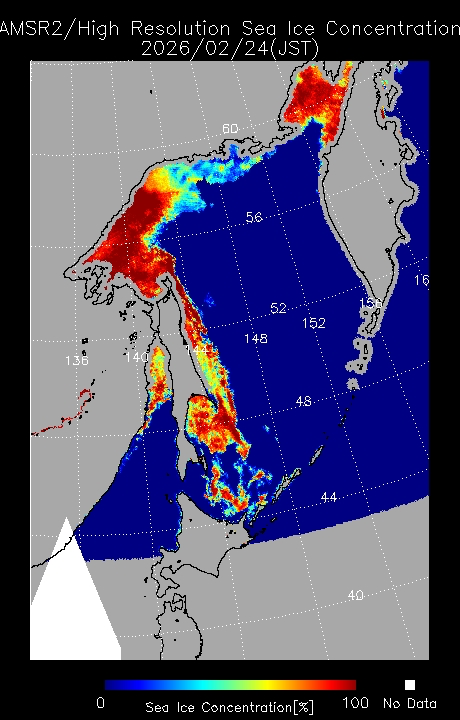
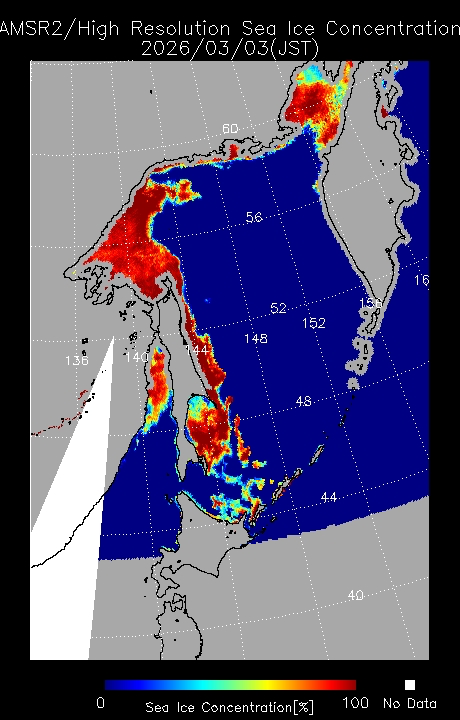
Sea of Okhotsk “lost” sea ice appears to have been compacted/become more dense under wave action and/or marginal air temps.. after a brief low developed
Another one is forecast to cross into the sea in about 5 days which should hamper any local build up again there similarly…
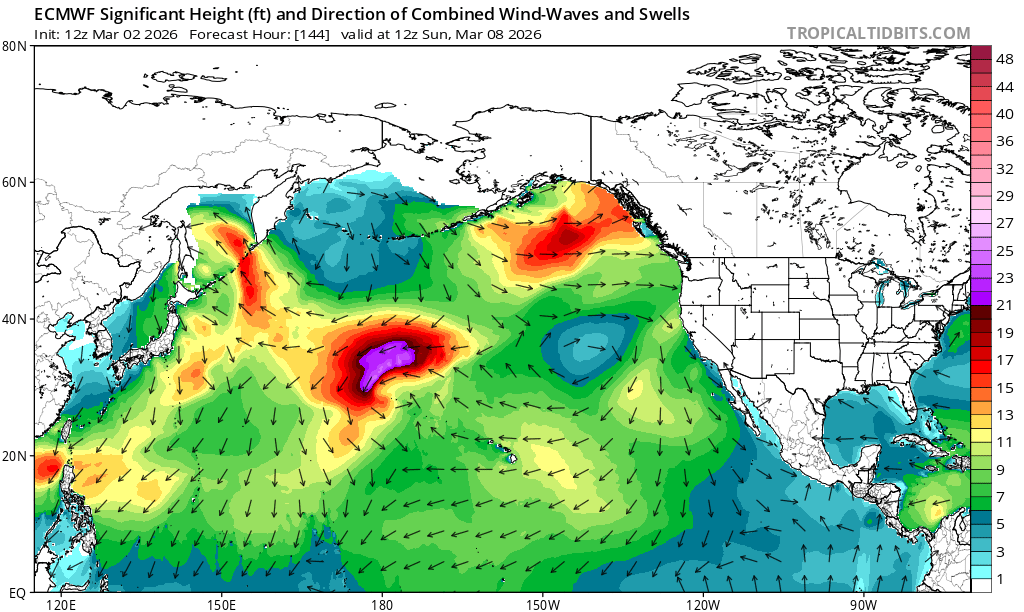
While in week 2 we will see potentially some of the sea ice in the Bering sea get compacted a bit and fail to develop further, when it appears the same low should drive unfavorable waves in conjunction with a high developing and bring above freezing temps for the areas needing more sea ice..
As for the Labrador Sea and Barents Sea ECMWF deterministic doesn’t show the same picture as the more averaged out ensemble (contours not in agreement like there was over the Pacific) is harder to decipher, but based on the det run it looks less favorable for development going into week 3 locally in those areas based on air temps.
Snowfall in week 2 looks also to inhibit further sea ice buildup in the Labrador Sea (assuming that the PV splits and the lows near there develop so, so this is a bit lower confidence).
~
The buildup in the Bering sea and Labrador Sea over the last week or so has countered some of these recent losses, so I do expect some slow buildup all other things being equal as they have been, at least until week 3, or so I speculate.
Based on this outlook for the next two weeks, I don’t expect a rapid jump like we’ve seen in some of the last 15 years. After that we can only speculate based on climatology and low skill CFS forecasts (especially since this will follow a PV split)…
it’s hard to tell but CFS does show less anomalous heat for the latter half of the month (this could just as well be an artifact of averaging/timing), so I would expect it to generally follow the climatology and generally plateau and decline towards the end.
~
That leaves me with the subjective impression of the forecast 5 days ago of being perhaps either around right or even a bit high, if we end up with a mean below 13.6, as that is looking slightly more likely at the moment then above it. I’m not sure I would bet so heavily on the 13.2-13.4 bin being more likely than the 13.6-13.8 bin as it currently stands..
~
On what I’m sure is a completely unrelated topic, a cool video of a bird walking on top of waves of sea ice:
https://x.com/equine__dentist/status/2028576223413112860?s=20
@parhizj Thanks for the analysis.
Not sure I agree with your bolded conclusion though. (possibly badly calibrated?)
Taking first two days of March plus movements thereafter for years 2008 to 2025 I get
under 13.2 1 and it is only just under
13.2-13.4 6
13.4-13.6 8
13.6-13.8 3
You seem to be suggesting we are more likely to get plateau than aggressive growth so that implies less chance of 13.6 to 13.8 than 3/18 = 16.7%
I have reduced 13.6 to 13.8 from 21% to 18%.
I also moved more in favour of 13.4-13.6 rather than 13.2 to 13.4 but that could be wrong and I perhaps should pay more attention to your forecasts of limited growth and treat 13.2 to 13.4 as the most likely bin in spite of my numbers above suggesting 13.4 to 13.6 as the most probable bin.
@ChristopherRandles I would be somewhat surprised if we end up in the 13.2-13.4 bin, but this seems to be quite to depend on what is your reference case is for the first half and second half of the month.
(Subjectively, I think 2025 or even less than 2025 as far as day-over-day changes is a fairly reasonable proxy for the first half of the month).
For instance, considering an ad-hoc method of using the day over day deltas, if we end up with 1/3, 1/2, or even 3/4 the change (i.e. 1/3 * day over day deltas starting from March 2nd value), through the first 15 days of March and normal deltas afterwards (based on the subjective outlook I provided), then it depends greatly on what you use for your reference period since the March trendline changes greatly based upon on it:
a) If I use 2025 as a single case (my favored proxy): I get a mean for March of 13.52, 13.56, 13.63 respectively (where it generally rises fairly decently for the first half, then drops substantially.
b) Using a 2000-2025 average for each day over day delta, I get now a downward trend for most of the month (with most of the decrease in the first half actually), with a mean of 13.36, 13.32, 13.26 respectively. Subjectively I don't find this plausible based on my outlook (I expect some very modest sea ice uptick in the next 10 days, but not a plateau or negative), but on the other hand taking only the recent day-over-trend this seems very plausible.
c) If you use the entire dataset: you get a modest increase in the first half of the month, and a much milder decrease in the latter half, with a mean of 13.45, 13.46, 13.48.
If you don't discount b) for the first half of March (which I do) then I think its probably a good idea then looking at all these scenarios to favor the lower 13.2 - 13.4 bin more then the 13.6-13.8 bin.
Haven't looked at the models but glanced at polymarket which covers the other nsidc and the daily max:
Unfortunately the market looks illiquid and the probabilities don't add up to 100% but the most crowded bin is 14.2-14.4, with yesterday's NSIDC value of 14.113, so they are anticipating some modest growth also as far as the daily max.
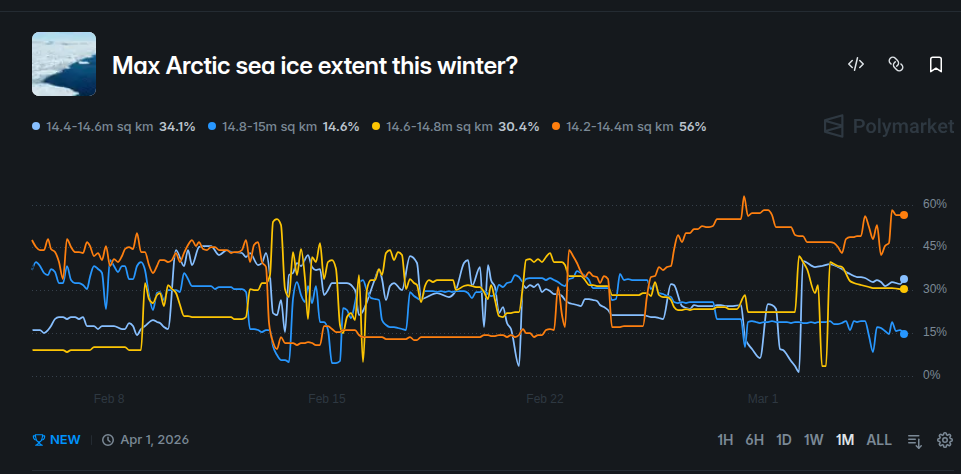
If you take the bin mid-point of 14.3 as the expected value of the market, for reference, this is slightly less than half of the explosive 2025 growth for March: ((14.3 - 14.113) / (14.307-13.908) = a factor of 0.47 (which would put it in the middle one of the above three scenarios for 2025 (a month mean of 13.56)).
You can also try to in an ad-hoc way to interpolate using the change (using the latest ViSHOP value) until Mar 15th at this rate of growth (with a scaling step between the datasets fixed by the Mar 4 ratio):
((((14.3 - 14.113) / (14.307-13.908))) * (14.197 - 13.908)) * (13.59/14.113) + 13.59 ~= implies a daily value of 13.72 in ViSHOP dataset by March 15, after which you can follow whatever reference you like (2025 had a few days of further growth which seemed not impossible) but I expect it should generally decline on average, and usually slightly faster than it rose and ending up deeper than the month start (so still below a 13.6 mean).
@parhizj >"a) If I use 2025 as a single case (my favored proxy)"
"b) Using a 2000-2025"
These seems a little strange to me. I see 2025 as an extreme low outlier perhaps (most particularly so early to mid Feb). The consequence of this is that the year is likely to have a late peak. We are trending towards slightly later peaks but it is not a huge effect with one year, I think the ice level and amount below trend is likely to be a more significant driver of a late peak.
So while we may be trending to more of a 2025 pattern, I don't think 2026 will be as extreme as that (though I don't discount noise making it more extreme). So 2025 as favoured proxy seems to me to be suggesting too high a level and a single case isn't good for calculating probabilities. 2000-2025 seems to be using data that is too old too much and tends to favour lower values as the peak tends to be earlier in those early years and the ice pack and thicknesses are quite different.
Using an average of years gives you an average result and you don't see the noise that can give different results.
Using 1/3 or .5 or .75 of daily moves means you are reducing decreases and making large decreases seem unlikely? This seems like it is improperly reducing the noise? Maybe you need to half increases and use 150% of decreases?
I am using 2008-2025 each as an individual set of movements and am thinking maybe I ought to down-weight the earlier years in this period. Without doing that after 13.59 on 4th I then I get 4 of 18 years in the 13.2 to 13.4 range and if you are expecting low increases (or larger decreases) compared to typical in the next 11 or12 days that should make that range more likely? I get 11 years in the 13.4 to 13.6 and 3 years in 13.6 to 13.8
@ChristopherRandles I don’t think there is any thing wrong with what you are doing - i just am more admitttedly ad-hoc since I want to try to put as much of my intuition as possible into it. As far as down weighting earlier years that you are thinking about I don’t have an opinion which reference case is best, but I’d like to do an experiment once where we find which years are “recovery years” following a lot of melt and adding them to see if that distribution for March day over day changes is noticeably different from other arbitrary reference periods. In summary I have no disagreements with the basis for your current calculations.
This is all just best guesses since the synoptic situation is still highly variable in determining whether we get a modest drop or a large drop in the last 10-15 days or so, but yes I agree with the next 10 days in anticipating we won’t see an extreme 2025 rise, after that I am bearish on predicting confidently how much it will drop on average day over day for the remainder of the month, not only referencing the dynamic models but any statistical analysis.
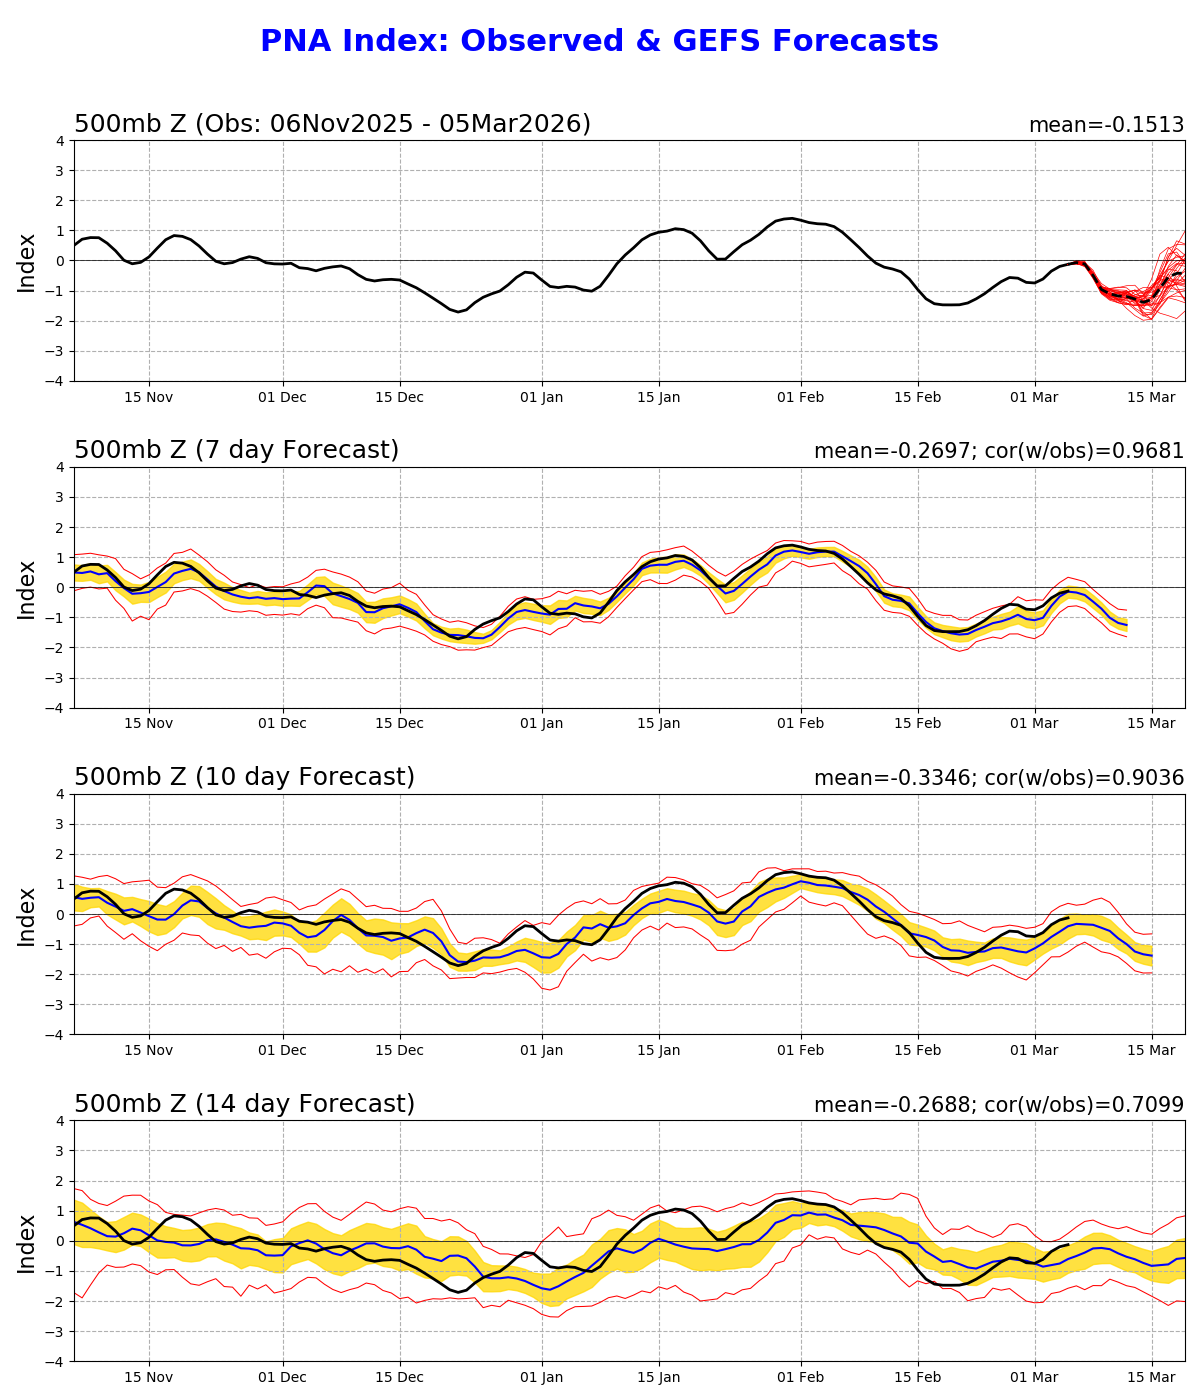
I.e. the PNA is trending more neutral in 15 days but I wouldn’t bet a dollar on whether it’s going to end up neutral positive or negative then despite the high historic correlation, given the effects from the PV split will have started to propagate by then. And this even then will only partly determine whether we see more or less buildup in the Bering or Okhotsk sea, since we might have more wave action from lows passing by, or another blocking high persistently develop over the Bering sea.
Again, I’m going more along the line of thought that the processes and states (patchy, new ice) in 2025 are more comparable to 2026 than a previous decade, with freeze up rate being less favorable in 2026 than 2025 for reasons stated and less stable sea ice (more to lose in the Bering Sea). I don’t think there is any problem with using the factor on the day over day changes for three scenarios mentioned since I am aware of what the trend is for the first half for each scenario, and since what matters is the mean over the 15 day period and the simulated value on the 15th (after which I follow the regular day over day changes).
For reasons mentioned it’s hard to pick a good subset range for statistics that matches when you think it might rise and fall and by how much, but this is sort of beside my point for the second half of the data as I was only going out on a limb for the first half of March based on that outlook. For the second half of March I mostly just stuck to the regular day over day changes there afterward for each reference subset. I only explained by I disfavored (b) based on the first half of the month’s outlook, since that was a generally bearish trend that disagreed with my modestly bullish outlook.
For your point about 2025 being a singular case being too noisy or not a good proxy I understand your perspective, I just have a difference of opinion with respect to what is proper or not for the best reference, as I think though since we are going to likely end up with the second lowest or lowest maximum on record along with last year also being being so low, that taking the last year as a reference is still ok (if sketchy) at this point considering if we still have a lot of melt left over from summer, and is perhaps more appropriate than just any arbitrary window of a previous decade or two which will be far from representative from the lack of multi year ice and hotter climate. I’m not sure which is sketchier to be honest.
@parhizj You were quite right to warn me against 13.2-13.4, ice has bounced back up to a new maximum so far of 13.76 for 7th and 13.2-13.4 is looking very unlikely now.
@ChristopherRandles We'll see; can't have much confidence in the models for this but its worth a look to see. The ECM analysis and diagnostics from ViSHOP confirm the northerly winds from that low over Alaska really helped with the sea ice advancement over the Bering sea the last couple days, but that should stop and possibly even reverse the development locally there from today as a blocking high is supposed to sit there for the next ~8-10 days (no northerly winds and above freezing temps for parts). Net its still hard to tell and add up all the subjective expectations, but I'd still expect closer to a plataeu than a steep rise like we've seen over the next few days.
~
~
Can't tell if the Barents sea is net unfavorable/mixed/favorable as its too variable and the charts I have are too busy (the melt from the last 10 days there has helped recover some but I think it will need some more favorable winds than I see to develop substantially at all) ... should'nt be entirely downhill in the next week (looks like a couple favorable days), but for what is covered by the model for week 4 it looks bad (still far out though)
~
Who knows what the end of the month will bring though since the development of those lows and their position is highly sensitive though...
In the Labrador Sea ECM det. has a much wider area of cold air there compared to EPS
Although there is some snow I think its less of a factor that I thought previously (as advancement should matter more since there is not enough time left), but the conditions look mixed until 10-15 days from now in the Labrador Sea where the waves become less disturbed and there is more steady Northerlies.
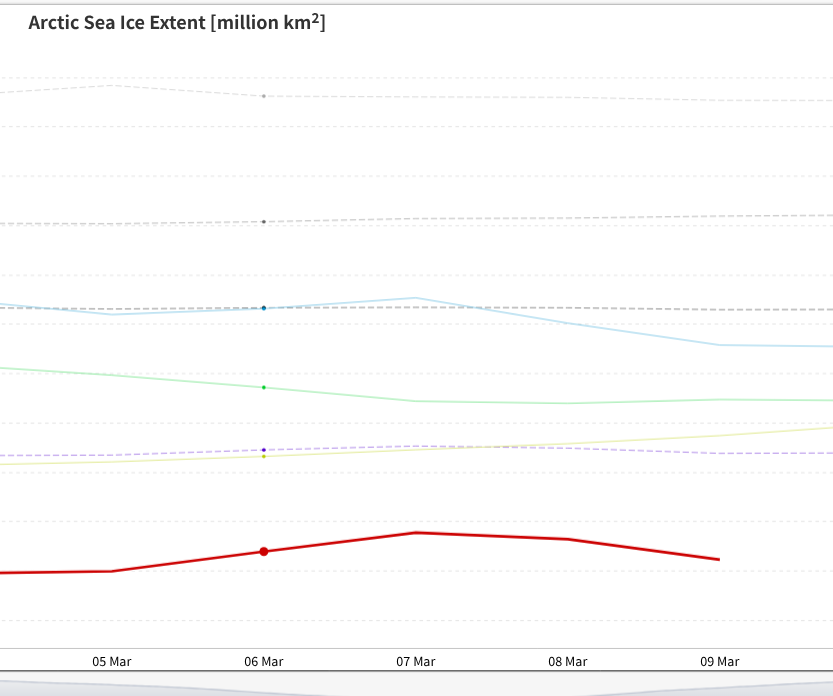
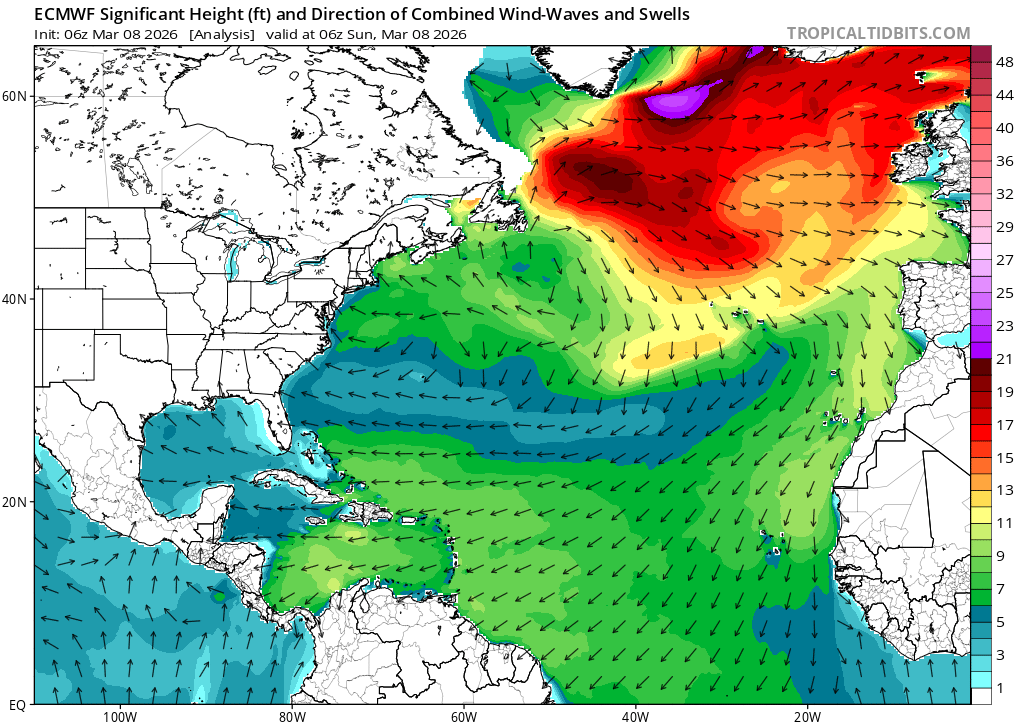
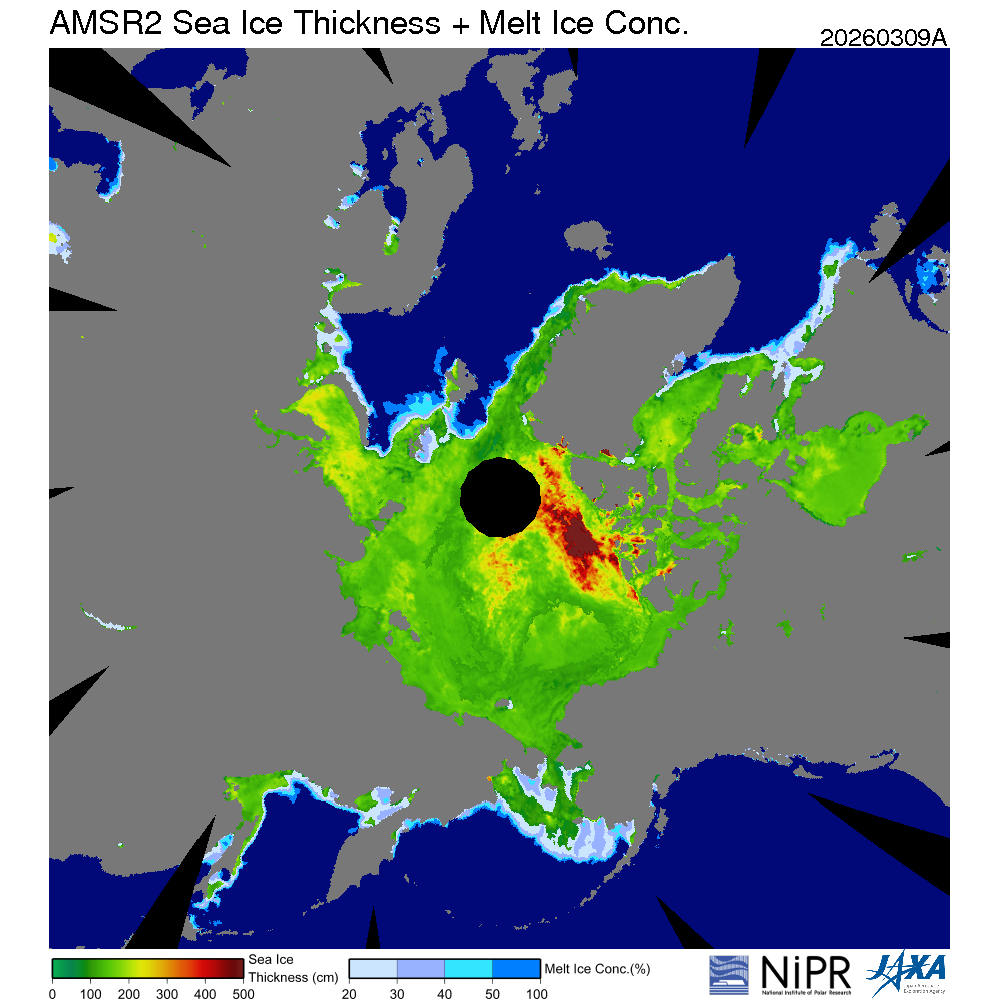
This is mainly diagnostic (backward looking) for the last 3 days, as we are slightly below where we were on March 6th after that modest climb (13.65 on March 9 vs 13.68), validating so far 😅 the forecasts from the last week expecting a modest climb on average with some occasional dips, and from the more recent forecast plateauing in the short term ...
(ViSHOP chart)
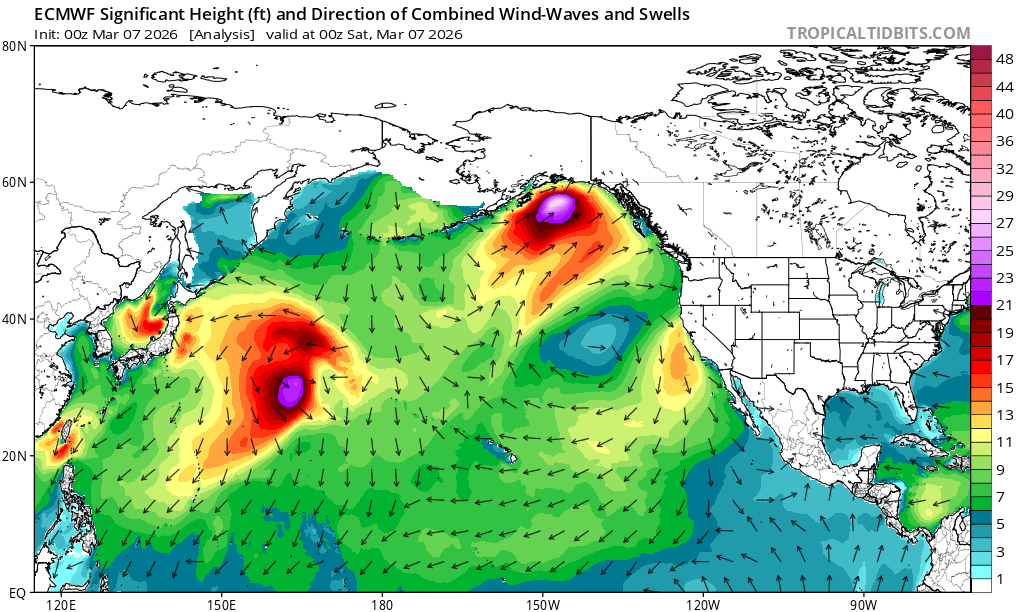
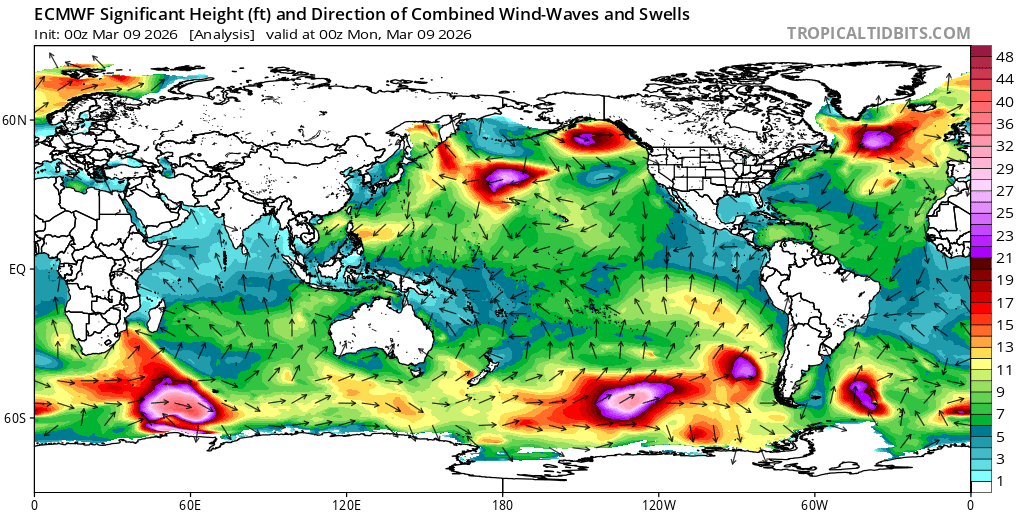
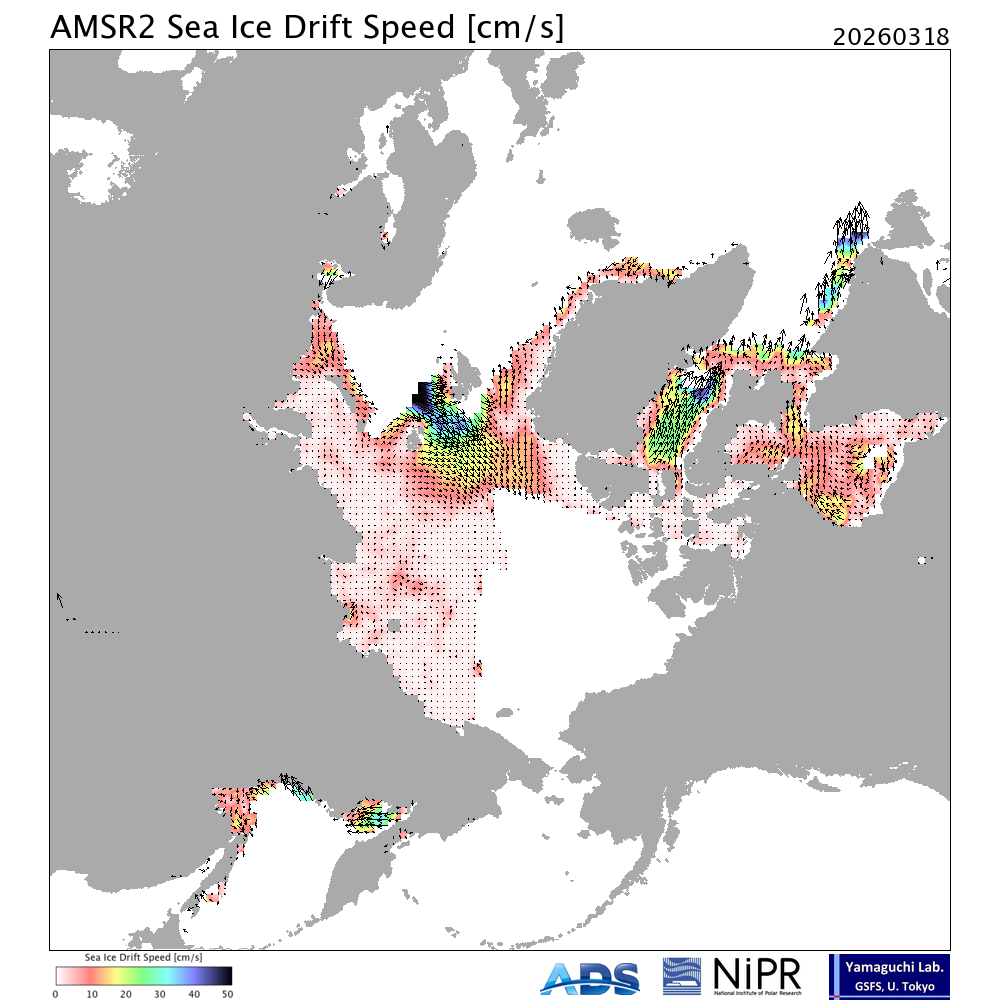
Notable is Gulf of St. Lawrence loss a substantial amount on the 8th as a low further poleward displaced the freezing air and brought above freezing air and 10-15ft waves on the 8th over the area (not much drift on the drift vector product, but lot of it looks like it got converted into melt water).
~
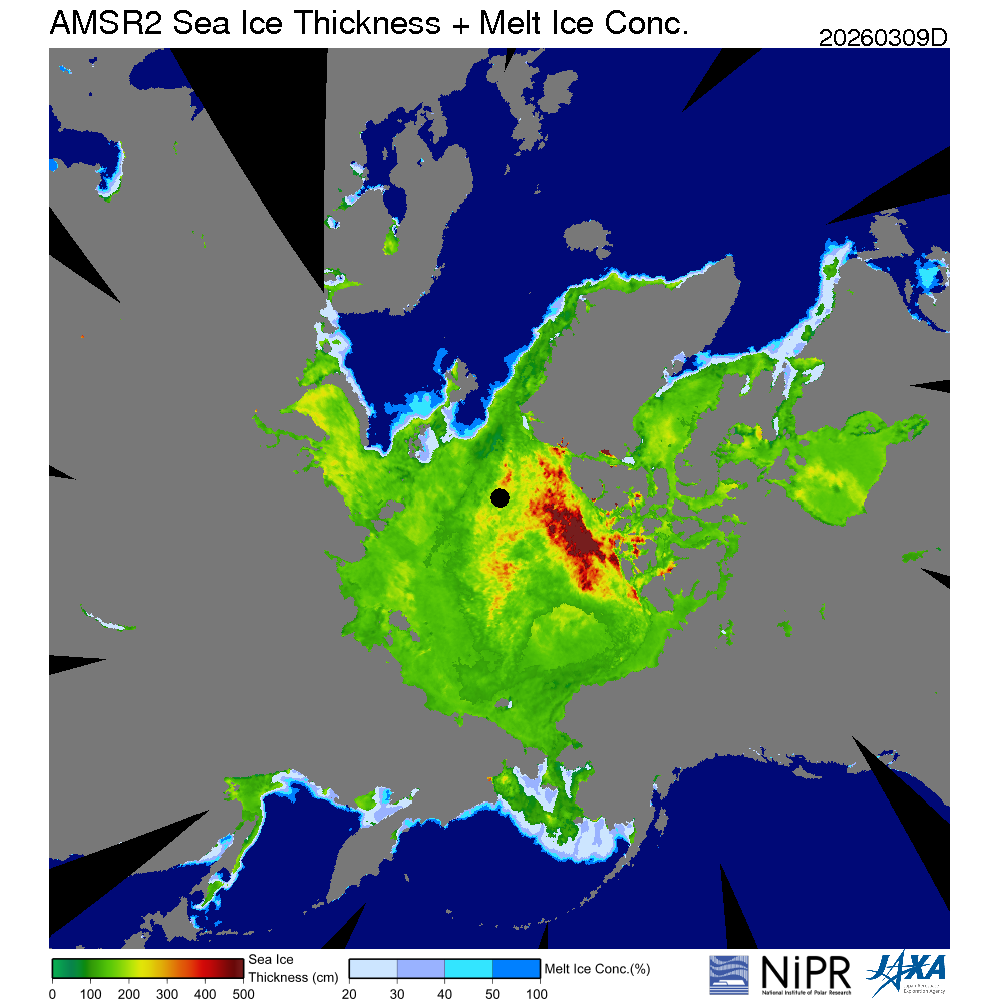
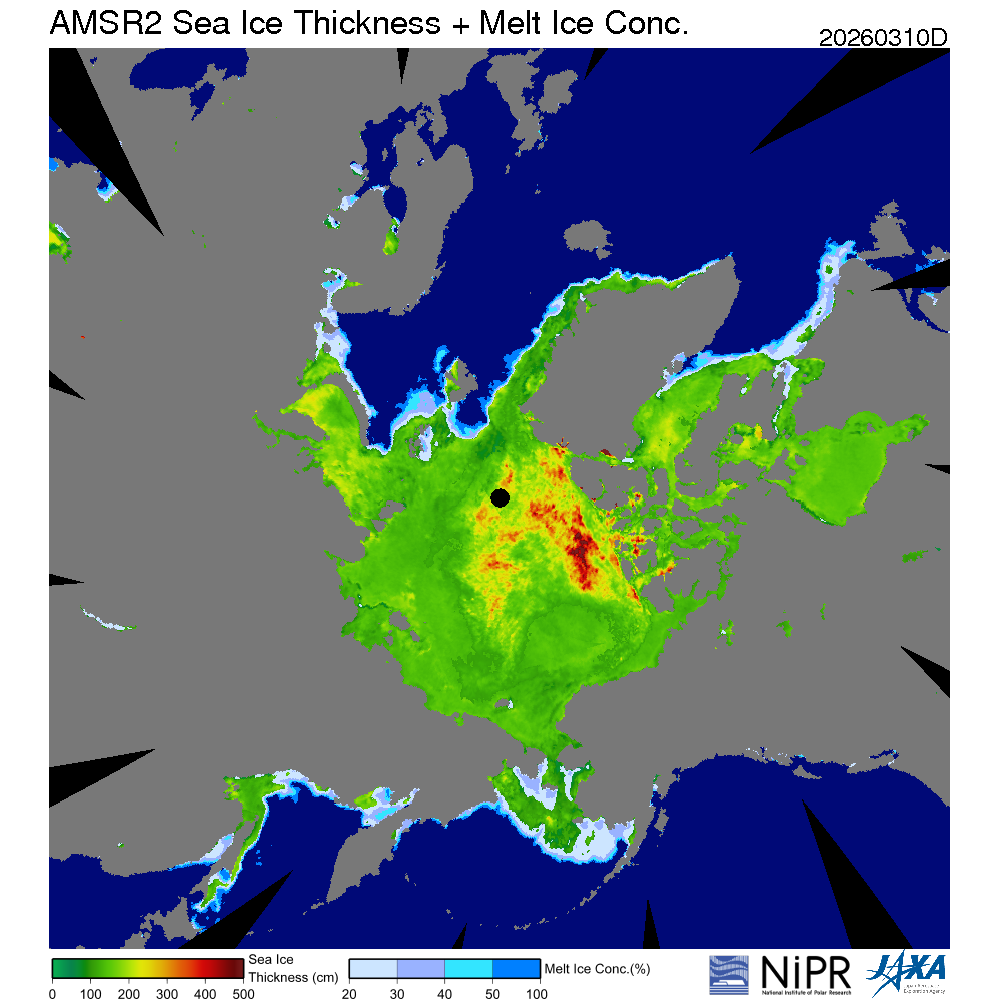
On the 9th it looks like the Barents Sea and Sea of Okhotsk were the main net contributors to further loss. The Okhtosk loss for the 8th I mentioned/forecasted it from ECMWF 8 days ago in an above comment.
For the Barents Sea looks llke winds were unfavorable for it on the 8th going into the 9th..
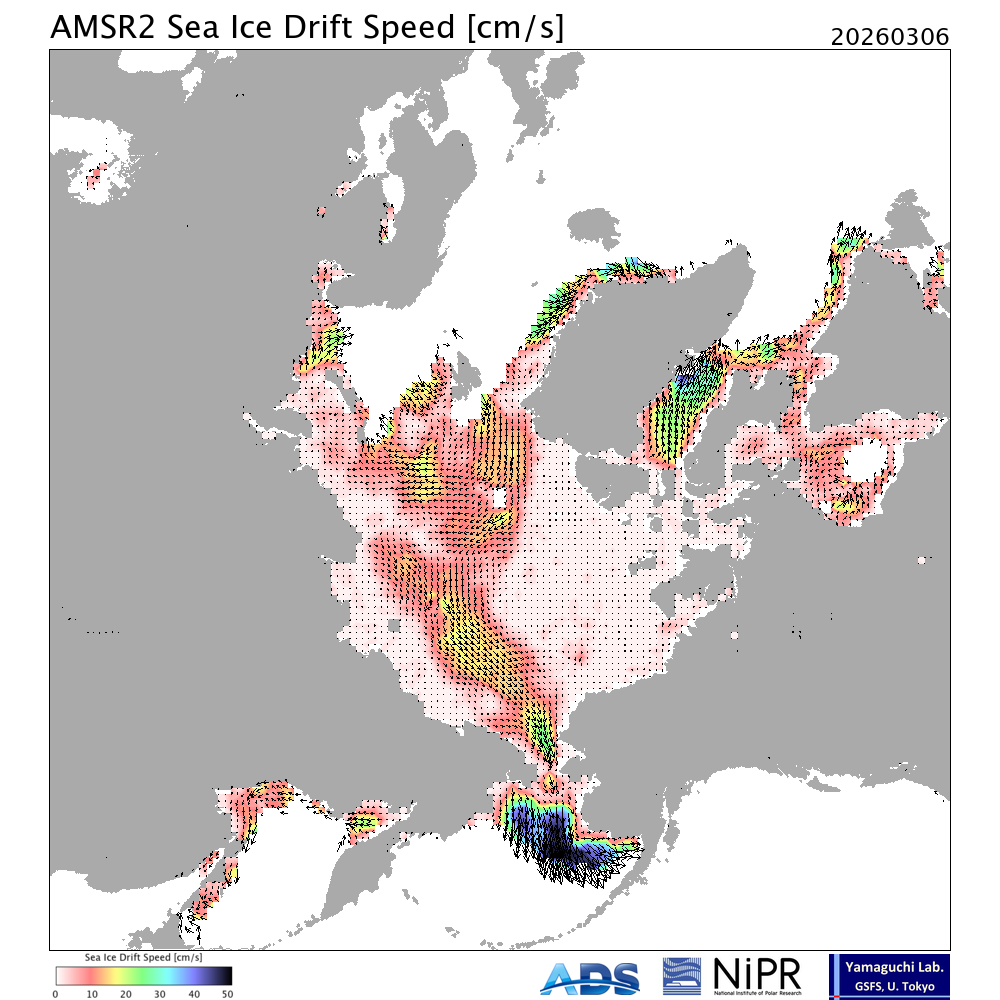
This is supported by the drift vector from ViSHOP and implied it was only drift, by looking at the SST from ViSHOP, and 2m air temps from ECMWF, which show it still below freezing yesterday... The d
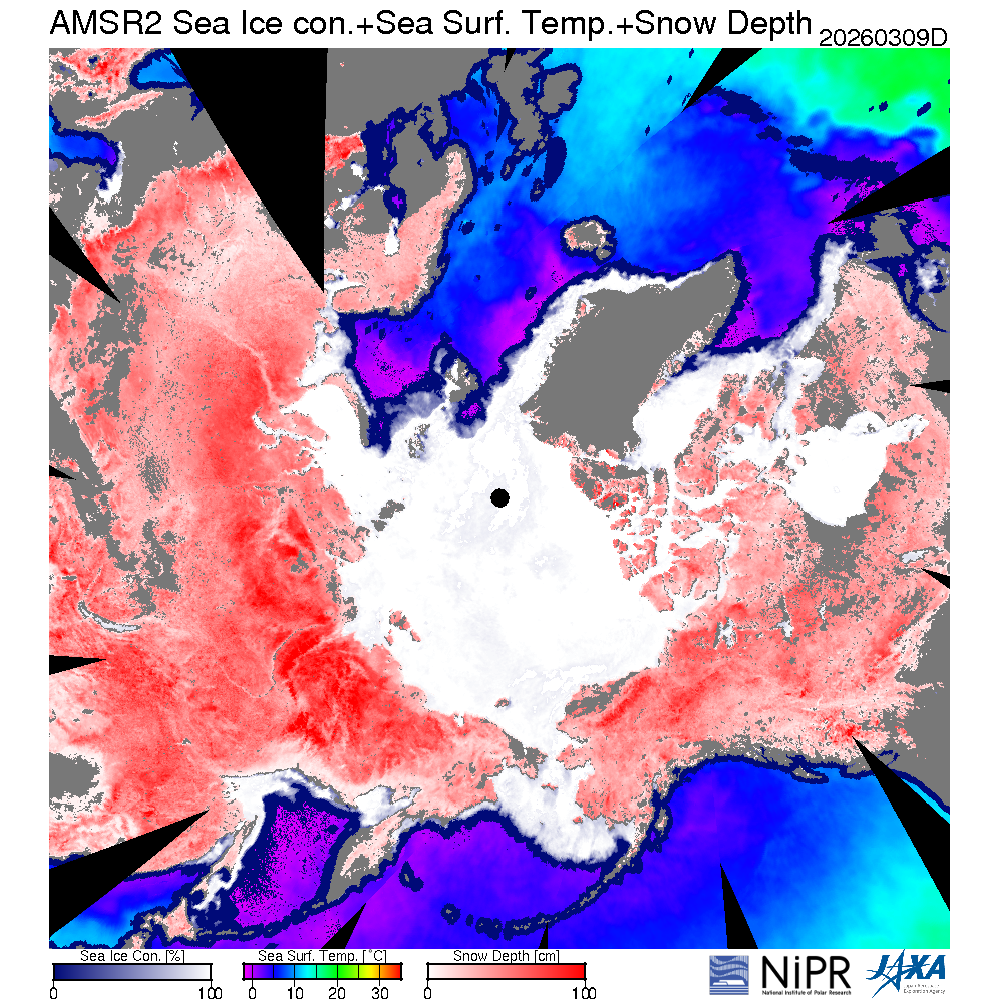
Parts of the Okhotsk Sea and Bering Sea both had above freezing temps for yesteray but it looks like only the Okhotsk Sea was affected so far, as it looks like from following the melt ice products and vector above it was mostly drift contributing to any losses in the Okhotsk Sea. For the Sea of Okhotsk and the Bering sea the Ascending extent the ascending passes have better coverage... (unfortunate the sea ice extent charts dont have the same good masking that the concentration does as that can be misleading for spatial analysis but they really do have great products for diagnostics!)...


Neither of the sat. passes were great for Gulf of St Lawrence yesterday (10th) so a chunk got “erased”, otherwise I think we might have seen a tiny rise instead of a tiny dip… so we should probably expect a tiny bump up for Mar 11 when the data comes in (after writing most of this the data did come in and it’s now 13.67 on Mar 11, up from 13.64 on the 10th).
The average for the first 10 days is 13.619.
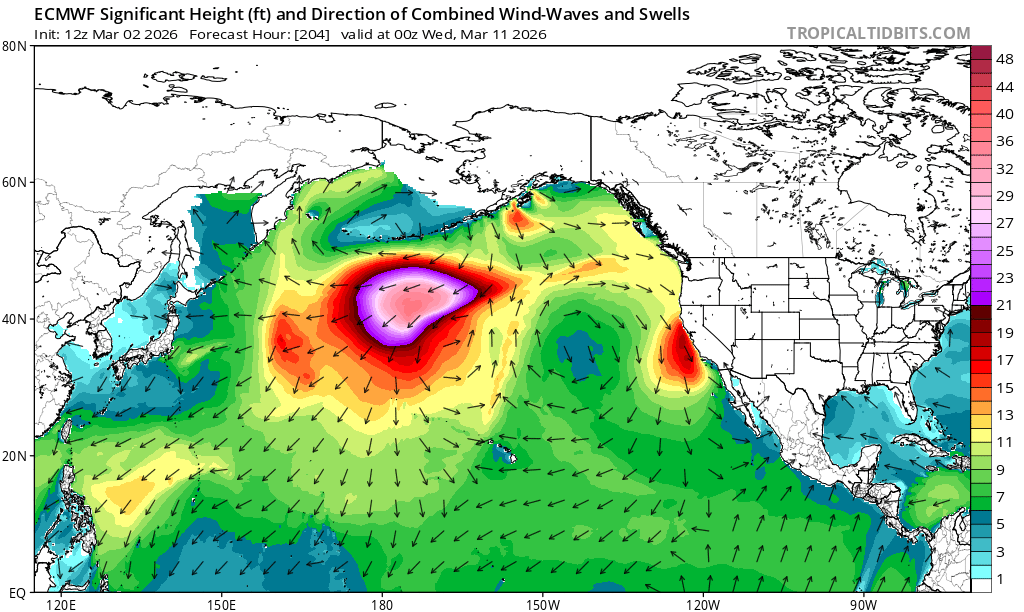
Looking forward, below I rely on mainly ECM 12Z and the ViSHOP diagnostics for the 10th, but note its still especially speculative after 8-9 days, since it’s indicated from EPS and the corresponding subseasonal PV winds there isn’t agreement so far out on the shift in the PV… (which you normally shouldn’t expect anyway)..
~
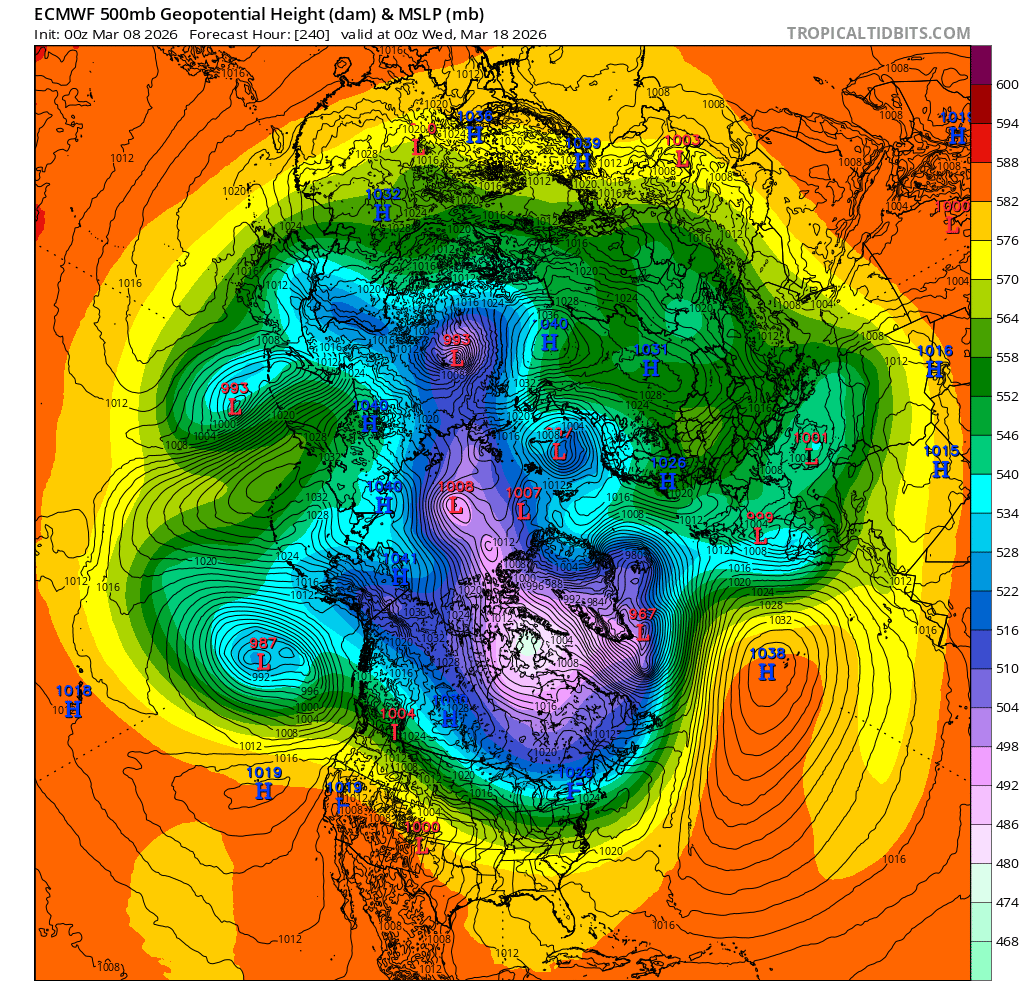
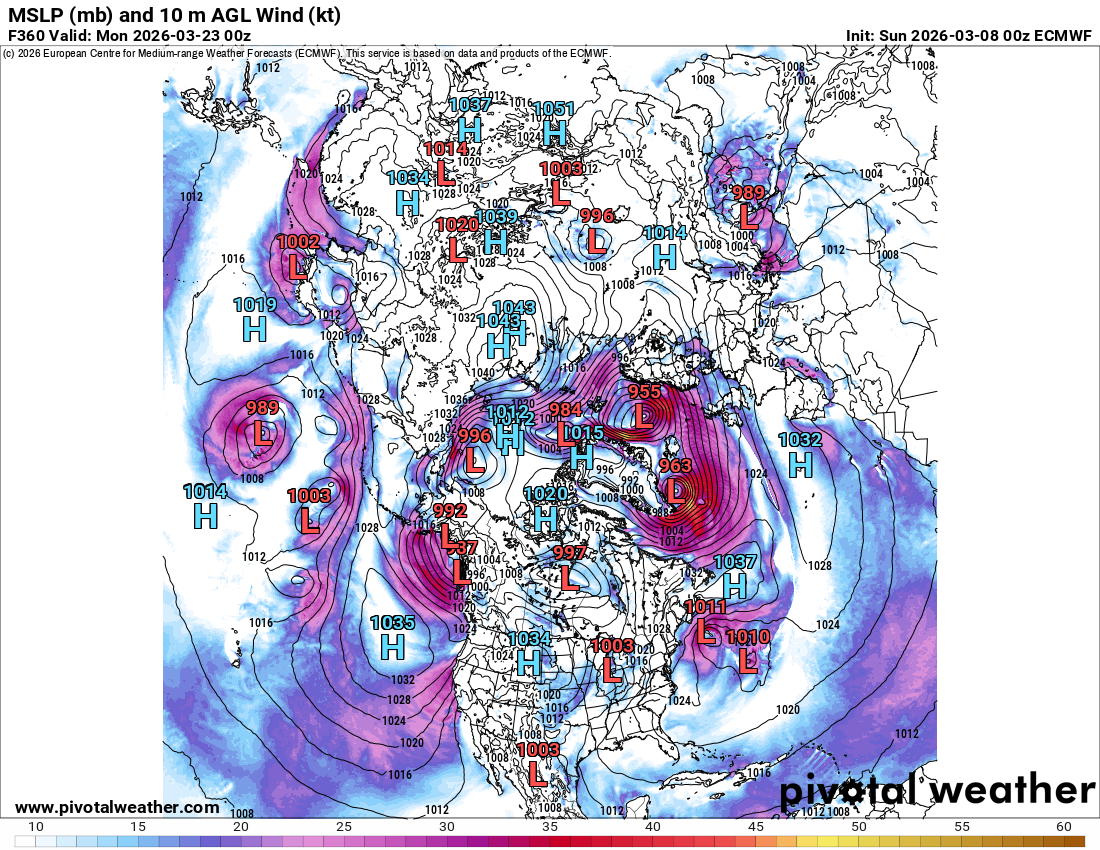
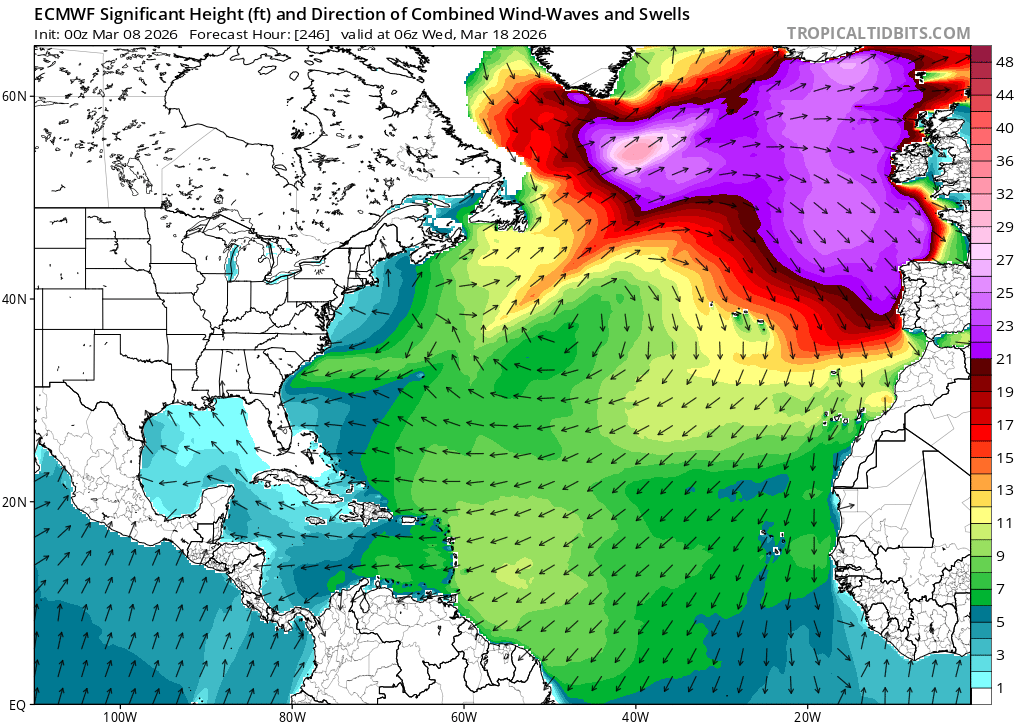
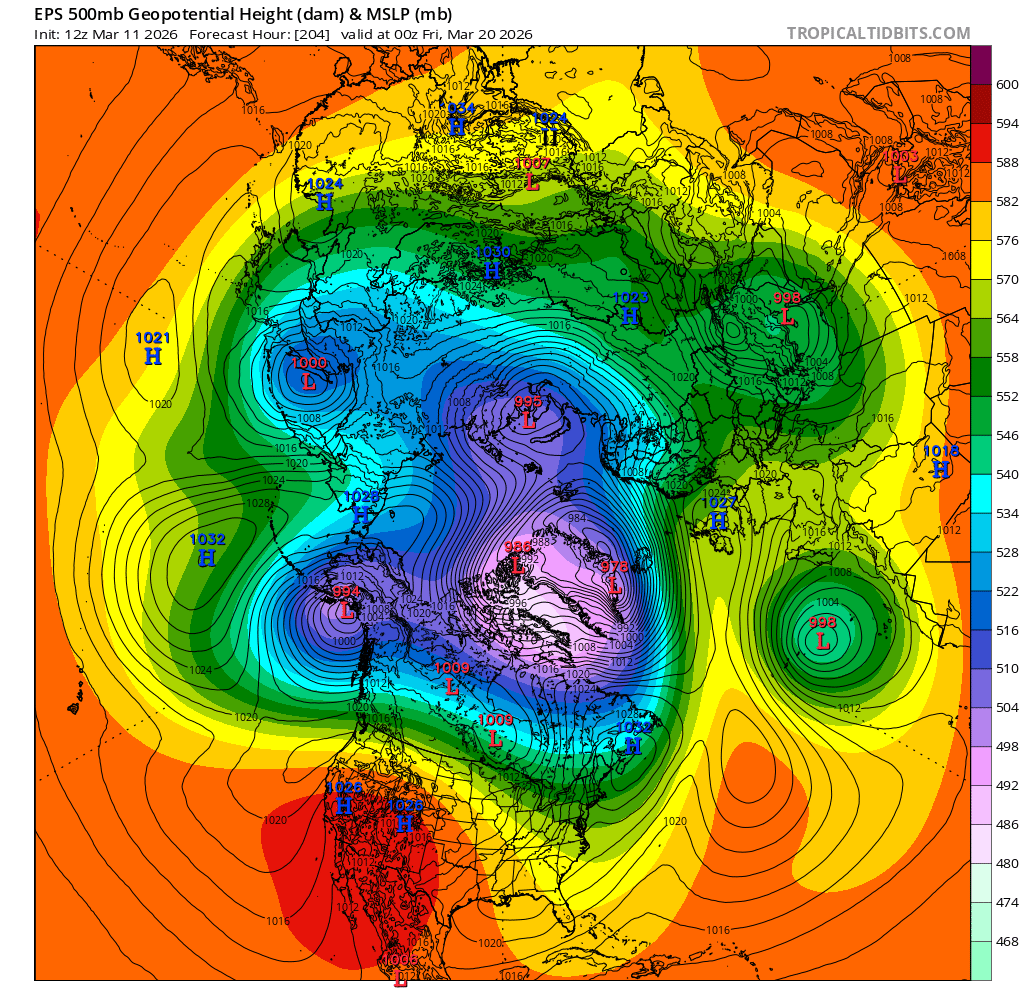
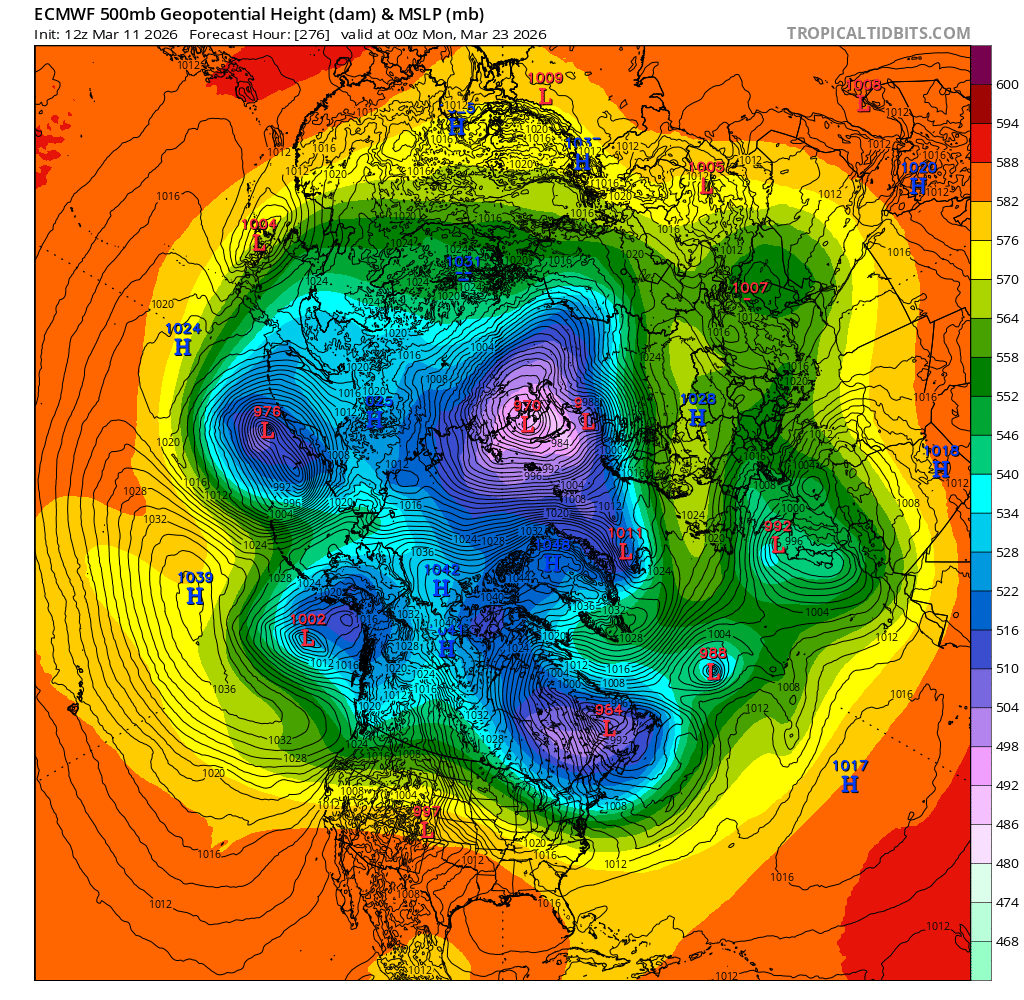
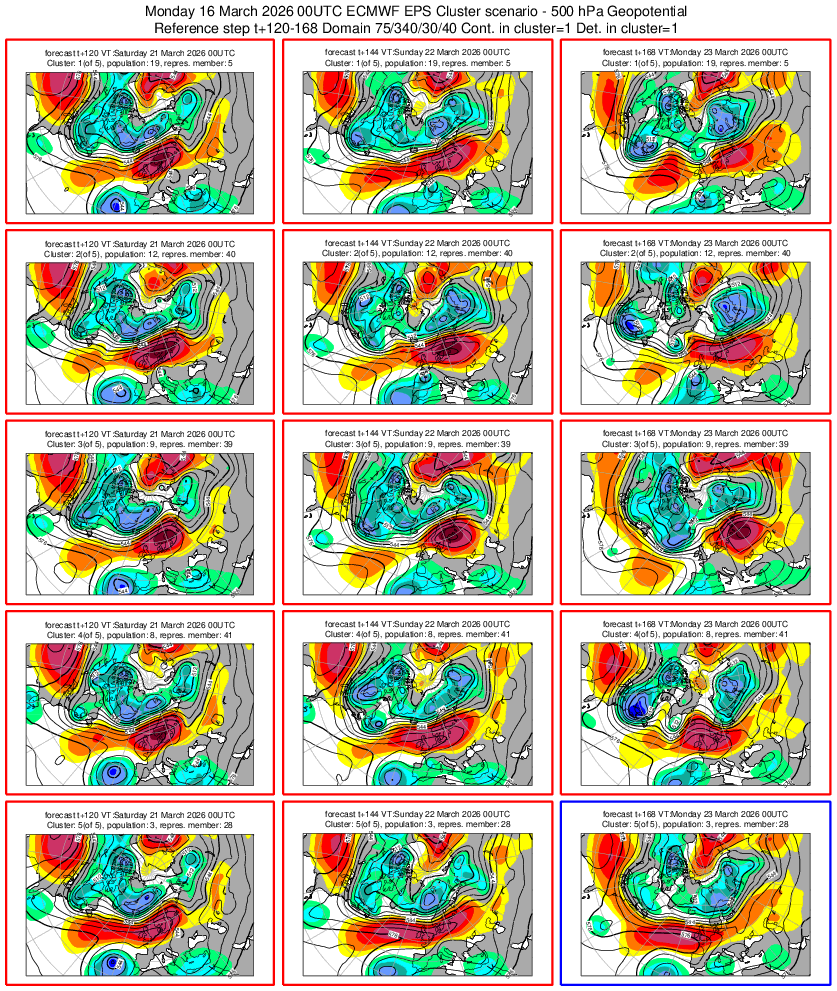
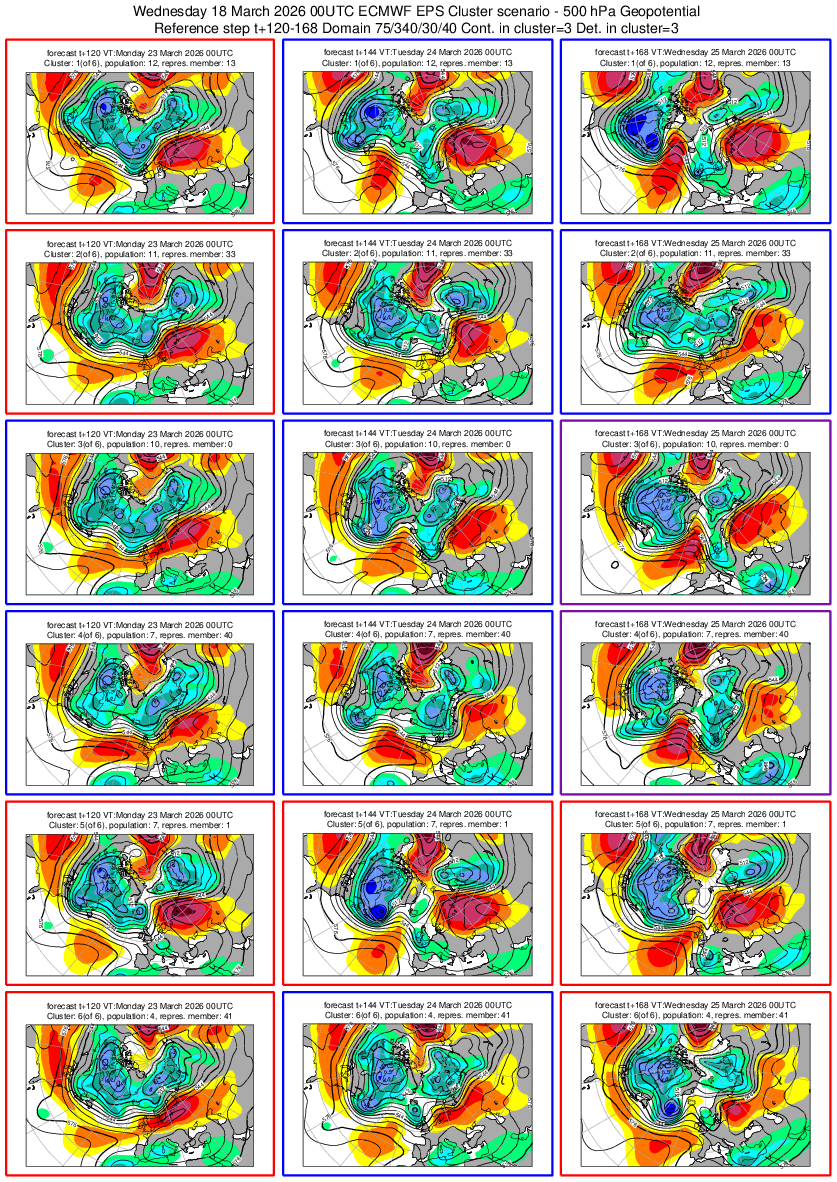
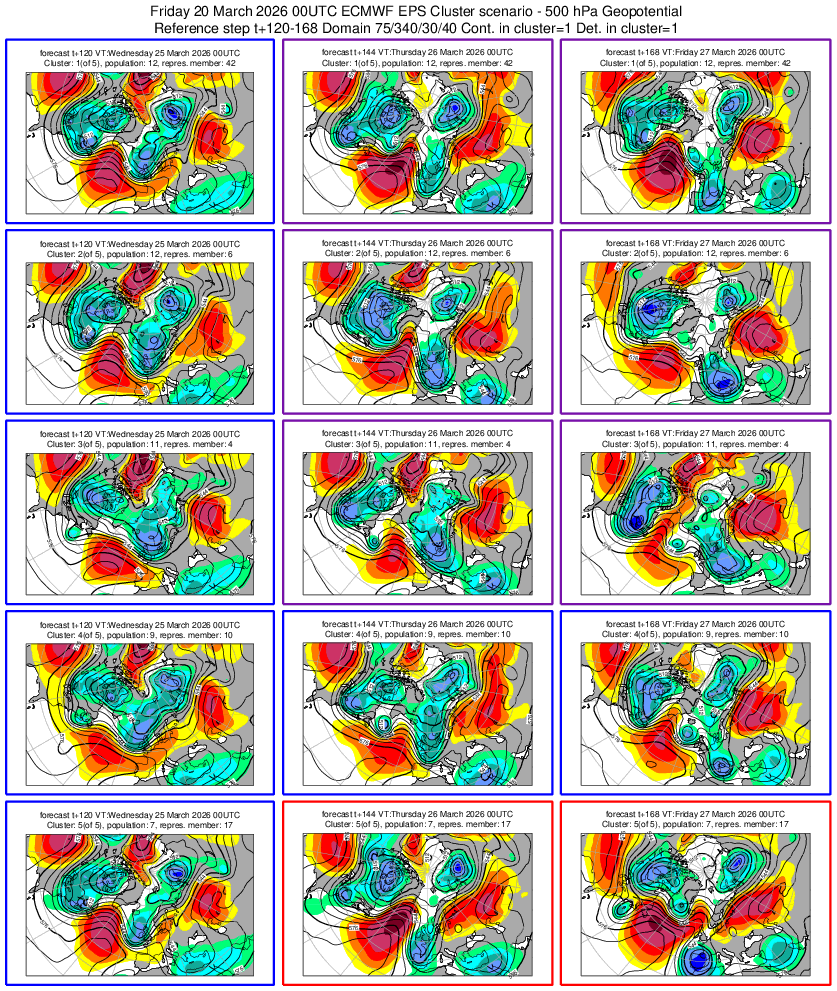
looking through ECM det. model for 12Z that goes to mar 26… The most significant change near the end of the medium range is the change from today’s runs to yesterday is what will happen to the PV once its winds start to weaken after the 18th.. (if this is right, this shift in the forecast means CFS won’t be as useful for a while until the old runs get pushed out the averaging window).
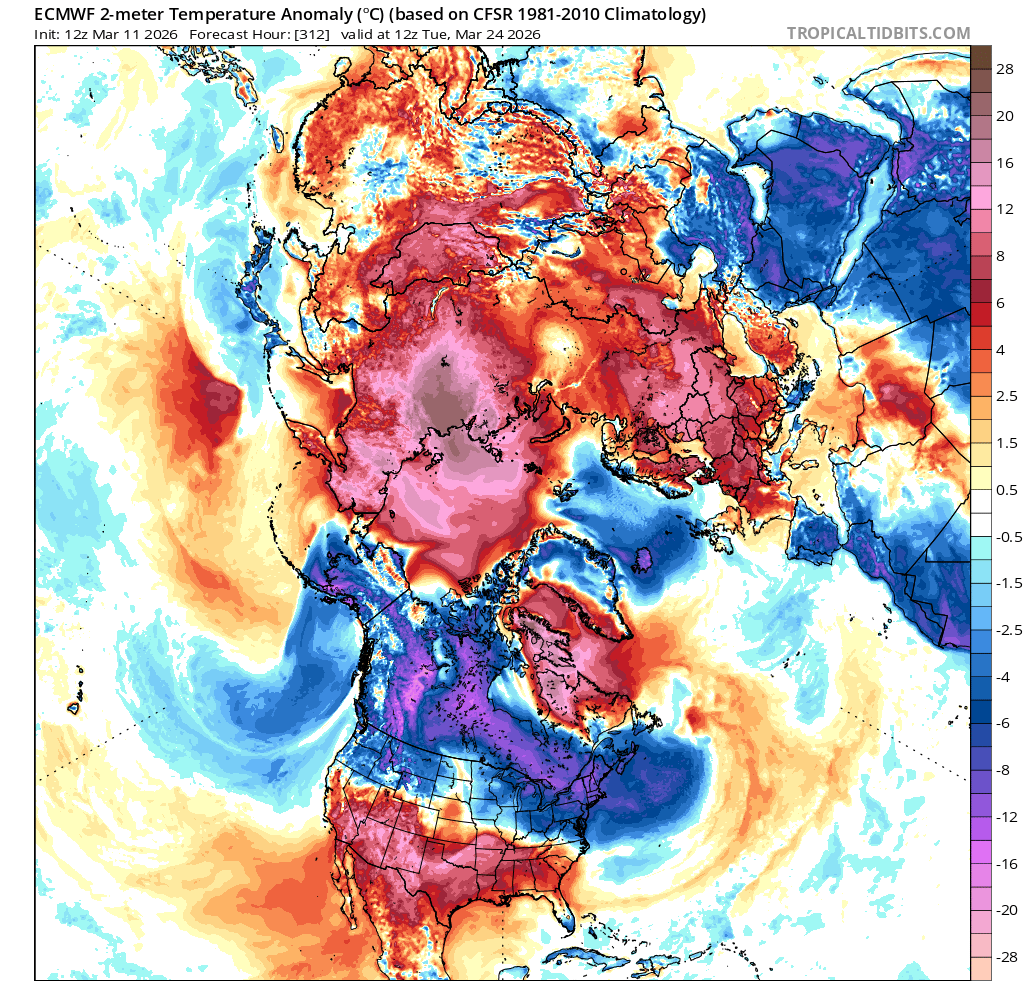
Once it recovers a bit or the next few days, it stretches near the lower levels, but with the bulk of the PV looks like it will shift largely over the 20-22nd over Russia, with GFS on Stratobserve shows a very similar scenario implied by ECM, with a smaller portion of the lower levels going into the upper troposphere contorting/stretching towards NE Canada. This is actually the worst case scenario I think for the Labrador Sea as it looks like the remaining spin will end up with the jet stream stabilized in that one spot and fuel a lot of strong, continuous poleward wind/waves (at least it shows so until the end of the forecast). Conversely the shift in the PV for the center over Russia after the shift looks like it will setup winds to move more poleward from Russia across the Arctic Ocean and then generally through the Fraim Strait, setting up advancement conditions thereafter for the Barents Sea (this can be inferred even from the 2m anomaly chart)…
For diagnosing the sea ice extent changes on a spatial scale, I think it might be easier to look at the inflection dates when the wind/wave directions are favorable (unfavorable) for sea ice advancement (retreat) as follows first…
Sea of Okhotsk looks like it is generally unfavorable (sometimes neutral) until the 21st where it becomes somewhat neutral, then favorable from the 23rd.
Bering Sea is favorable until the 21st, after which it becomes unfavorable.
Labrador Sea looks favorable until late 17th, after which becomes unfavorable to the 20th, after which some what favorable until the 22nd after which very unfavorable.
Greenland Sea which I haven’t paying close enough attention to, looks very unfavorable until the 19th, afterwards it looks favorable.
Barents Sea looks favorable until the 14th, after which very unfavorable (for Russian coast and Novaya Zemlya) until the 22nd after which very favorable advancement from northerlies.
The portion of the Arctic Ocean poleward of the Fram Strait (i.e. >80N) will be favorable all the way until end of the forecast!
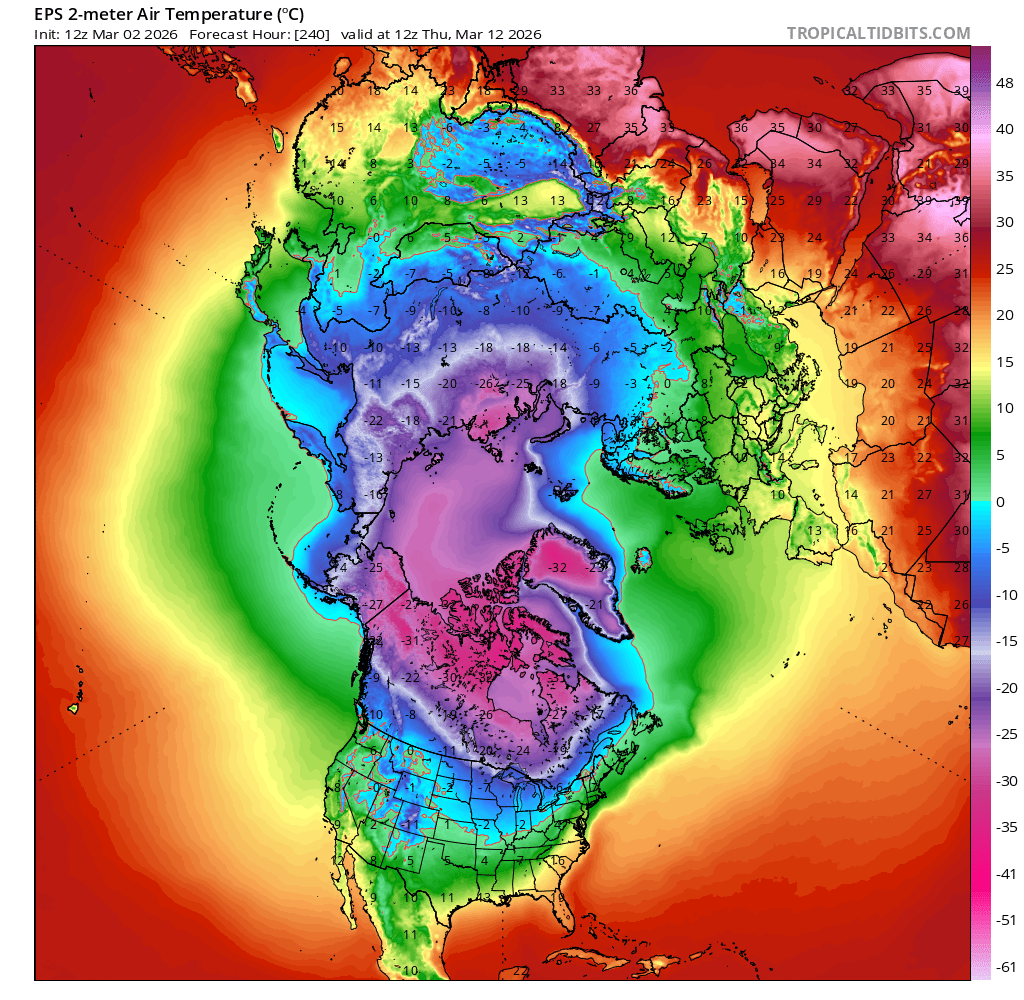
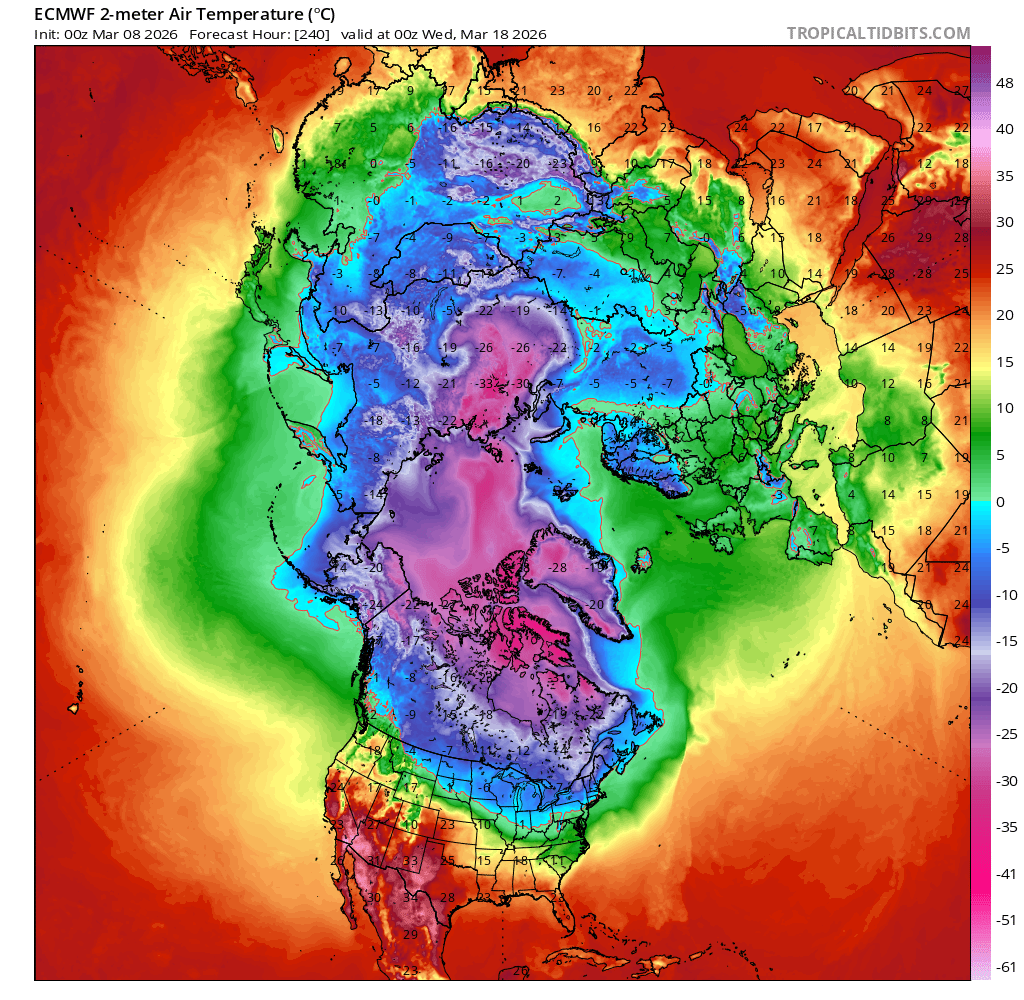
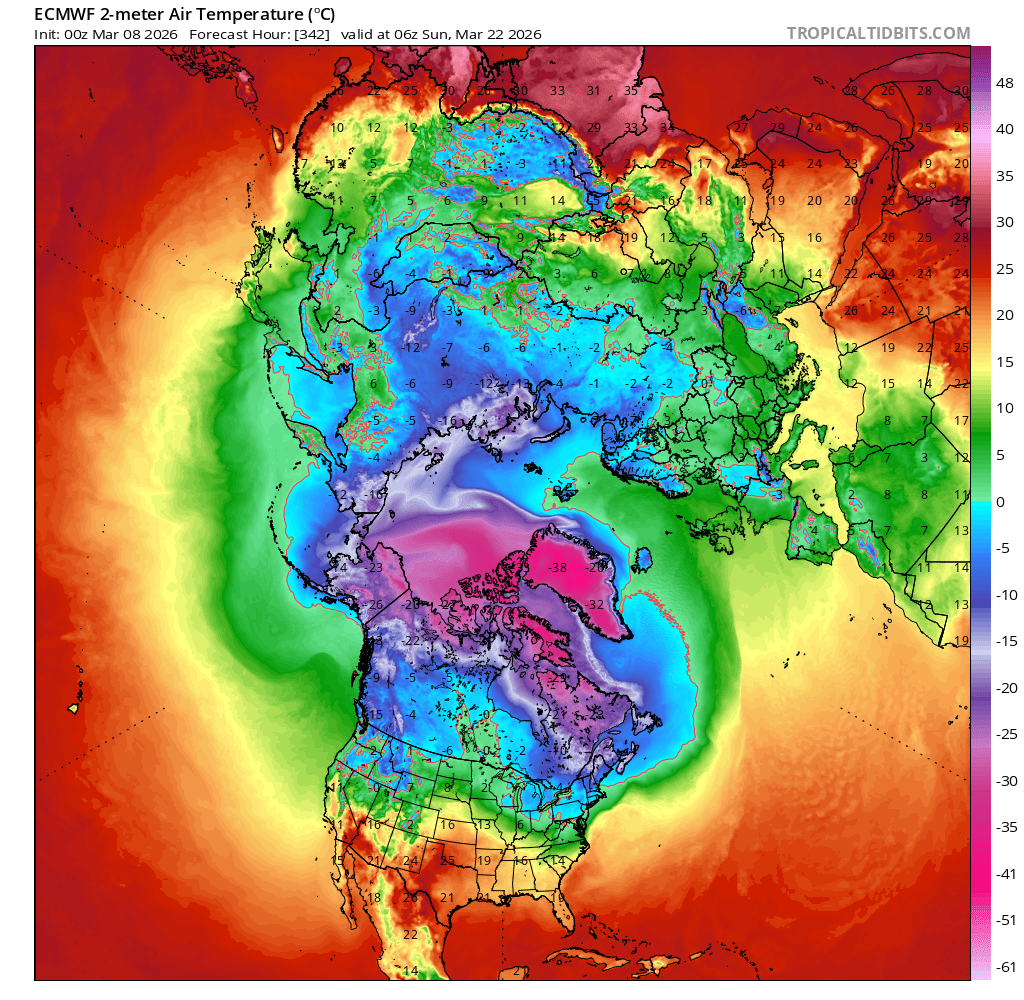
As for air temperature:
For the Bering Sea it looks clearly unfavorable for most of the central and especially western portion near the Russian coast for almost the entire duration, i.e. until the 25th (with retreat expected along the Russian coast - albeit minor, contra to this is a transient ocean wave reflection from one of the lows around the 24th-25th): even though that blocking high will shift and weaken by the 20th, the forecast is there will be a couple of lows that will advect relatively warm air poleward afterward at least until about the 25th when the jet stream forms much closer to the Aleutian Islands, after which there should be below freezing temps for most of the Bering sea.
For the Sea of Okhotsk it looks unfavorable until the 20th from the blocking setup, where after the same lows that were unfavorable for the Bering sea now become favorable for Okhotsk, bringing colder air equatorward thereafter.
I’ve already discussed the Labrador Sea and Barents Sea synoptic situation (above) with respect to the PV..
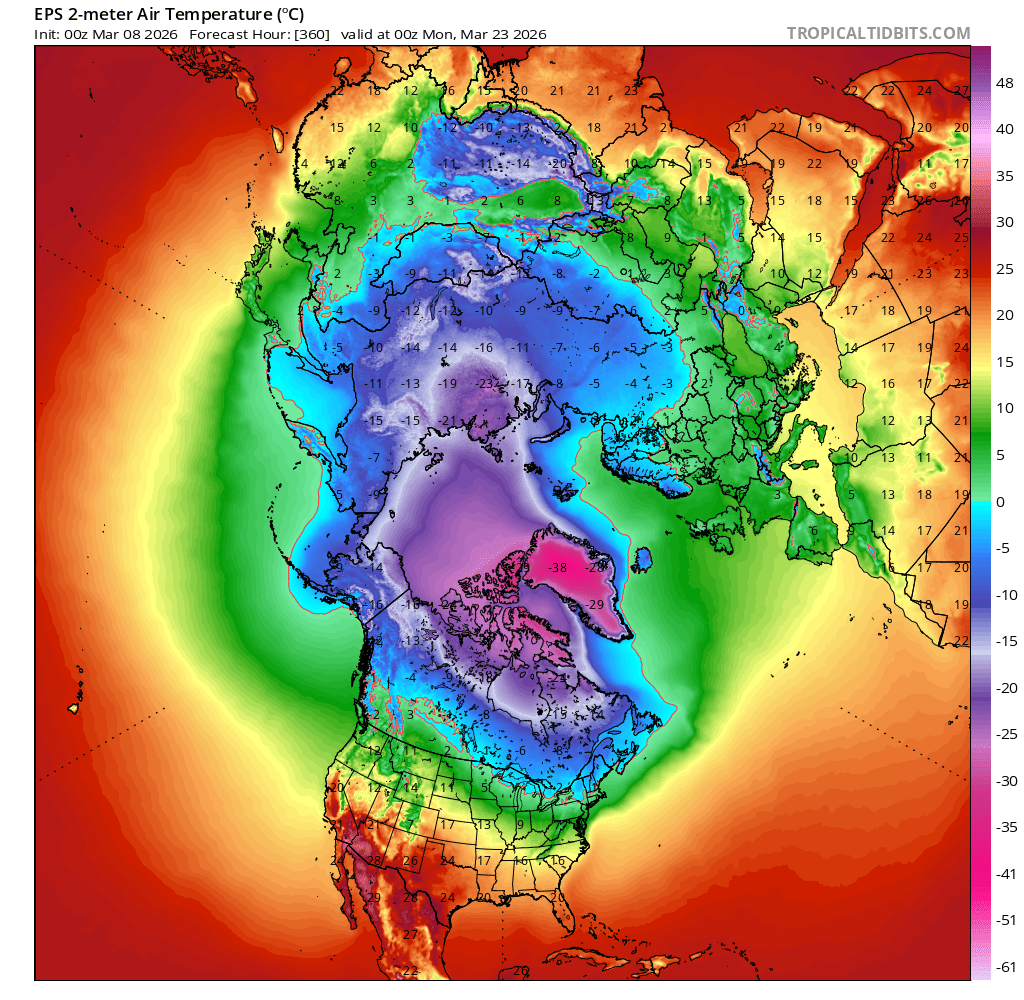
The Labrador sea temps favorability follow same pattern as the wind (again noting it’s very unfavorable from the 22nd and probably should expect the Gulf of St. Lawrence to also lose during this time).
The Barents Sea is mixed depending on the area: for the Russian coast it follows the same pattern as the wind pattern, elsewhere it looks generally favorable, and more importantly it is very favorable overall after the 22nd for reasons mentioned at the beginning.
The Greenland Sea should become more and more favorable (excepting a day when the PV shifts north), where afterward it will be very favorable, with freezing temps encircling Iceland.
~
After writing the above i had Claude stitch together the summary in a table.. it looks ok but I think the 23rd and 24th might be net decrease given the rate of loss in the Labrador Sea and possibly we might see actual net gains afterwards if the rate of loss decreases and the Barents Sea has substantial gains.
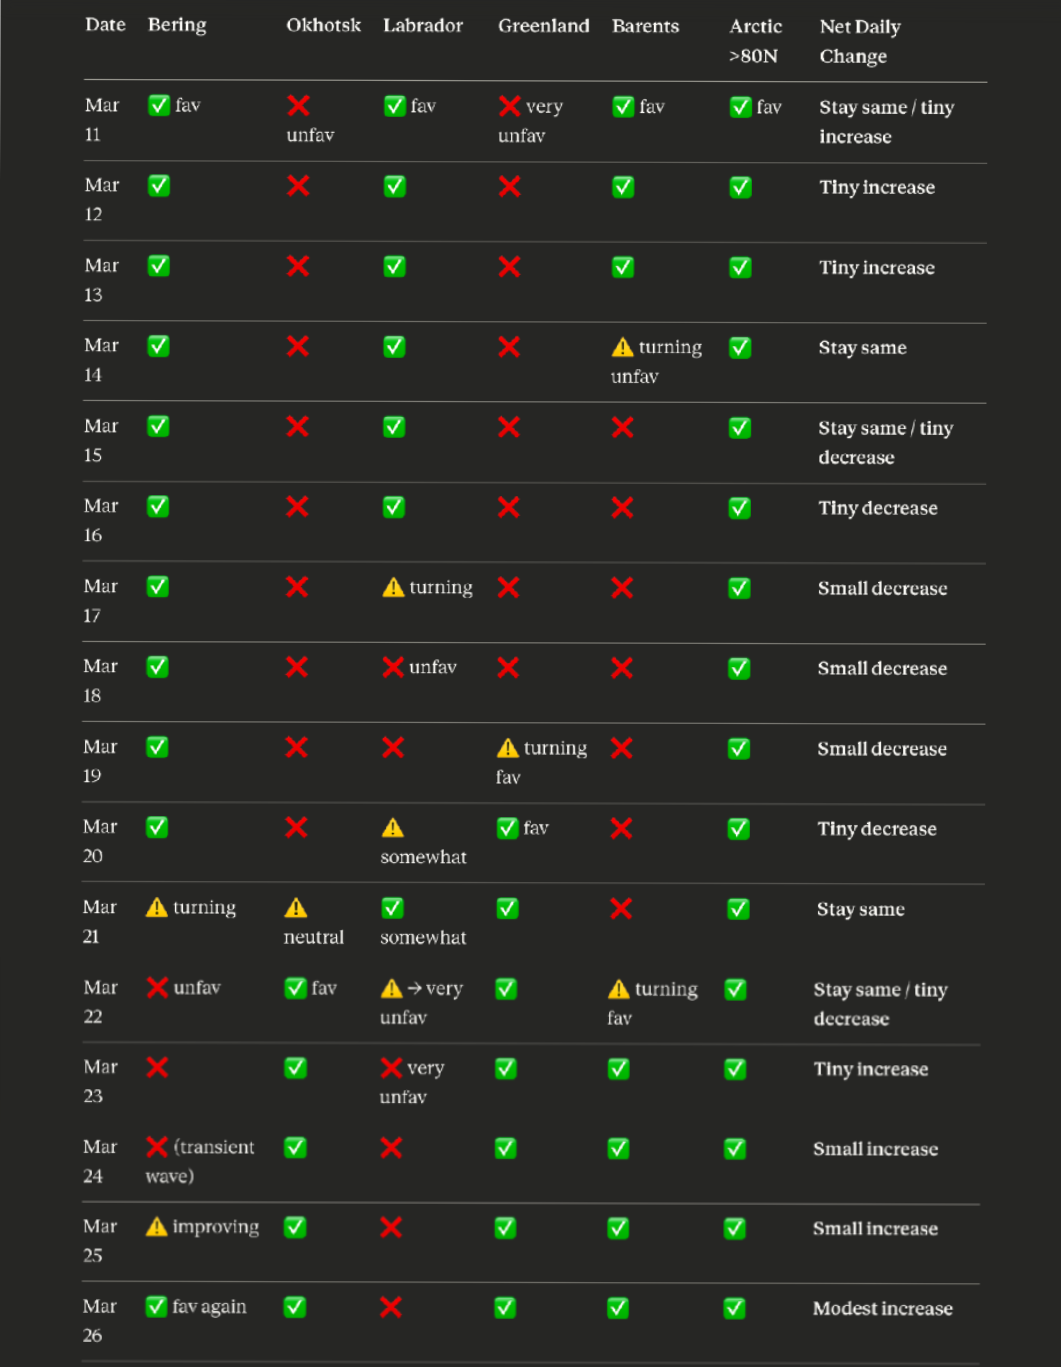
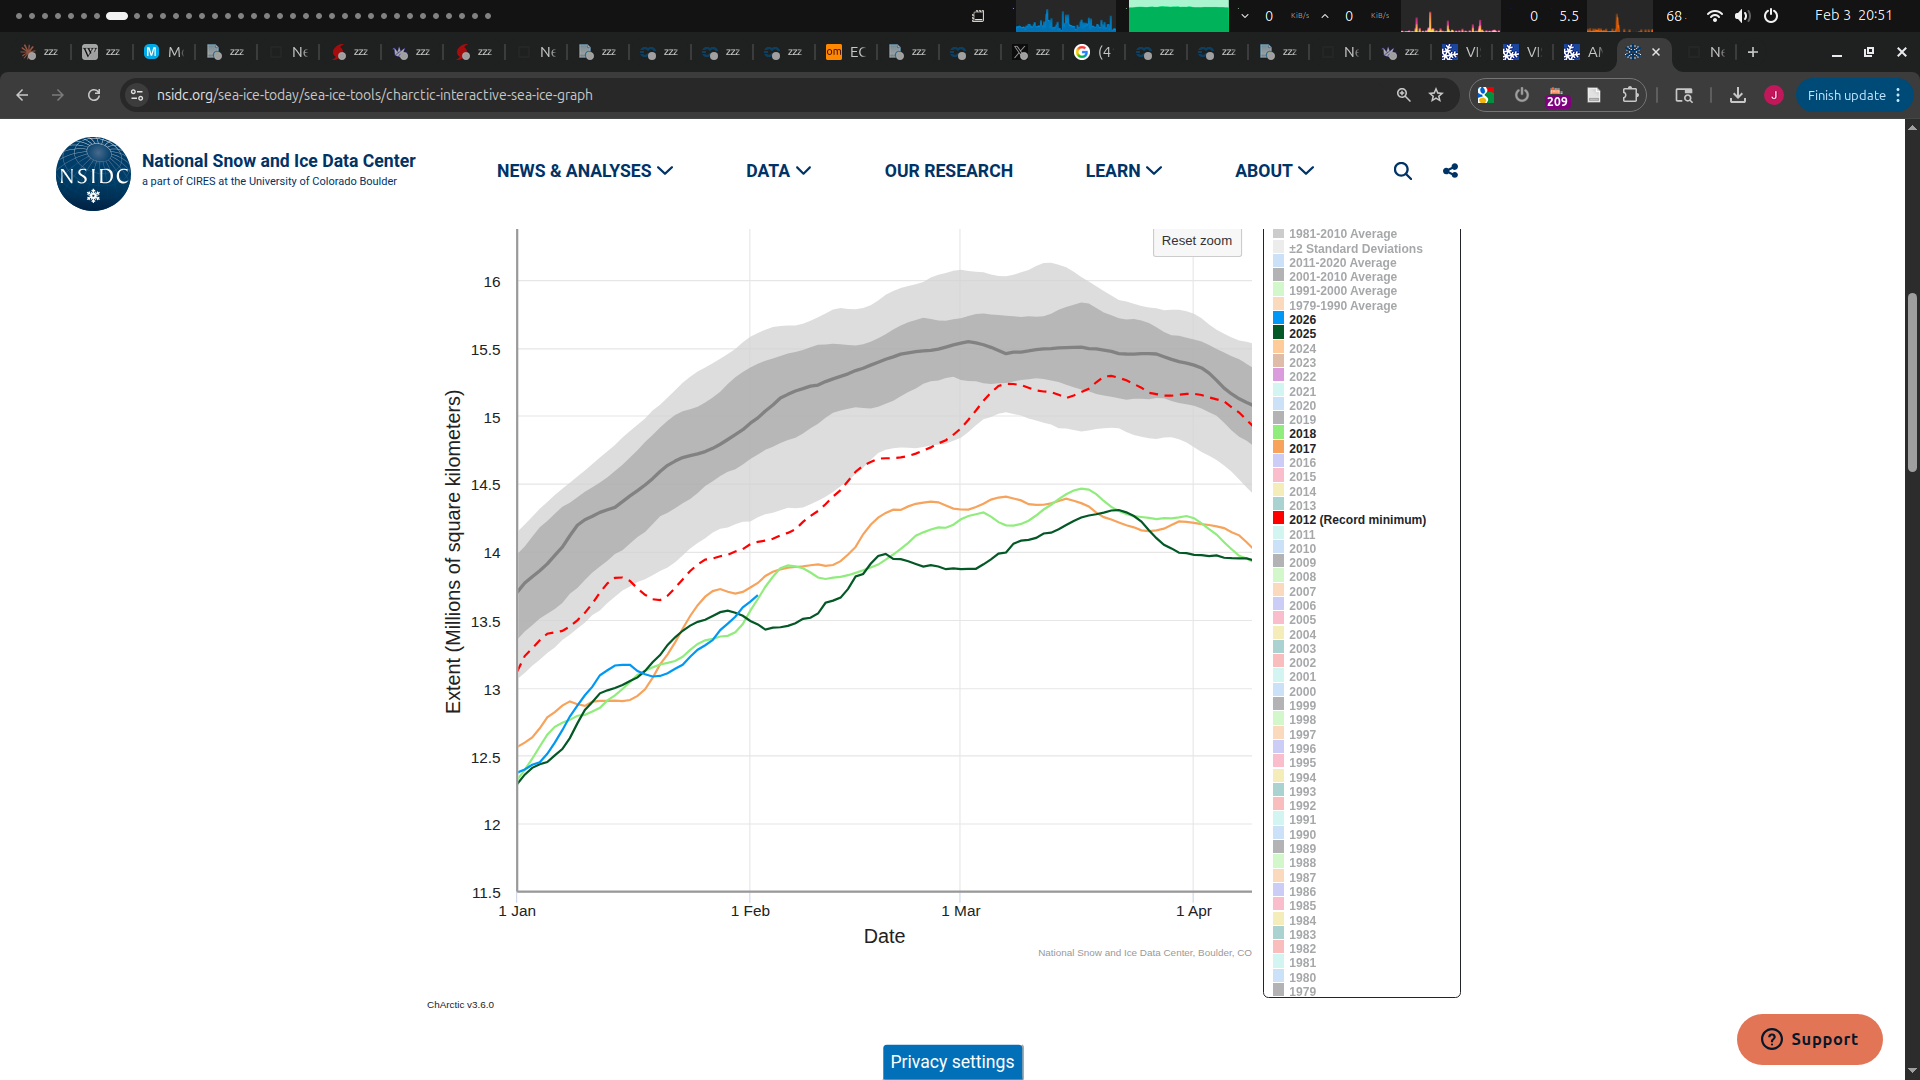
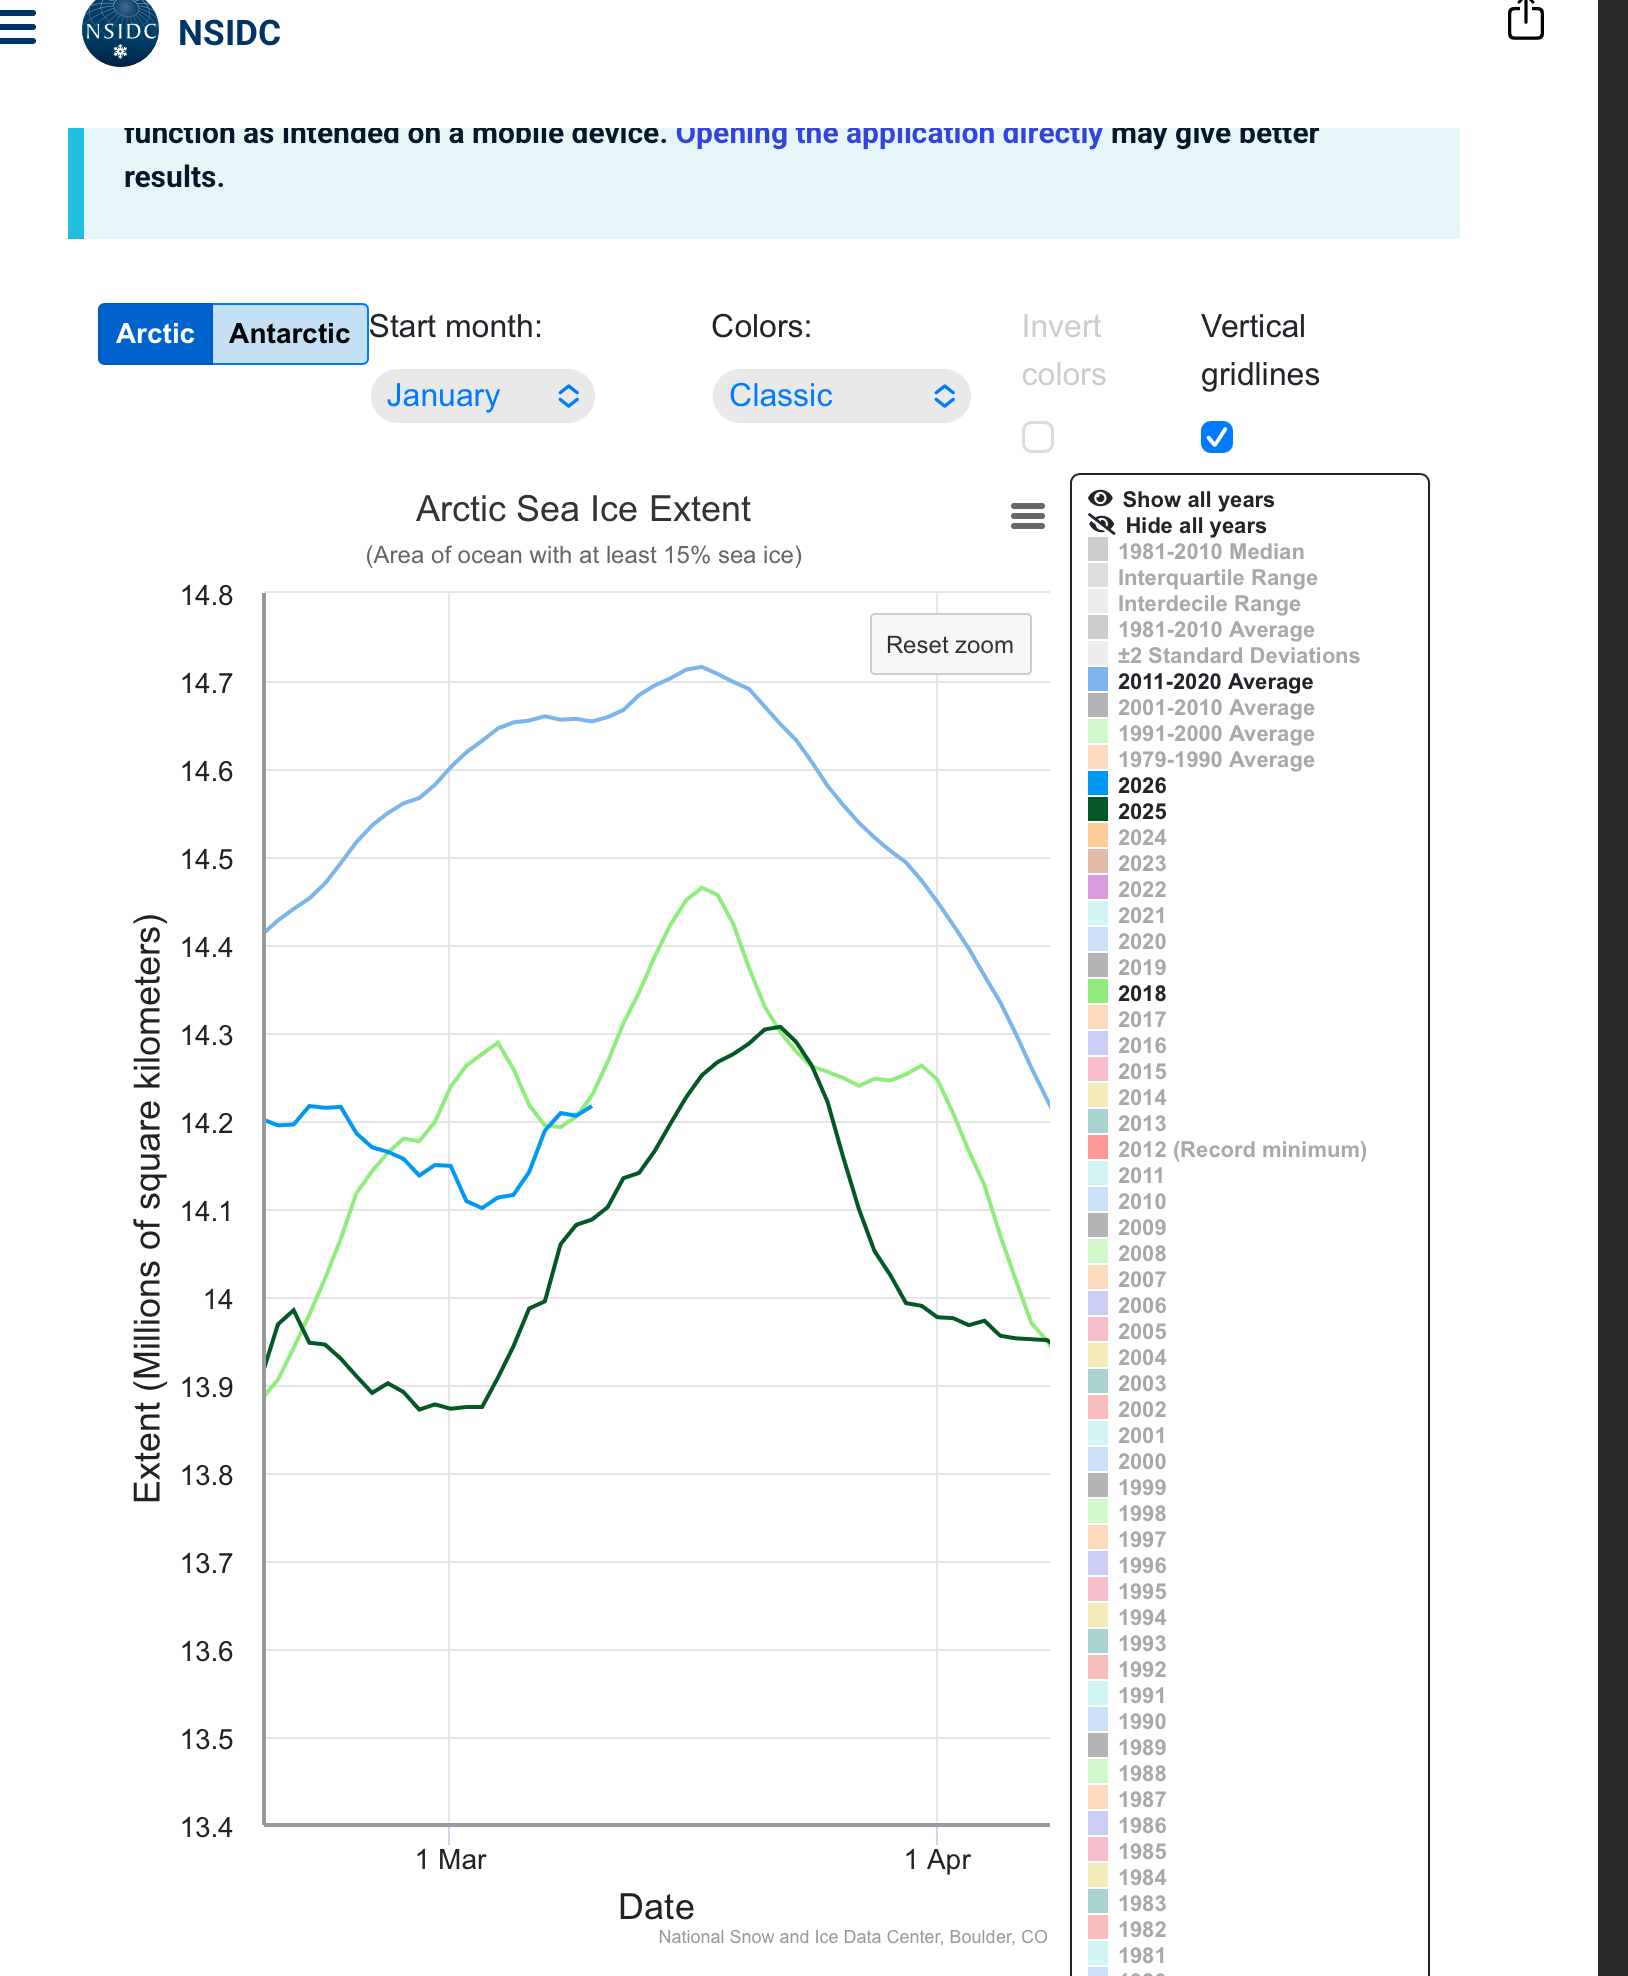
So subjectively for 11-20th we should on average see a tiny decrease (up for a few days then more down for the majority), and afterwards for the 21st to 26th (much more speculatively) not be very unfavorable but still net decrease (despite the Labrador Sea losing a lot, losses are reduced somewhat by the gains in the Barents Sea later on). For the last 5 days climatologically should expect a faster decrease.. Of the various averages on the NSIDC chart probably the 2011-2020 average is closest to the above scenario… but with a peak a day or two earlier on the 14th or 15th…
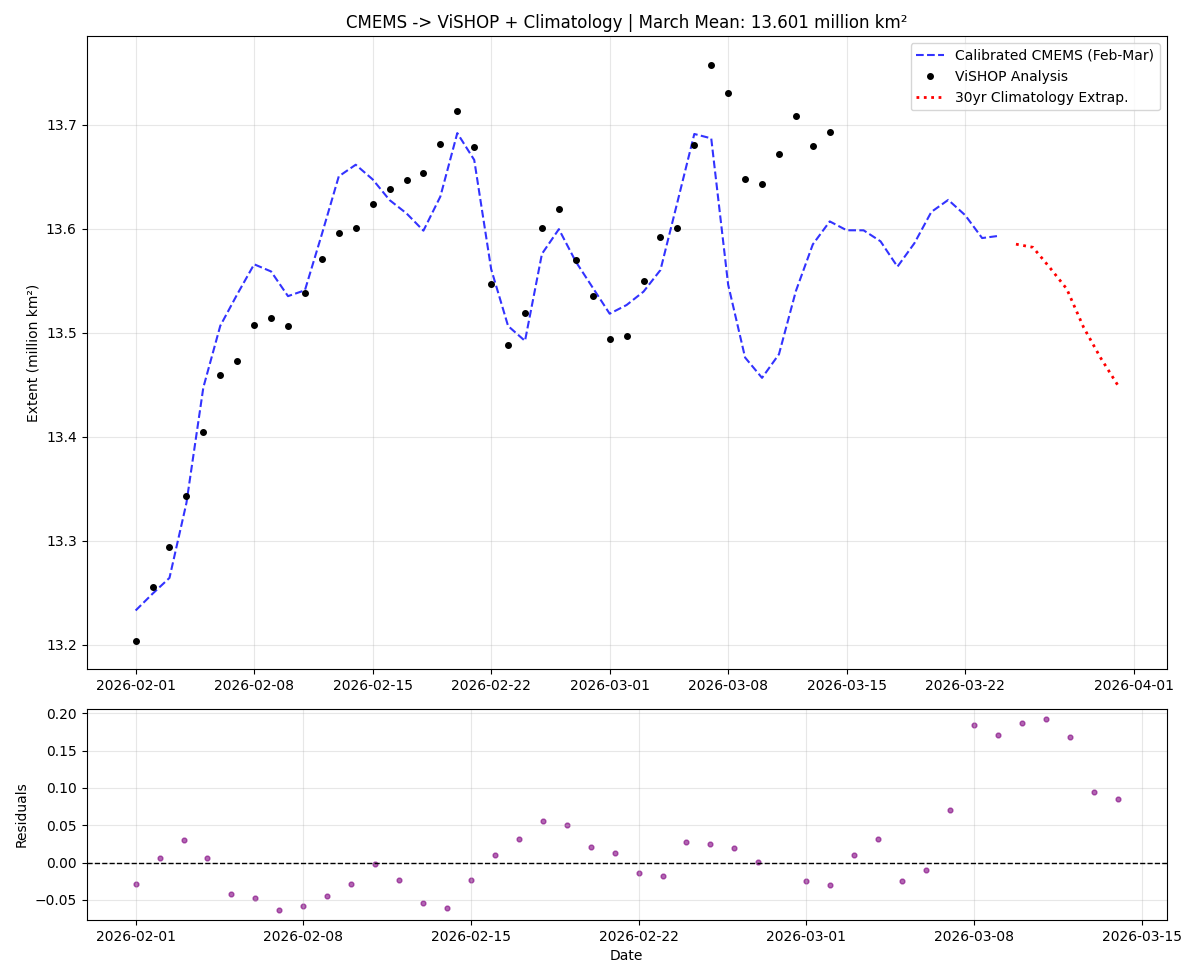
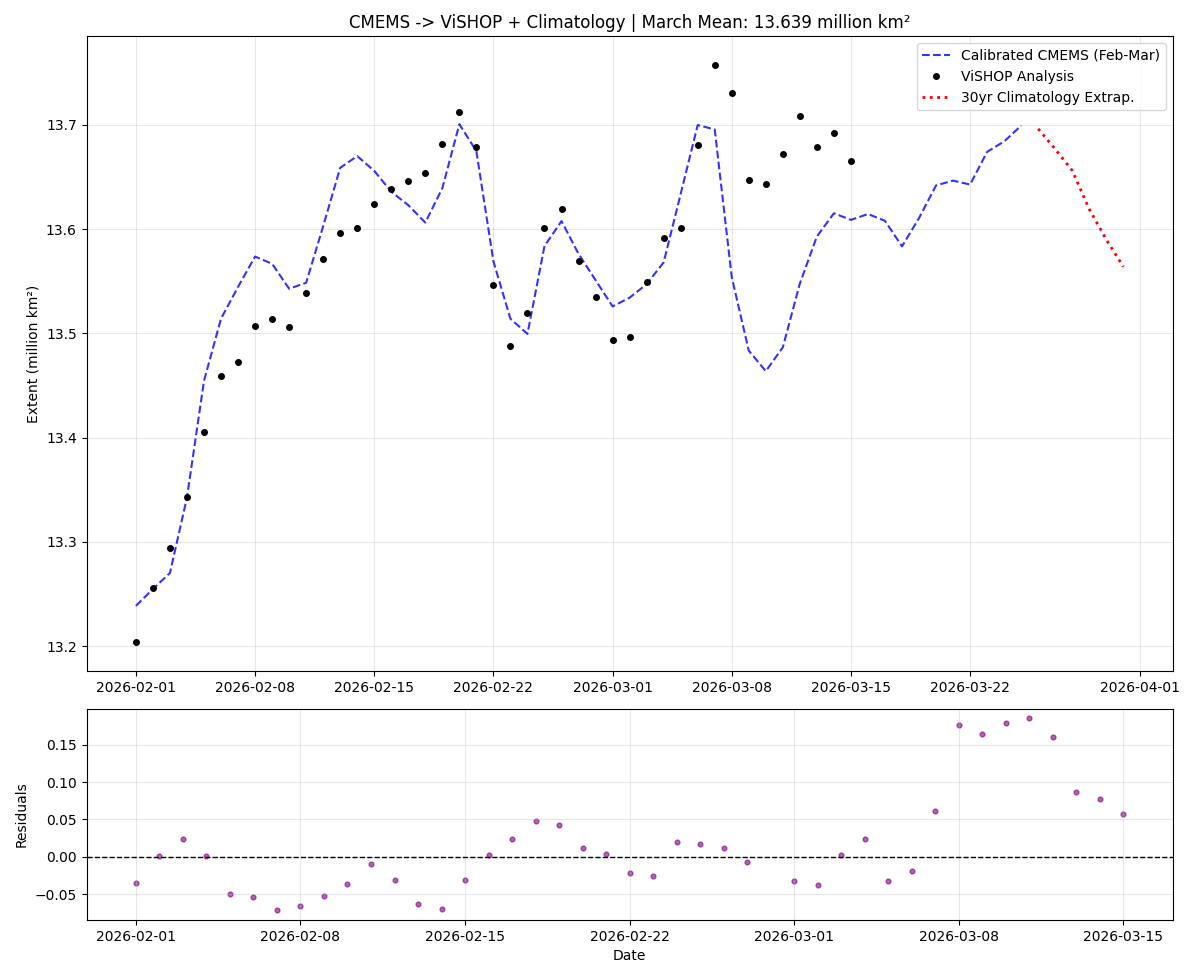
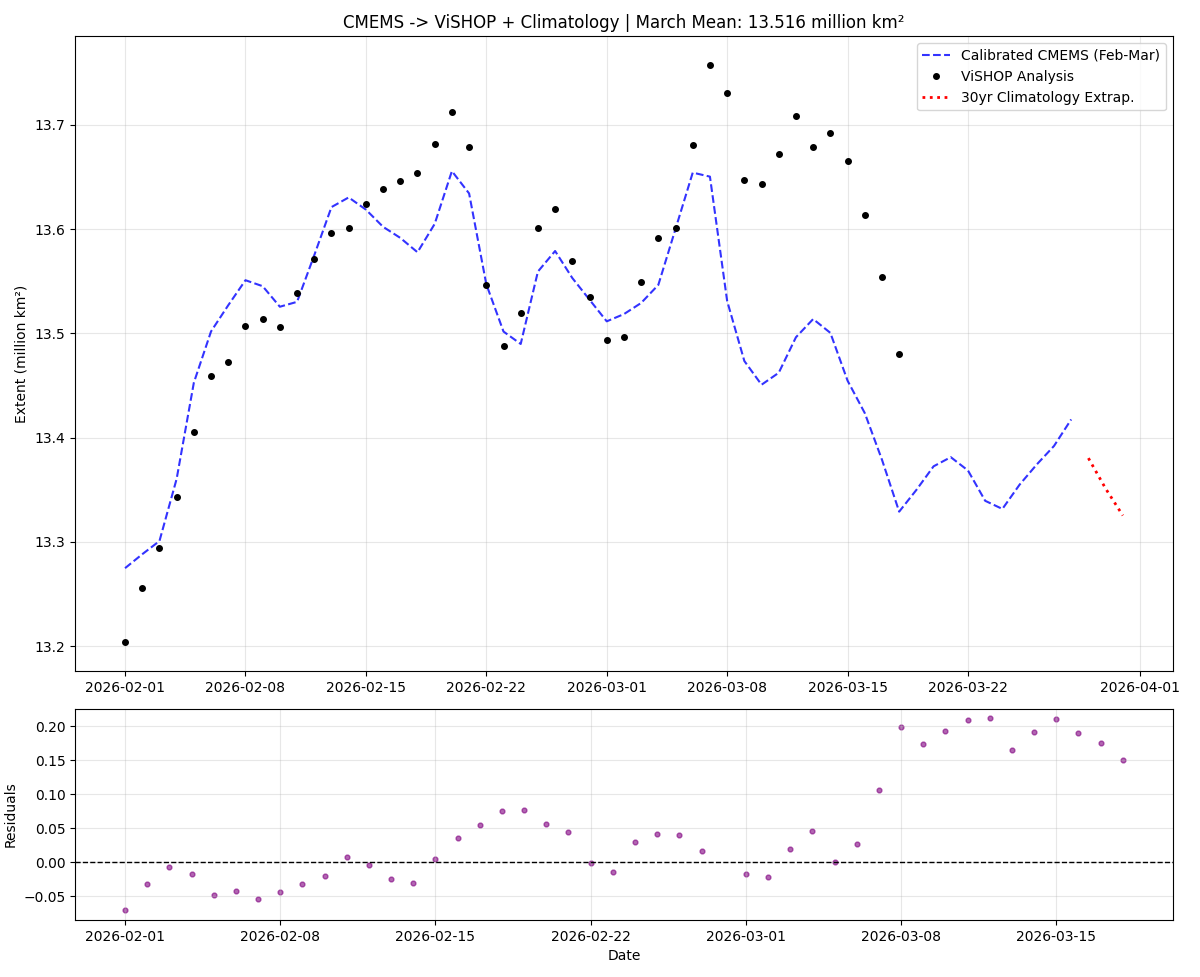
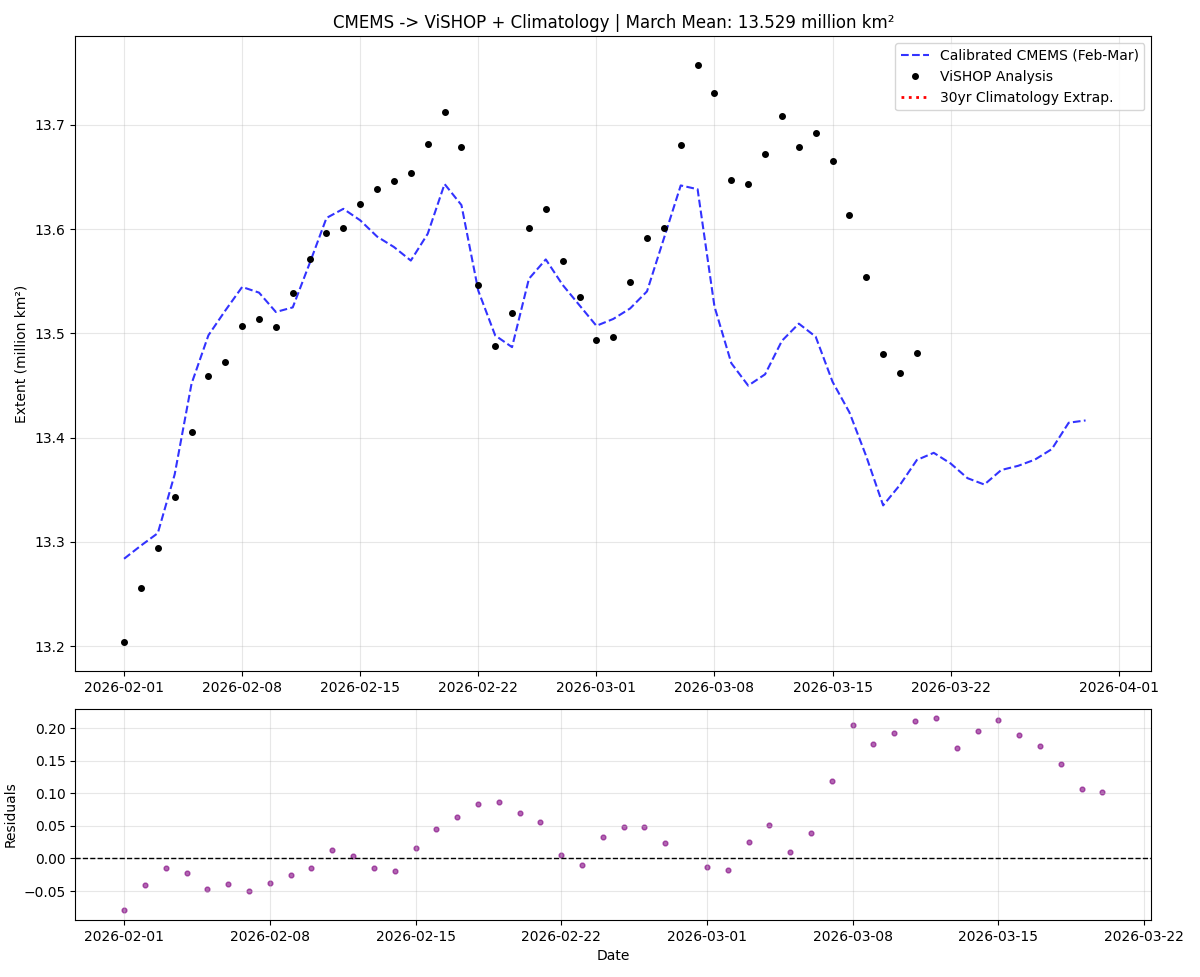
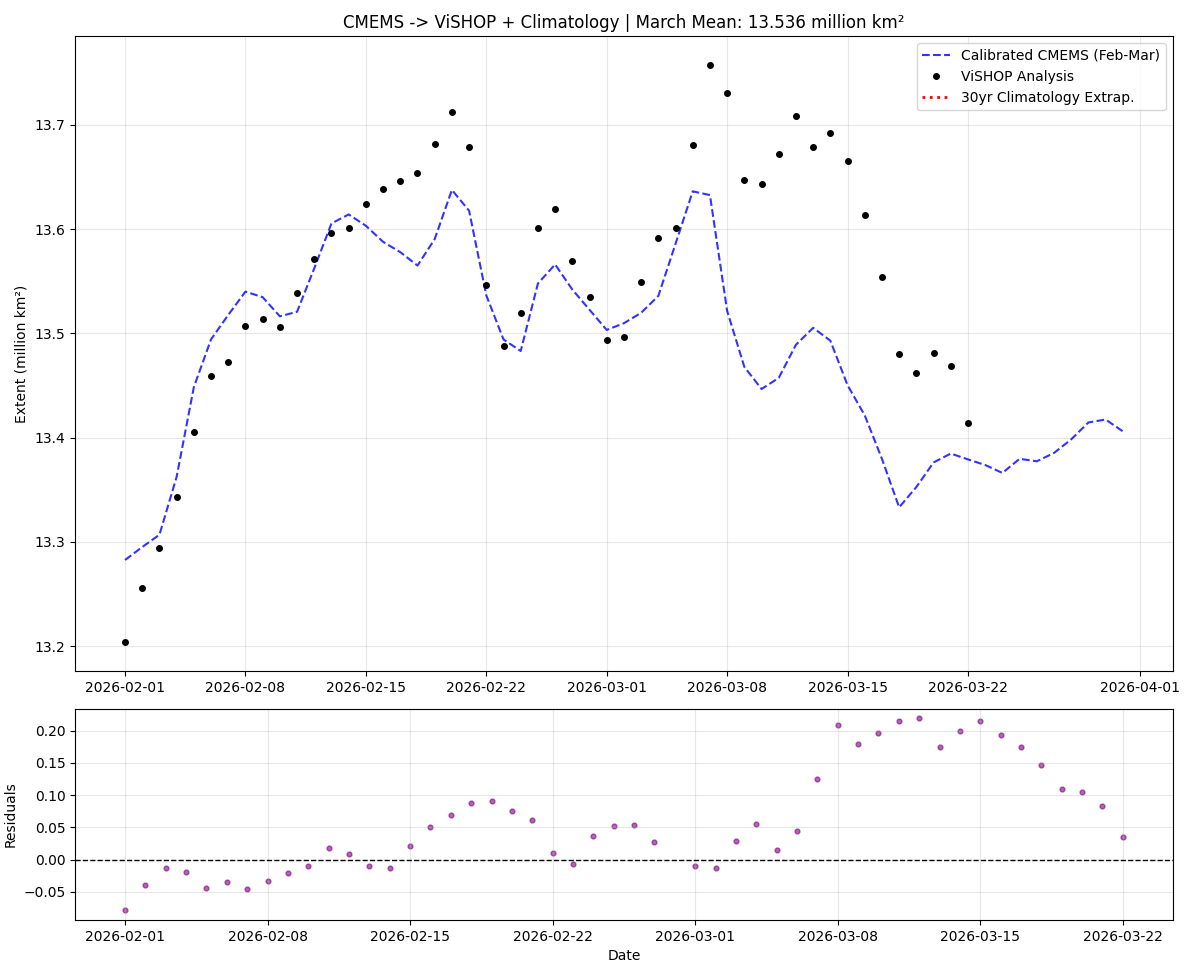
@ChristopherRandles The forecasts beyond next week still look very uncertain. That being said, I messed around with CMEMS (using Gemini to write all the scratch code) to come up with some guesses (it only goes out 10 days, i.e. covers 15th-24th); have to keep in mind it won't have great cross calibration between them since CMEMS has a higher grid res. I believe (case in point, the residuals from Mar. 8 become much worse since it sees most of Gulf of St. Lawrence is gone in CMEMS compared to ViSHOP still having some).
The trend though is worth noting that it look roughly flat for the next 10 days (very tiny positive average trend). That and the below in consideration, the market looks fairly well-calibrated to this as it stands, but in a week it looks very uncertain...
Here are the CMEMS sea ice values (before cross-calibration) (14th is last analysis date, 15+ is forecast):
>>> print(df_cm_sea_ice)
Extent
Date
2026-03-01 13.760095
2026-03-02 13.767934
2026-03-03 13.779992
2026-03-04 13.799471
2026-03-05 13.860527
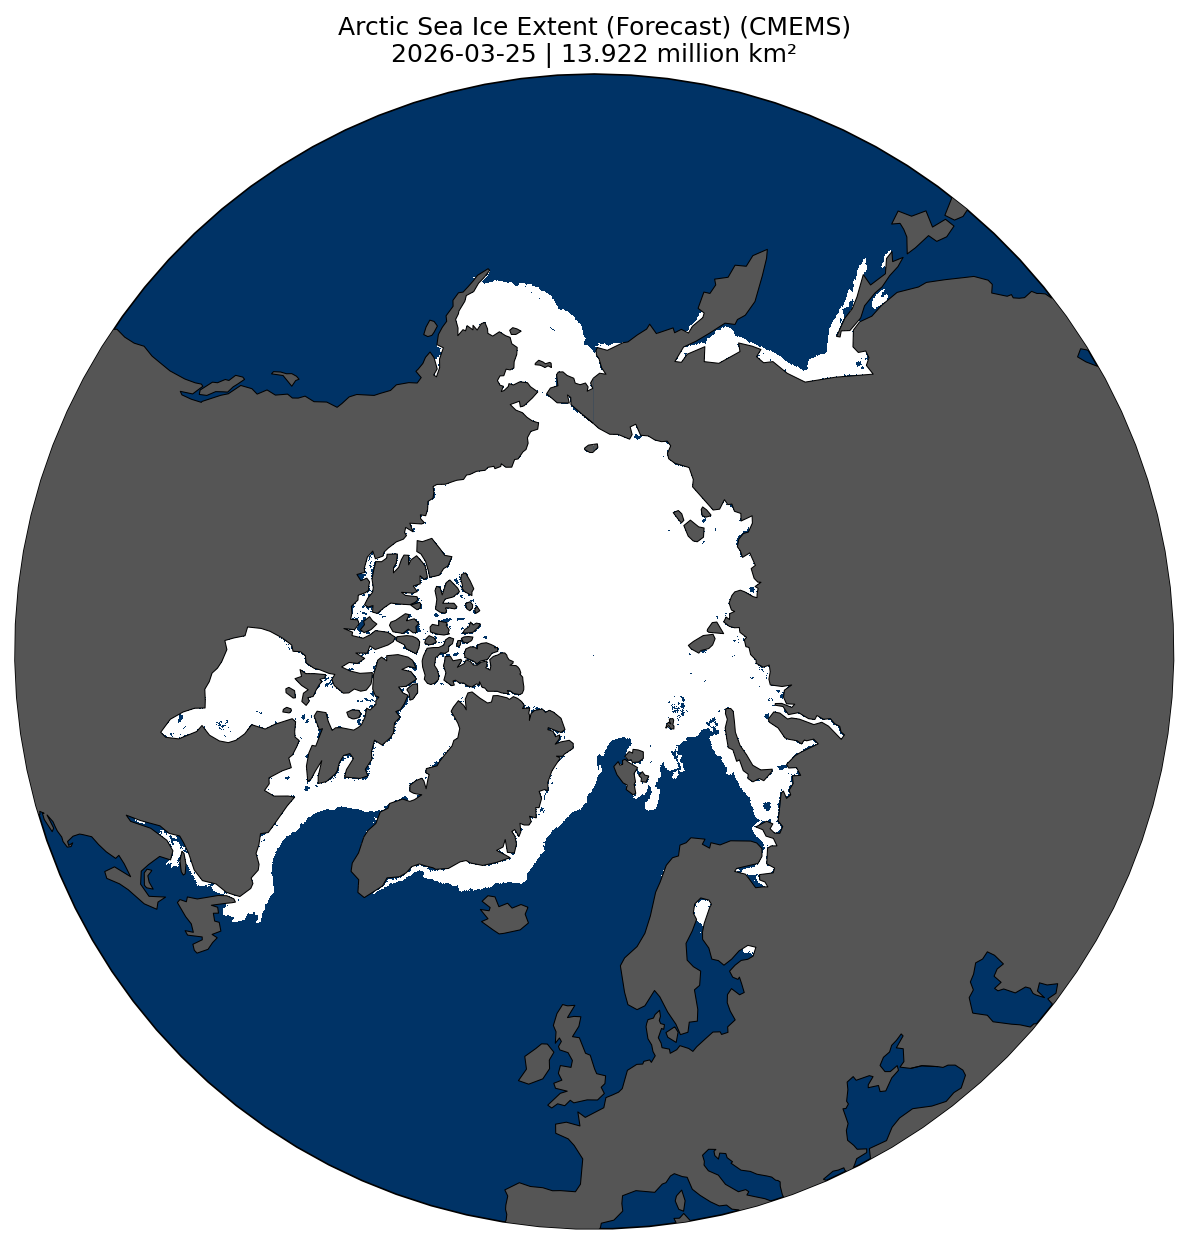
2026-03-06 13.922068
2026-03-07 13.918110
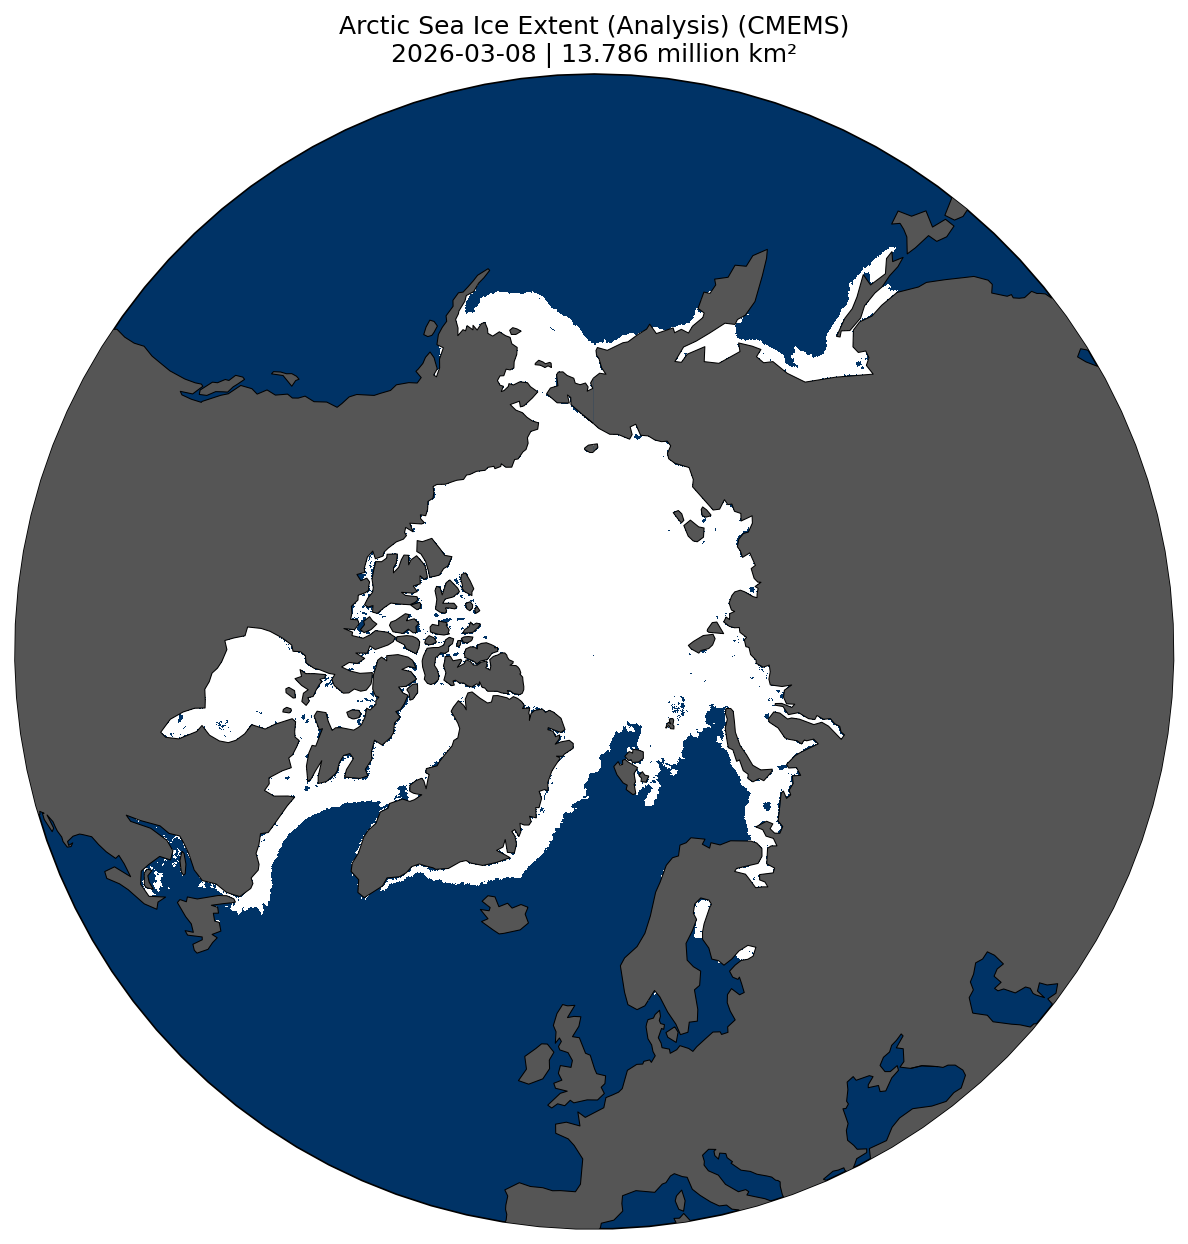
2026-03-08 13.786219
2026-03-09 13.720602
2026-03-10 13.702291
2026-03-11 13.723585
2026-03-12 13.780538
2026-03-13 13.822573
2026-03-14 13.843277
2026-03-15 13.835299
2026-03-16 13.835248
2026-03-17 13.825339
2026-03-18 13.802495
2026-03-19 13.823613
2026-03-20 13.851824
2026-03-21 13.862664
2026-03-22 13.848870
2026-03-23 13.828273
2026-03-24 13.830292
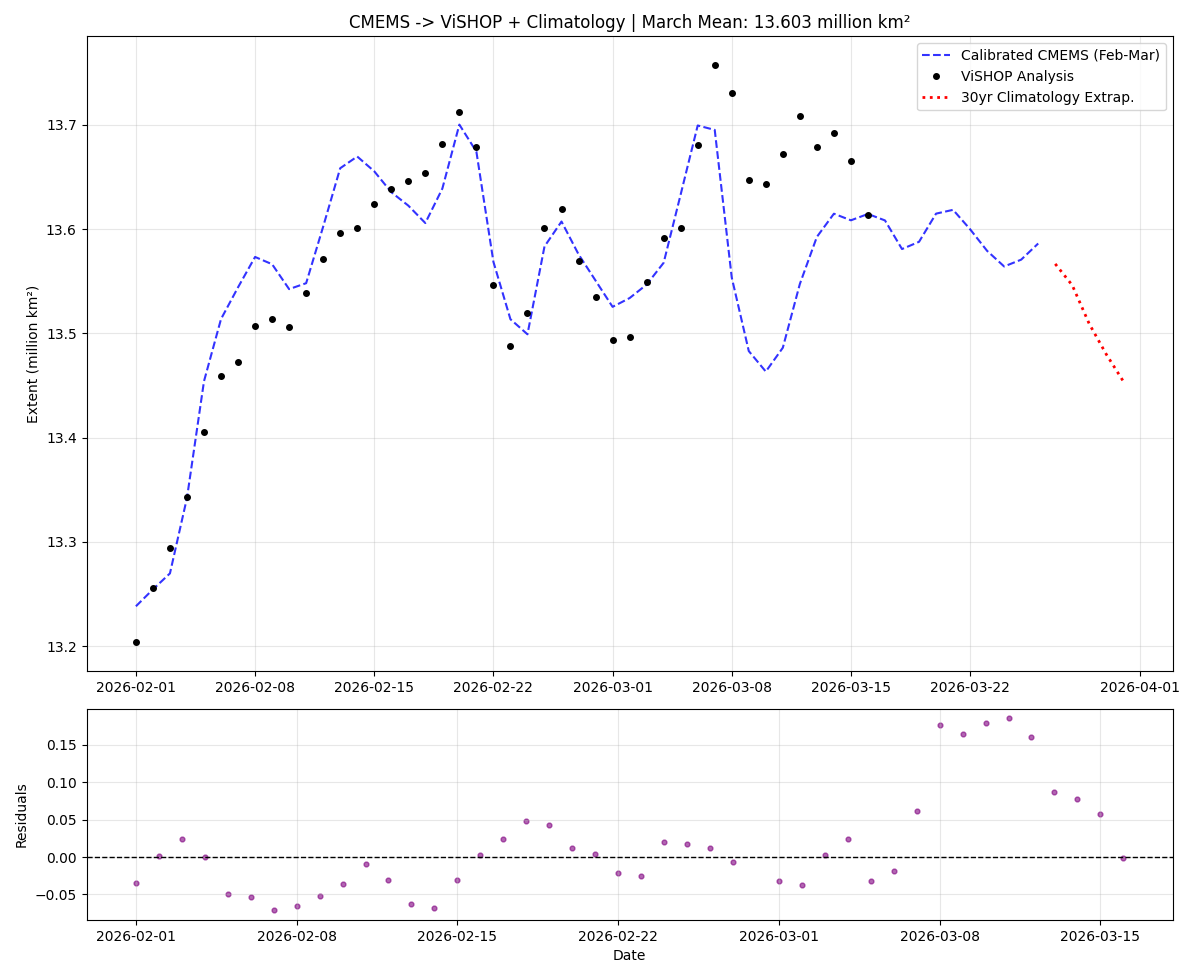
and the full_march cross calibrated (using last 30 years mean day-over-day change to extrapolate; this might be over done?)
>>> full_march
2026-03-01 13.493713
2026-03-02 13.496796
2026-03-03 13.549479
2026-03-04 13.591903
2026-03-05 13.600650
2026-03-06 13.680799
2026-03-07 13.757098
2026-03-08 13.730749
2026-03-09 13.647553
2026-03-10 13.643245
2026-03-11 13.672068
2026-03-12 13.708246
2026-03-13 13.679234
2026-03-14 13.692505
2026-03-16 13.598418
2026-03-17 13.587849
2026-03-18 13.563482
2026-03-19 13.586008
2026-03-20 13.616099
2026-03-21 13.627661
2026-03-22 13.612949
2026-03-23 13.590978
2026-03-24 13.593132
2026-03-25 13.585104
2026-03-26 13.582087
2026-03-27 13.562537
2026-03-28 13.542063
2026-03-29 13.504962
2026-03-30 13.475797
2026-03-31 13.449920
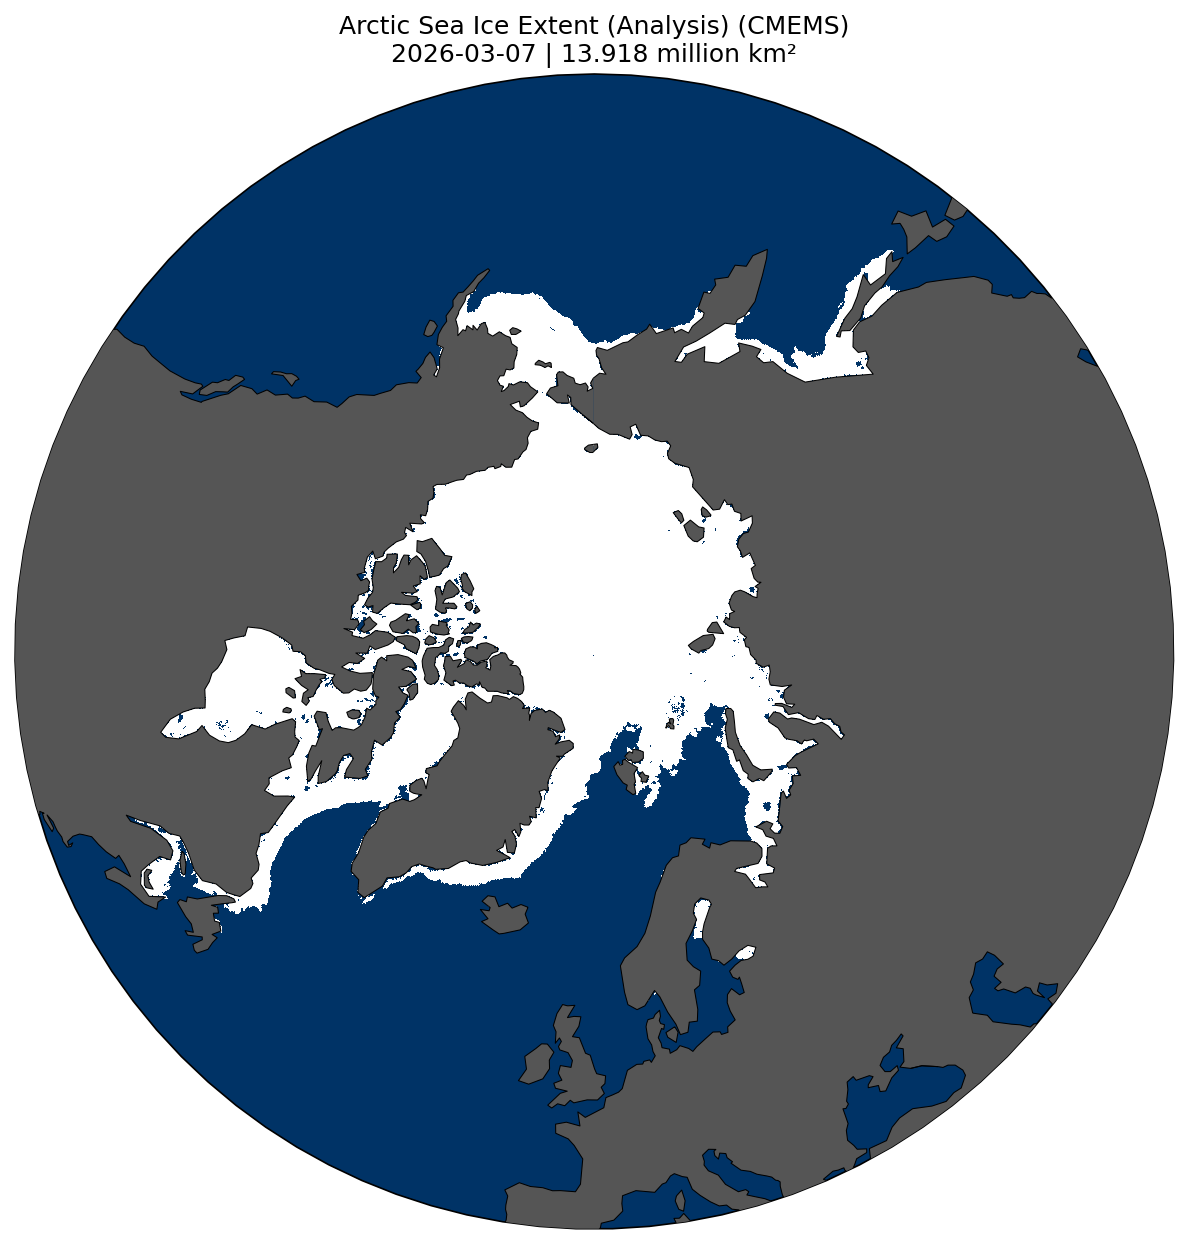
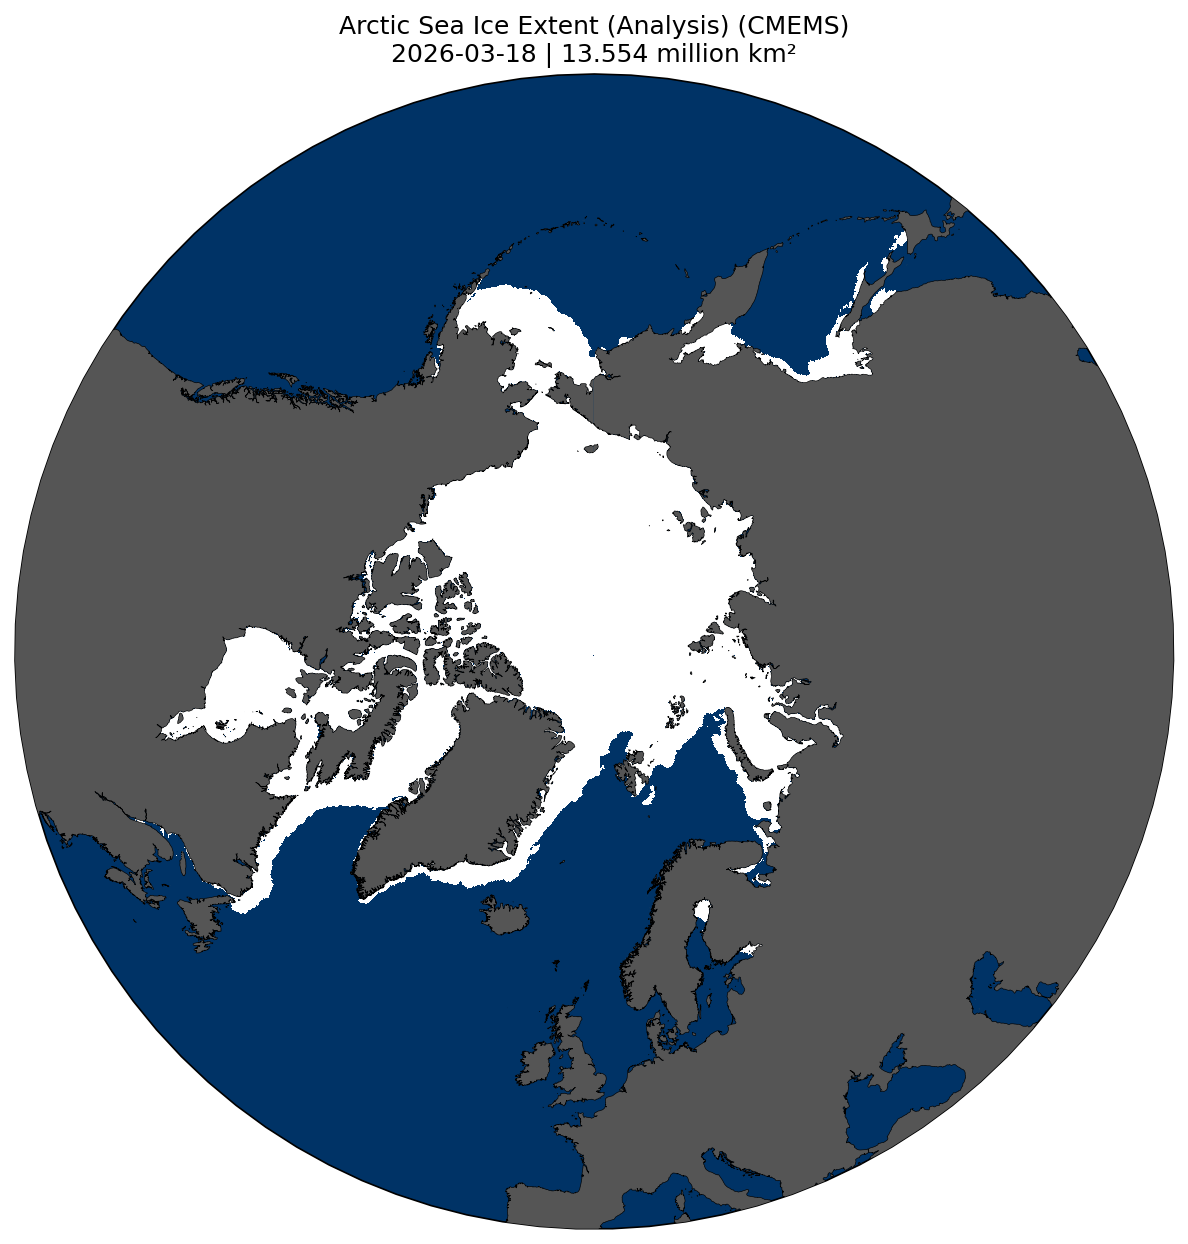
You can compare the plots of March 7-9 with the ViSHOP gallery's to see the main differences... (sorry they have different rotations)


@ChristopherRandles it's odd because in full_march, March 14 and before is ViSHOP, so the large dip is an artefact of the switch over to the cross-calibrated forecast (black dots to blue line) -- in reality its only a 0.01 dip in CMEMS


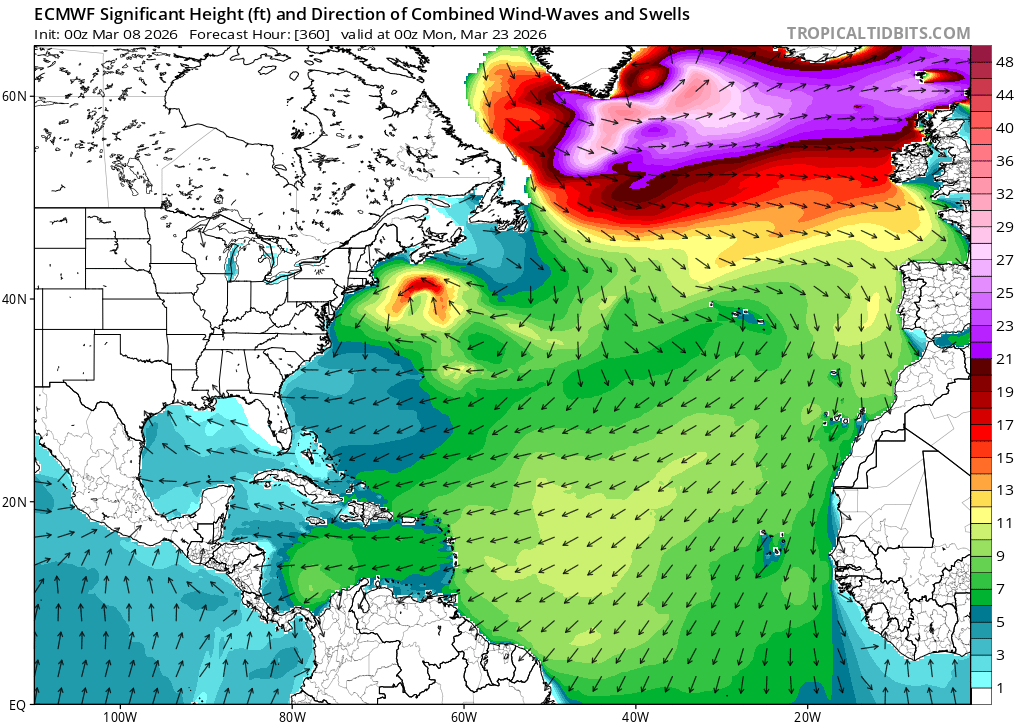
Per ECMWF, still past around the 22nd seems to be an unknown, especially what the synoptic situation will look like over NW Atlantic
~
CMEMS now shows a rise after the 22nd. Looks a bit too favorable to me overall. ECMWF implies the largest contributor will still be from the Greenland Sea, and CMEMS looks like it agrees, but showing positive contributions from nearly everywhere except the Sea of Okhotsk.

The residual from the latest analysis from yesterday's value is still a bit positive.
The residual for Mar 15, from the forecast I did yesterday though is quite a bit higher, 13.835 - 13.665 = 0.17 (forecast is still under)
Updating with today's CMEM daily, favors the higher bin more now. And if the forecast continues to be under, perhaps even more so, with the caveat of much higher uncertainty past the 22nd though.
(ViSHOP to March 15):
>>> full_march
2026-03-01 13.493713
2026-03-02 13.496796
2026-03-03 13.549479
2026-03-04 13.591903
2026-03-05 13.600650
2026-03-06 13.680799
2026-03-07 13.757098
2026-03-08 13.730749
2026-03-09 13.647553
2026-03-10 13.643245
2026-03-11 13.672068
2026-03-12 13.708246
2026-03-13 13.679234
2026-03-14 13.692505
2026-03-15 13.665479
2026-03-16 13.614501
2026-03-17 13.607963
2026-03-18 13.583444
2026-03-19 13.610620
2026-03-20 13.641917
2026-03-21 13.646520
2026-03-22 13.642752
2026-03-23 13.674129
2026-03-24 13.684092
2026-03-25 13.699223
2026-03-26 13.696206
2026-03-27 13.676656
2026-03-28 13.656181
2026-03-29 13.619081
2026-03-30 13.589916
2026-03-31 13.564038
and CMEMS, CMEMS->ViSHOP:
>>> df_full_cmems
Extent Calibrated
2026-02-01 13.492660 13.238706
2026-02-02 13.507763 13.254924
2026-02-03 13.522043 13.270258
2026-02-04 13.589457 13.342646
2026-02-05 13.693658 13.454536
2026-02-06 13.749195 13.514171
2026-02-07 13.777557 13.544626
2026-02-08 13.804654 13.573723
2026-02-09 13.798177 13.566768
2026-02-10 13.775927 13.542876
2026-02-11 13.781228 13.548568
2026-02-12 13.831755 13.602823
2026-02-13 13.883887 13.658803
2026-02-14 13.894360 13.670048
2026-02-15 13.881161 13.655875
2026-02-16 13.862507 13.635845
2026-02-17 13.850515 13.622967
2026-02-18 13.834948 13.606252
2026-02-19 13.865695 13.639268
2026-02-20 13.922850 13.700641
2026-02-21 13.898674 13.674680
2026-02-22 13.800306 13.569054
2026-02-23 13.749028 13.513992
2026-02-24 13.735590 13.499562
2026-02-25 13.814029 13.583789
2026-02-26 13.836294 13.607698
2026-02-27 13.807024 13.576267
2026-03-01 13.760095 13.525876
2026-03-02 13.767934 13.534293
2026-03-03 13.779992 13.547241
2026-03-04 13.799471 13.568158
2026-03-05 13.860527 13.633718
2026-03-06 13.922068 13.699800
2026-03-07 13.918110 13.695551
2026-03-08 13.786219 13.553927
2026-03-09 13.720602 13.483469
2026-03-10 13.702291 13.463806
2026-03-11 13.723585 13.486672
2026-03-12 13.780538 13.547827
2026-03-13 13.822573 13.592963
2026-03-14 13.843277 13.615195
2026-03-15 13.837382 13.608866
2026-03-16 13.842630 13.614501
2026-03-17 13.836541 13.607963
2026-03-18 13.813707 13.583444
2026-03-19 13.839016 13.610620
2026-03-20 13.868162 13.641917
2026-03-21 13.872448 13.646520
2026-03-22 13.868939 13.642752
2026-03-23 13.898161 13.674129
2026-03-24 13.907439 13.684092
2026-03-25 13.921530 13.699223
Yep, models don't have a good idea past 22nd still as it flip-flopped again past then...
Residual for yesterday's analysis on today's fit is very small.
Yesterday's prediction (init Mar 16 00Z) though was very good (residual of -0.000757), while the prediction from a couple days ago (init Mar 15 00Z) less good (0.025895).
>>> full_march
2026-03-01 13.493713
2026-03-02 13.496796
2026-03-03 13.549479
2026-03-04 13.591903
2026-03-05 13.600650
2026-03-06 13.680799
2026-03-07 13.757098
2026-03-08 13.730749
2026-03-09 13.647553
2026-03-10 13.643245
2026-03-11 13.672068
2026-03-12 13.708246
2026-03-13 13.679234
2026-03-14 13.692505
2026-03-15 13.665479
2026-03-16 13.613744
2026-03-17 13.608339
2026-03-18 13.580898
2026-03-19 13.587828
2026-03-20 13.614858
2026-03-21 13.618503
2026-03-22 13.599873
2026-03-23 13.579141
2026-03-24 13.564194
2026-03-25 13.570722
2026-03-26 13.586223
2026-03-27 13.566673
2026-03-28 13.546198
2026-03-29 13.509098
2026-03-30 13.479933
2026-03-31 13.454055
>>> df_full_cmems
Extent Calibrated
2026-02-01 13.492660 13.238315
2026-02-02 13.507763 13.254532
2026-02-03 13.522043 13.269865
2026-02-04 13.589457 13.342249
2026-02-05 13.693658 13.454134
2026-02-06 13.749195 13.513767
2026-02-07 13.777557 13.544220
2026-02-08 13.804654 13.573315
2026-02-09 13.798177 13.566361
2026-02-10 13.775927 13.542470
2026-02-11 13.781228 13.548162
2026-02-12 13.831755 13.602415
2026-02-13 13.883887 13.658391
2026-02-14 13.894360 13.669636
2026-02-15 13.881161 13.655464
2026-02-16 13.862507 13.635435
2026-02-17 13.850515 13.622558
2026-02-18 13.834948 13.605843
2026-02-19 13.865695 13.638857
2026-02-20 13.922850 13.700227
2026-02-21 13.898674 13.674268
2026-02-22 13.800306 13.568647
2026-02-23 13.749028 13.513588
2026-02-24 13.735590 13.499158
2026-02-25 13.814029 13.583381
2026-02-26 13.836294 13.607289
2026-02-27 13.807024 13.575860
2026-03-01 13.760095 13.525471
2026-03-02 13.767934 13.533887
2026-03-03 13.779992 13.546835
2026-03-04 13.799471 13.567750
2026-03-05 13.860527 13.633308
2026-03-06 13.922068 13.699387
2026-03-07 13.918110 13.695138
2026-03-08 13.786219 13.553521
2026-03-09 13.720602 13.483066
2026-03-10 13.702291 13.463404
2026-03-11 13.723585 13.486268
2026-03-12 13.780538 13.547420
2026-03-13 13.822573 13.592555
2026-03-14 13.843277 13.614786
2026-03-15 13.837382 13.608457
2026-03-16 13.843060 13.614554
2026-03-17 13.837273 13.608339
2026-03-18 13.811716 13.580898
2026-03-19 13.818170 13.587828
2026-03-20 13.843344 13.614858
2026-03-21 13.846738 13.618503
2026-03-22 13.829388 13.599873
2026-03-23 13.810079 13.579141
2026-03-24 13.796159 13.564194
2026-03-25 13.802239 13.570722
2026-03-26 13.816675 13.586223
Gulf of St. Lawrence lost almost all of its sea ice yesterday (catching up with the finer CMEMS analysis from a couple days ago), and in the Labrador Sea lost some more as well...
Still seems to be uncertainty after the 23rd for EPS so don't have much confidence past then...
CMEMS shows a greater drop in the uncertainty period now, this favoring now more the 13.4-13.6 bin:
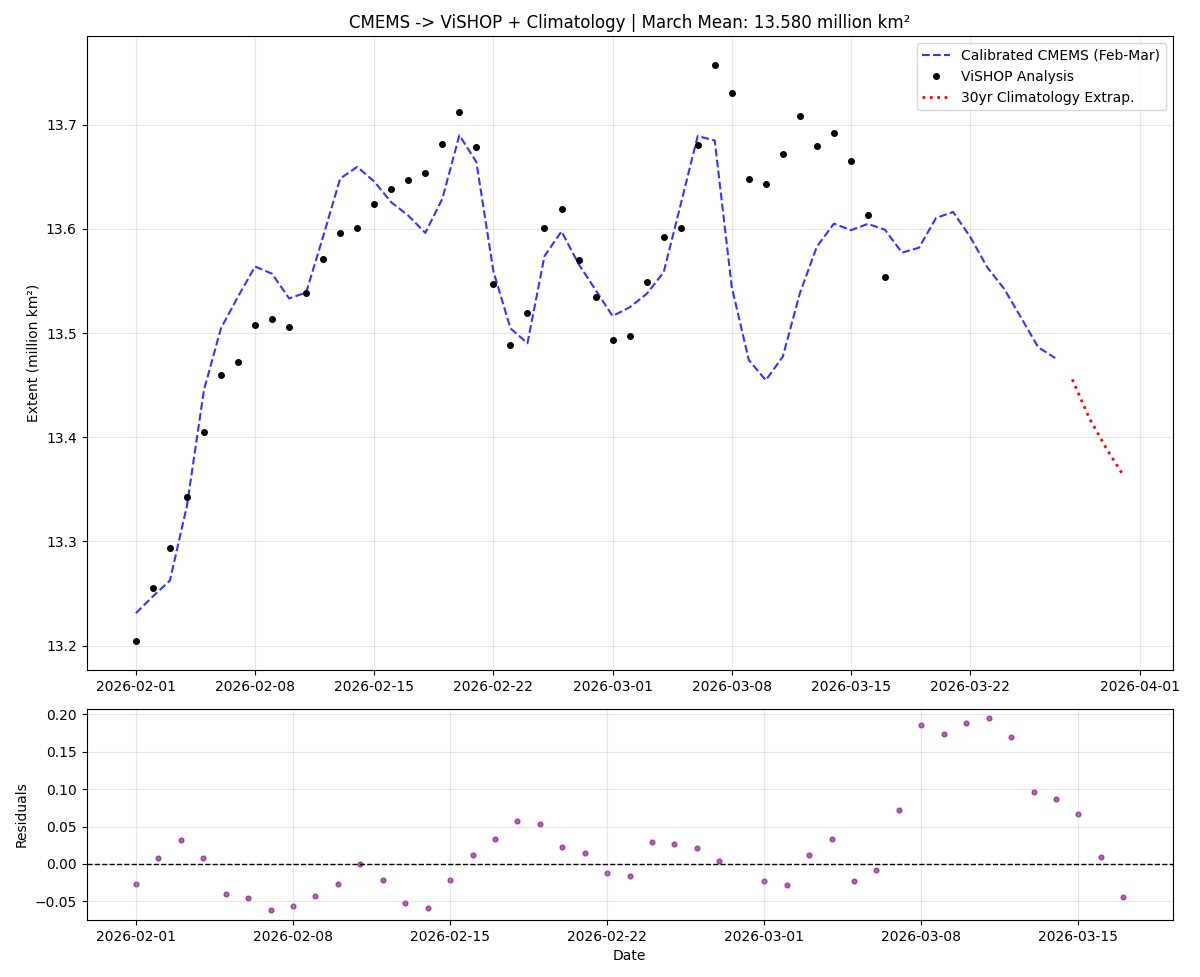
>>> full_march
2026-03-01 13.493713
2026-03-02 13.496796
2026-03-03 13.549479
2026-03-04 13.591903
2026-03-05 13.600650
2026-03-06 13.680799
2026-03-07 13.757098
2026-03-08 13.730749
2026-03-09 13.647553
2026-03-10 13.643245
2026-03-11 13.672068
2026-03-12 13.708246
2026-03-13 13.679234
2026-03-14 13.692505
2026-03-15 13.665479
2026-03-16 13.613744
2026-03-17 13.554215
2026-03-18 13.577225
2026-03-19 13.582021
2026-03-20 13.610532
2026-03-21 13.616277
2026-03-22 13.592548
2026-03-23 13.563381
2026-03-24 13.542492
2026-03-25 13.514695
2026-03-26 13.486432
2026-03-27 13.476036
2026-03-28 13.455561
2026-03-29 13.418461
2026-03-30 13.389296
2026-03-31 13.363418
>>> df_full_cmems
Extent Calibrated
2026-02-01 13.492660 13.231183
2026-02-02 13.507763 13.247290
2026-02-03 13.522043 13.262518
2026-02-04 13.589457 13.334410
2026-02-05 13.693658 13.445532
2026-02-06 13.749195 13.504759
2026-02-07 13.777557 13.535005
2026-02-08 13.804654 13.563902
2026-02-09 13.798177 13.556994
2026-02-10 13.775927 13.533267
2026-02-11 13.781228 13.538920
2026-02-12 13.831755 13.592803
2026-02-13 13.883887 13.648398
2026-02-14 13.894360 13.659566
2026-02-15 13.881161 13.645491
2026-02-16 13.862507 13.625598
2026-02-17 13.850515 13.612809
2026-02-18 13.834948 13.596208
2026-02-19 13.865695 13.628997
2026-02-20 13.922850 13.689949
2026-02-21 13.898674 13.664167
2026-02-22 13.800306 13.559265
2026-02-23 13.749028 13.504581
2026-02-24 13.735590 13.490250
2026-02-25 13.814029 13.573899
2026-02-26 13.836294 13.597644
2026-02-27 13.807024 13.566429
2026-03-01 13.760095 13.516383
2026-03-02 13.767934 13.524743
2026-03-03 13.779992 13.537602
2026-03-04 13.799471 13.558375
2026-03-05 13.860527 13.623486
2026-03-06 13.922068 13.689115
2026-03-07 13.918110 13.684894
2026-03-08 13.786219 13.544242
2026-03-09 13.720602 13.474267
2026-03-10 13.702291 13.454739
2026-03-11 13.723585 13.477448
2026-03-12 13.780538 13.538183
2026-03-13 13.822573 13.583011
2026-03-14 13.843277 13.605090
2026-03-15 13.837382 13.598804
2026-03-16 13.843060 13.604859
2026-03-17 13.837757 13.599204
2026-03-18 13.817148 13.577225
2026-03-19 13.821645 13.582021
2026-03-20 13.848380 13.610532
2026-03-21 13.853767 13.616277
2026-03-22 13.831516 13.592548
2026-03-23 13.804166 13.563381
2026-03-24 13.784578 13.542492
2026-03-25 13.758512 13.514695
2026-03-26 13.732009 13.486432
2026-03-27 13.722261 13.476036
@ChristopherRandles Correct, it looks poor in terms of magnitude but the trend has been correct (even my subjective forecasts were too timid in the decrease): the last couple days lost 0.05 to 0.07 per day whereas the forecasts predicted a loss around 0.01 to 0.03 per day.
The latest CMEMS daily revised several of the past values downwards also (all the way back to March 11). Based on the last regression from today it's even further worse now in terms of recent bias in absolute terms (it looks more like a structural break now after March 7), but in terms of magnitude for day over day changes the decreases more closely match ViSHOP now in the latest daily.
I thought based on the residuals on Feb. the residuals might improve with time but its gotten worse in absolute terms (although perhaps more relatively consistent over the last 10 days) -- so the latest forecast is perhaps too low for the rest of March given the large residuals).
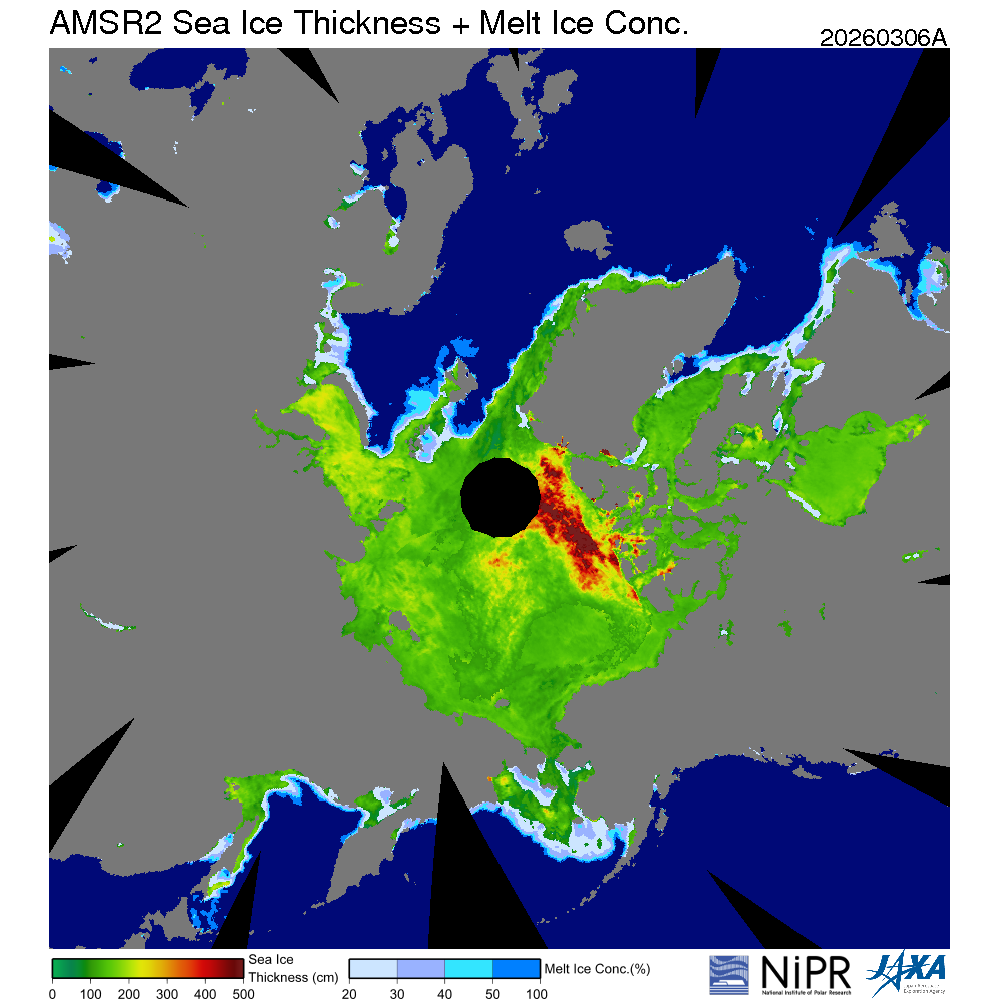
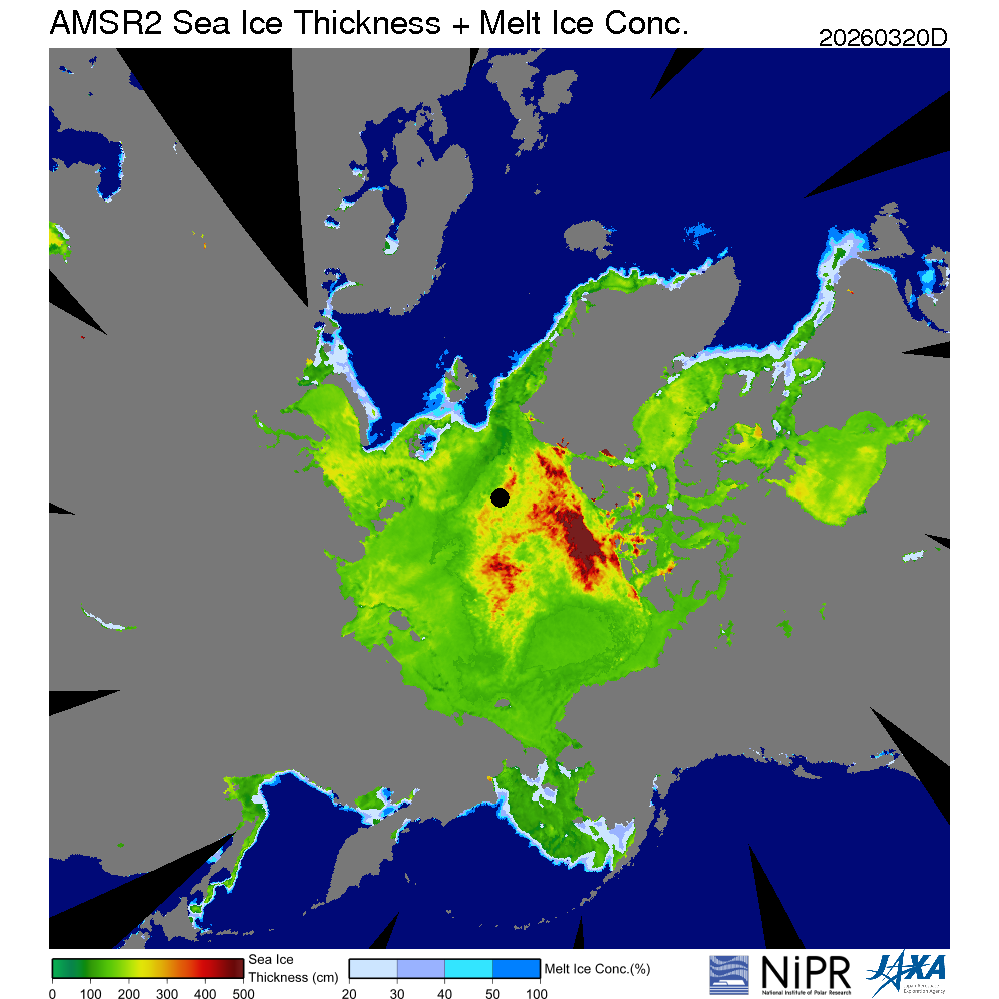
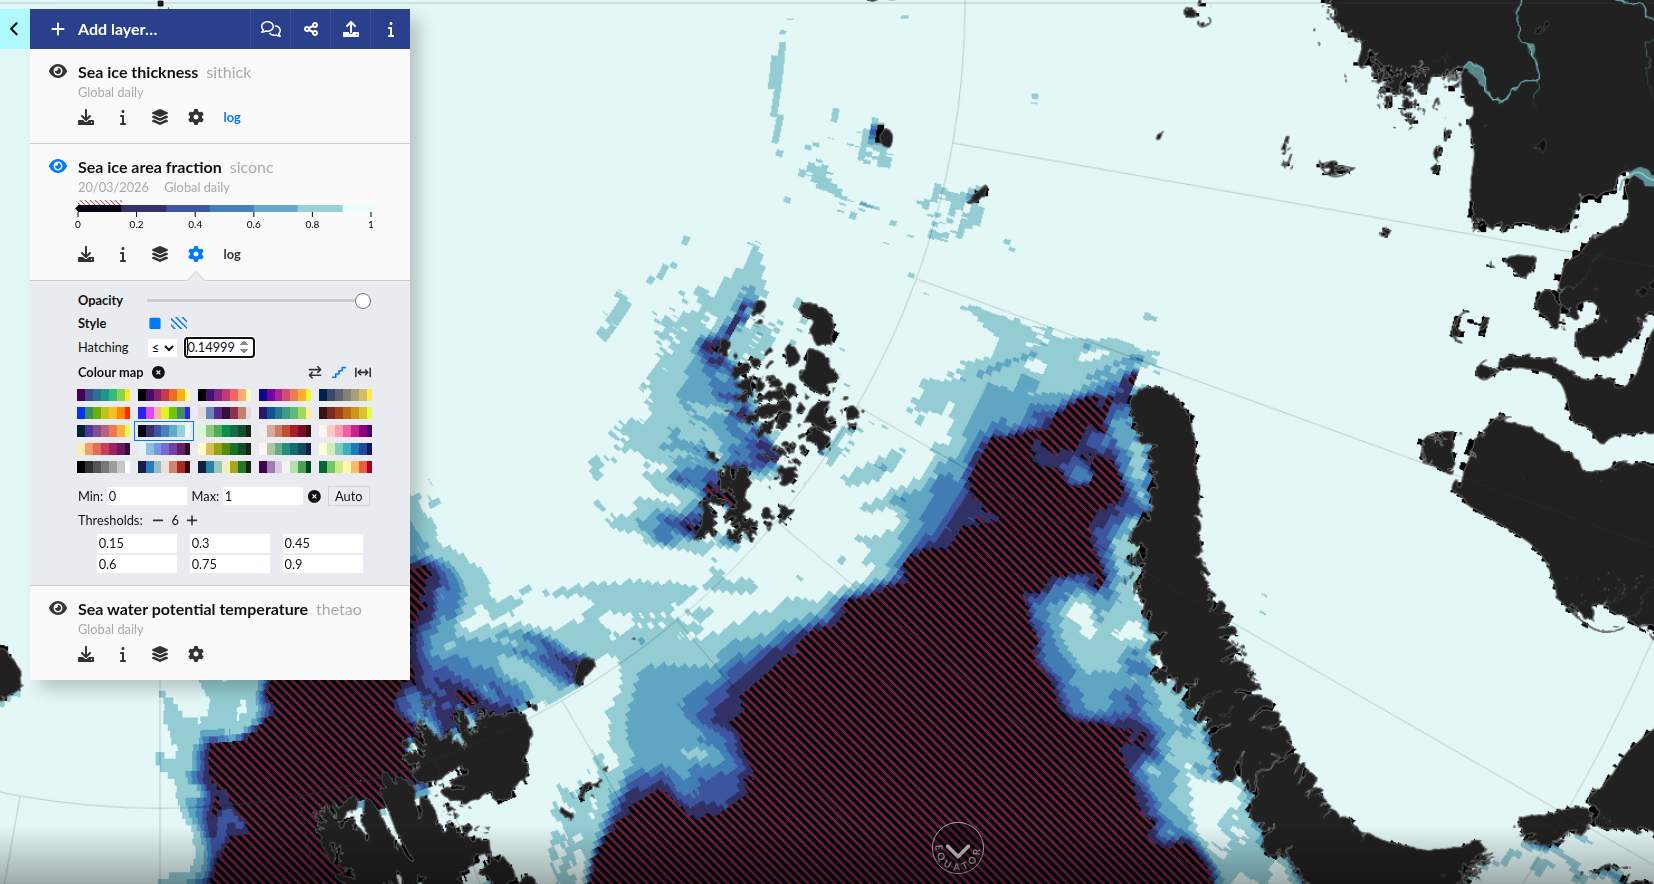
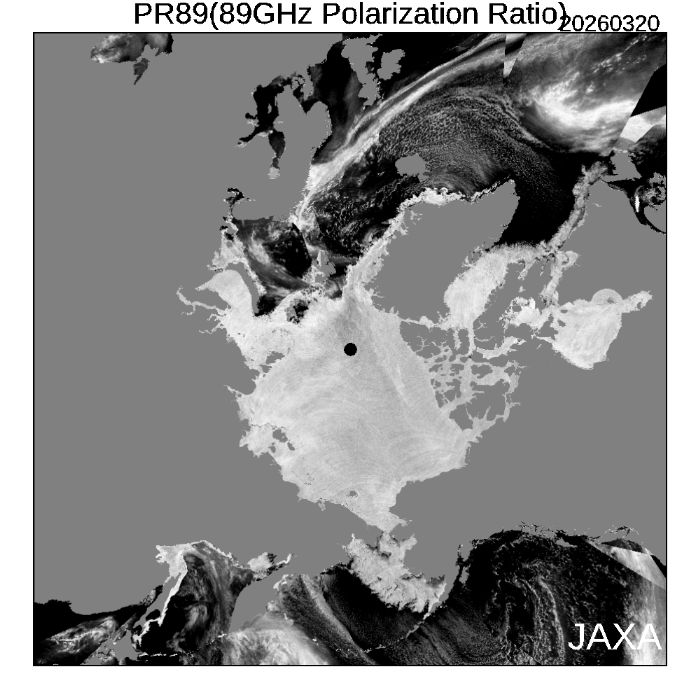
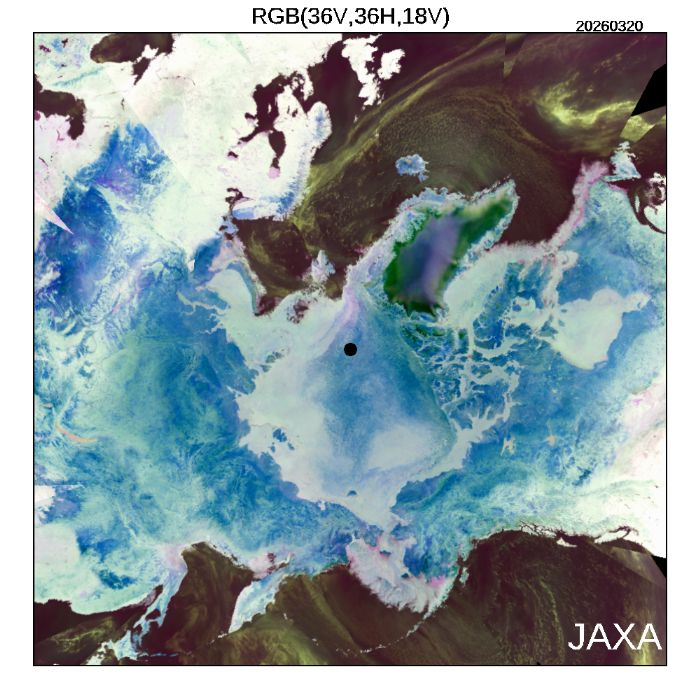
I don't know how CMEMS ingests but the ViSHOP seems to be more rapid: poleward of Franz Josef Island for instance the ice has been compacting but I don't see this on CMEMS -- it might be missing/lagged with the latest data, but its hard to tell for sure since they are very different.
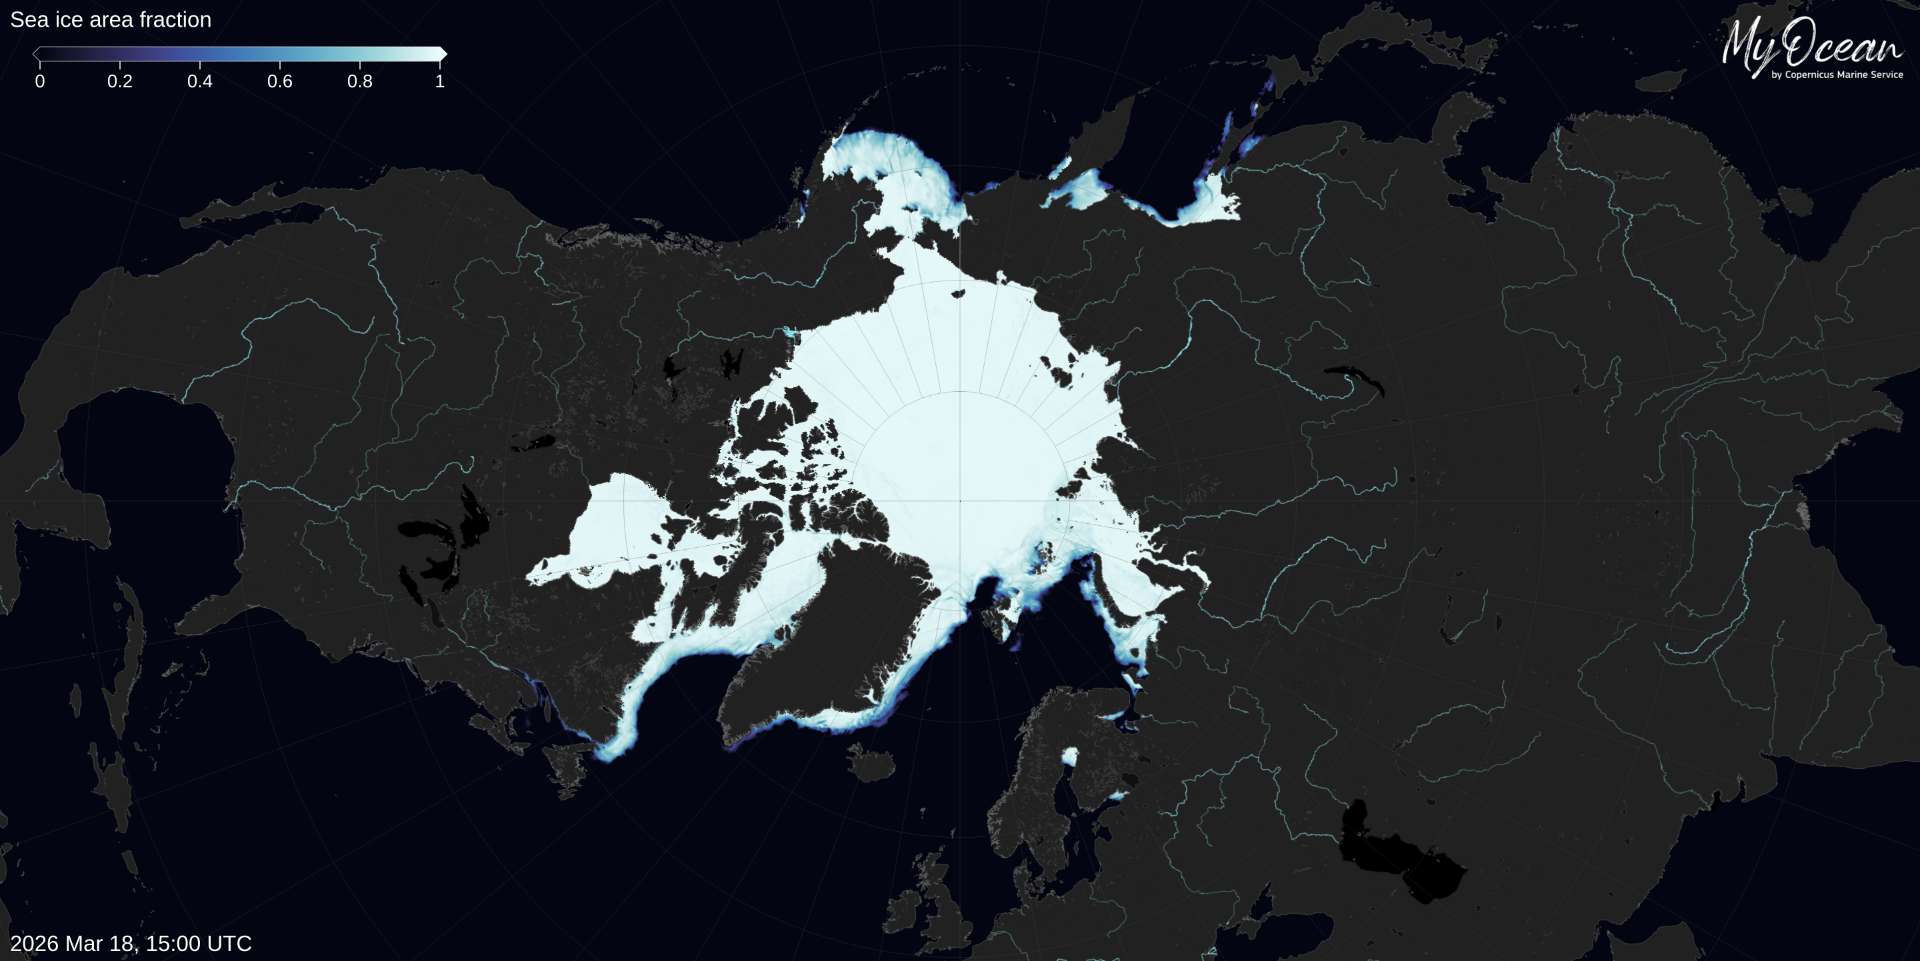
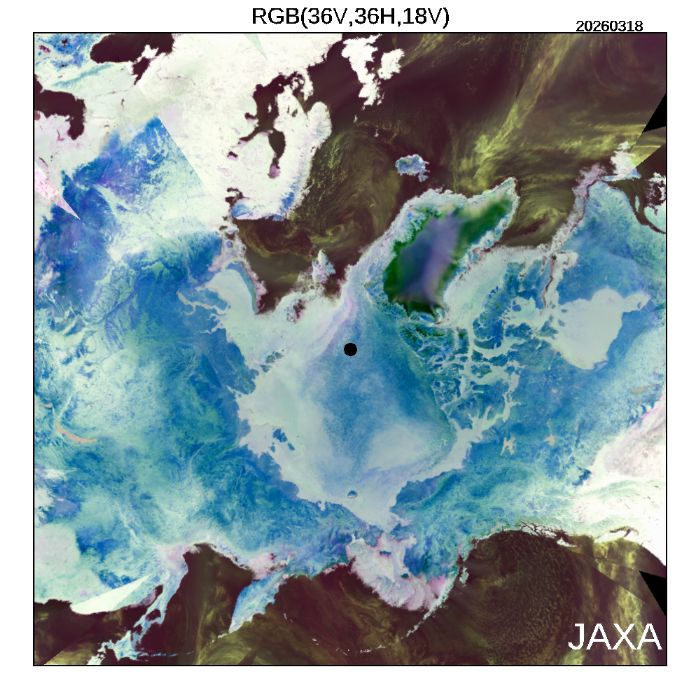
Although CMEMS doesn't have nearly as low sea ice near there it looks like a polynya on ViSHOP (especially on RGB):

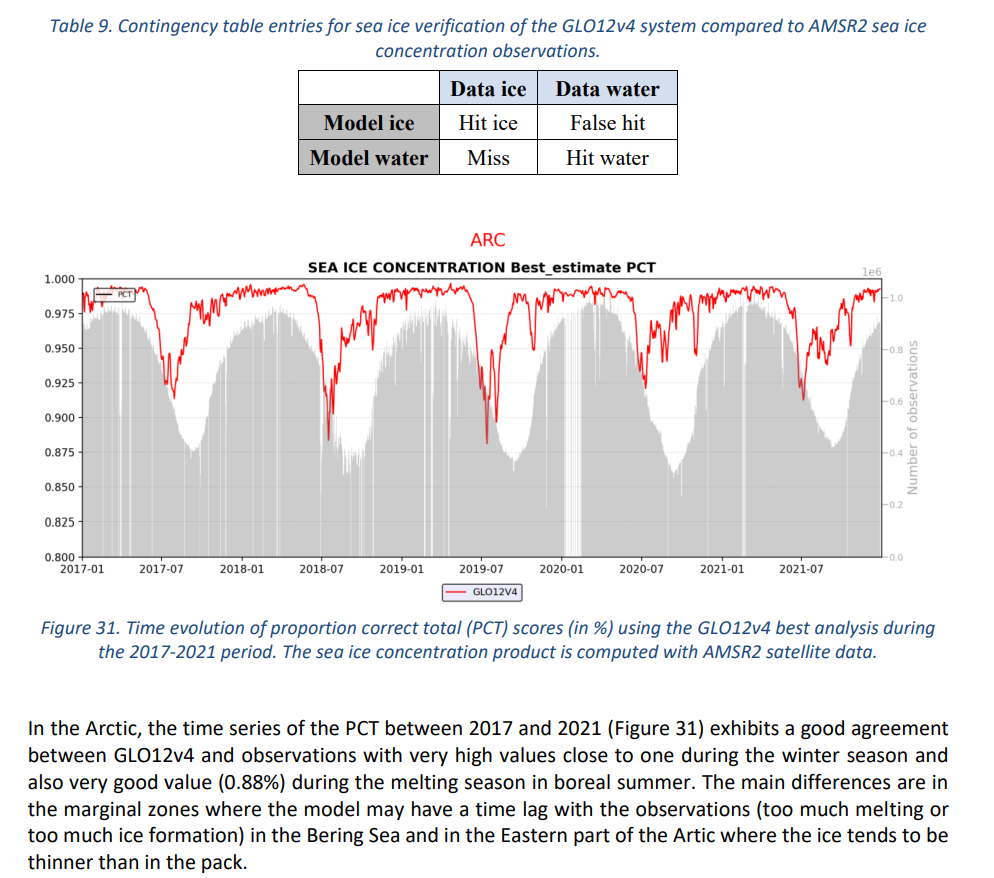
Edit: I looked at the validation document for CMEMS, and based on the reference, SIC can be off by (eyeballing it) 2% during March, and it does mention the data can be lagged especially in the most sensitive areas... I don't know how much this would translate to SIE though but its possible the residuals are not actually "poor" given the validation data.
I think still the trend though is useful (if only for a few days until we get past the 22nd) if not the exact magnitude (which still indicates 13.4-13.6 being the most likely but 13.6-13.18 ranking a close second accounting for the recent residual biases).
@parhizj >"13.6-13.8 a close second"
I am not seeing that: The year with highest upward movements, 2015, reduces the current average of 13.625 to 13.591. i.e. none of my 18 years movements produces a value above 13.6! With only 18 example movements we could get a result that shows more gain than the most extreme example particularly if the ice bounces back up quickly after the last 3 to 5 days of declines, but I don't see much reason to assign much more than a 5% chance.
The average of changes from 18th reduces current average from 13.625 to 13.511 and
the most extreme losses of ice 2020 movements from my 18 years show the average reducing to 13.394. This is only just below 13.4 and maybe after strong losses of last few days and ice being at low levels it may not be sensible to assign much probability to such extreme further losses. So despite there being an example of a below 13.4 result perhaps the probability is similar or even lower than the probability of 13.6-13.8. So 13.6-13.8 might be second most probable outcome but it seems like 2nd and 3rd places are close and a long long way behind probability of 13.4-13.6 rather than being a 'close second'.
If there is a quick sharp bounce back up in the ice level, then you might become correct about this but I don't think so currently.
@ChristopherRandles Yeah, climatologically I agree with your analysis. I meant a close second based on that most recent run's fit, which very roughly, puts it in the 13.55-13.60 range if you naively adjust for recent residuals by the most recent residuals +0.15 to +0.20 range.
What would you put as your best center point guess though?
@parhizj Best centre point?
I did say
The average of changes from 18th reduces current average from 13.625 to 13.511
Not really sure I have much or even anything to suggest I should adjust this 13.51 much. I might be inclined to guess that after a few days of strong downward movement a bounce back up might become more likely than continued strong downward movement. Also strong downward movement from a low ice level might be less common than at a high ice level, this being partly based on low ice having a more northerly edge on average so the sun is typically lower. However if I should adjust the central estimate up for these factors, then I am unsure of by how much. I tend to think there is a lot of noise compared to what we can reliably forecast so I doubt it is much of an adjustment so still near centre of 13.4 to 13.6 range even if the signs are that I think it is slightly above 13.5
Yesterday the loss looked like it was led again by compaction in the Barents Sea; waves from ECM det. indicate the compaction should continue today also, and the forecast appears to show the wind/waves should continue to cause (slower) drift for compaction through the 22nd. After that it looks mixed in the Barents sea but possibly net negative (some advance from Franz Josef Island but more compaction towards Russia). Seems speculative past the 24th now though, with a number of scenarios there...
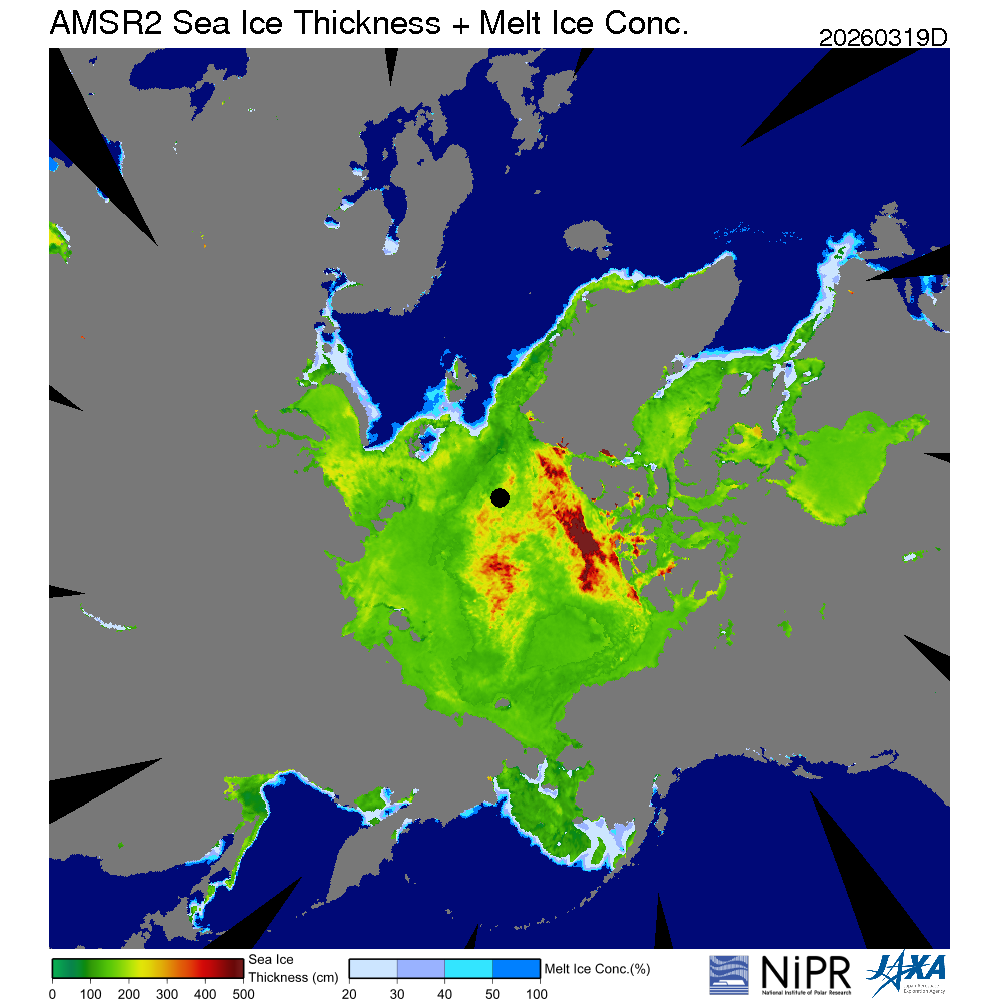
Looking at the rest of the Arctic for just today, looks like Labrador Sea will have advancement, Bering Sea will have some slow advancement, but compaction in the Sea of Okhotsk. Subjectively, given how strong the waves are still in the Barents Sea (and how thin the ice is there with a lot of melt) I am guessing the losses should outweigh the gains in the Labrador Sea, and similarly the Sea of Okhotsk losses might outweigh the slow gains in the Bering Sea, so net today (Mar 20th) we probably should expect another small dip like yesterday.
The polynya mentioned yesterday near Franz Josef Island continues to grow.
CMEMS regression still looks poor, and it got the trend wrong yesterday. At this point it looks like its lagging behind just a subjective interpretation following the waves and the wind from ECM, as if its possible the data going in is too lagged it won't be useful as it still looks different than ViSHOP with respect to the polynya.


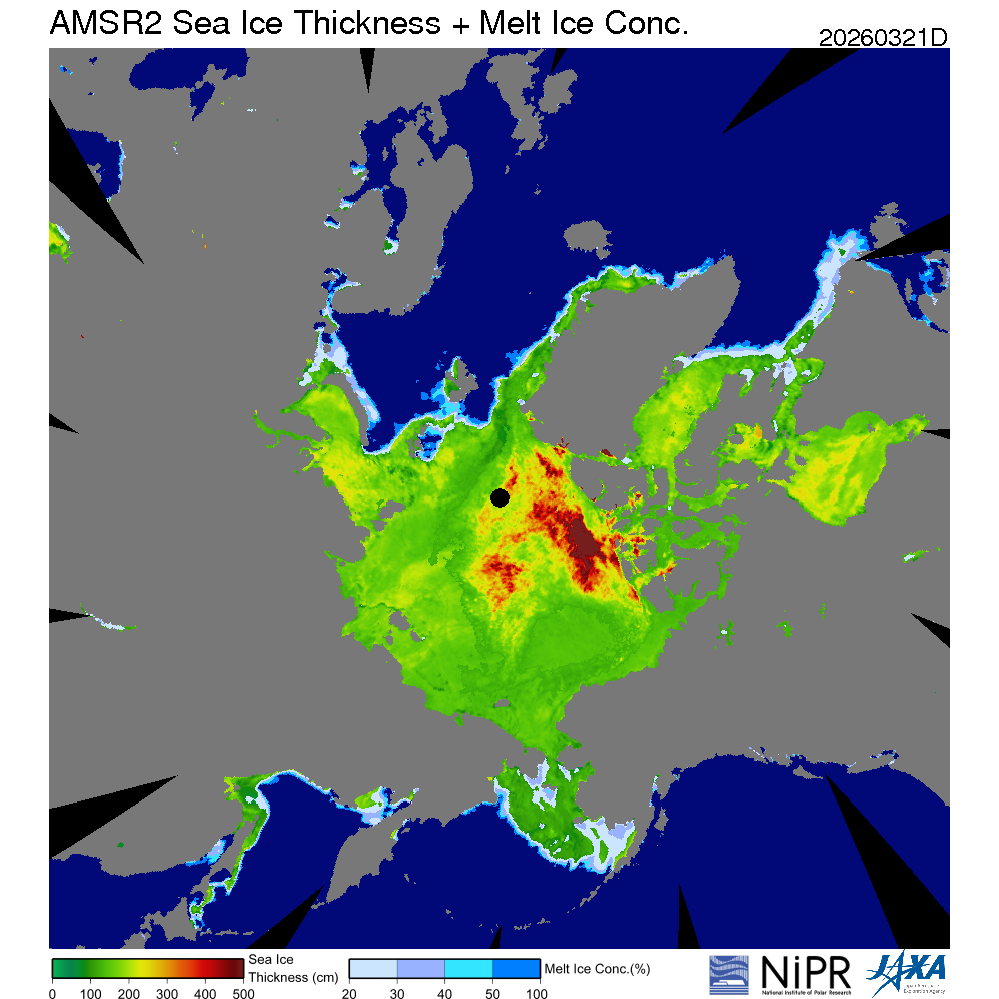
Got yesterday wrong as it increased by about 0.02 (the loss from compaction in the Barents Sea was far less than I anticipated from looking at ECM's waves).
Most of the increase looks like it came from the Labrador Sea (including melt off the coast of Newfoundland); there might have been a small, erroneous contribution from clouds marked as sea ice in the Denmark Strait. Bering Sea also contributed a bit. Looks like a good chunk in Sea of Okhotsk has started to melt.
Looking at CMEMS products around the polynya (that I mentioned the last few days) it really looks like its possible perhaps the ingests for it are delayed by a few days from showing up (perhaps up to 4-5 days?)... As it shows in CMEMS the sea ice thickness there near 0.1 m where ViSHOP shows mostly all melted (and the cloud free images in the lower and upper bands from satellite would seem to much more clearly match ViSHOP)
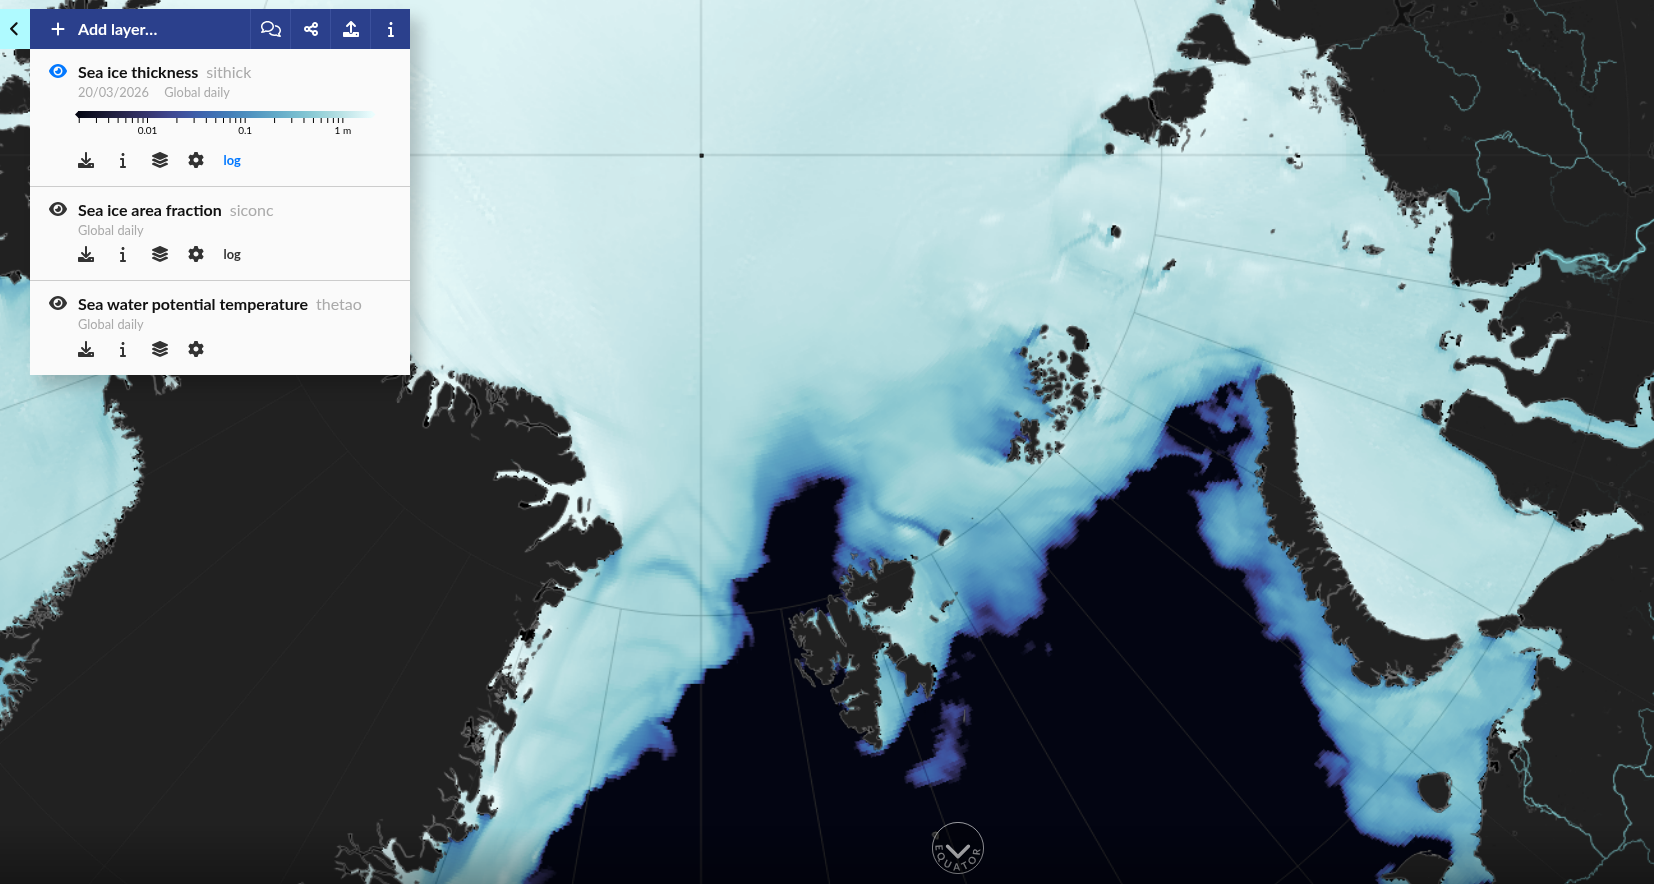
(Hatched area would be no sea ice doesn't look to be explained by difference in resolutions):
So since I subjectively got it wrong and CMEMS got the trend right yesterday, adding 0.1 (the last residual) for 21th onwards implies a value of 13.56.
I did look briefly at the wind/waves again for the 00Z ECMWF around the Barents Sea and they changed again compared to what I saw yesterday (much more neutral going further out) which shows how hard it is to predict. Today's run shows quite a bit more growth in the Labrador Sea further out again
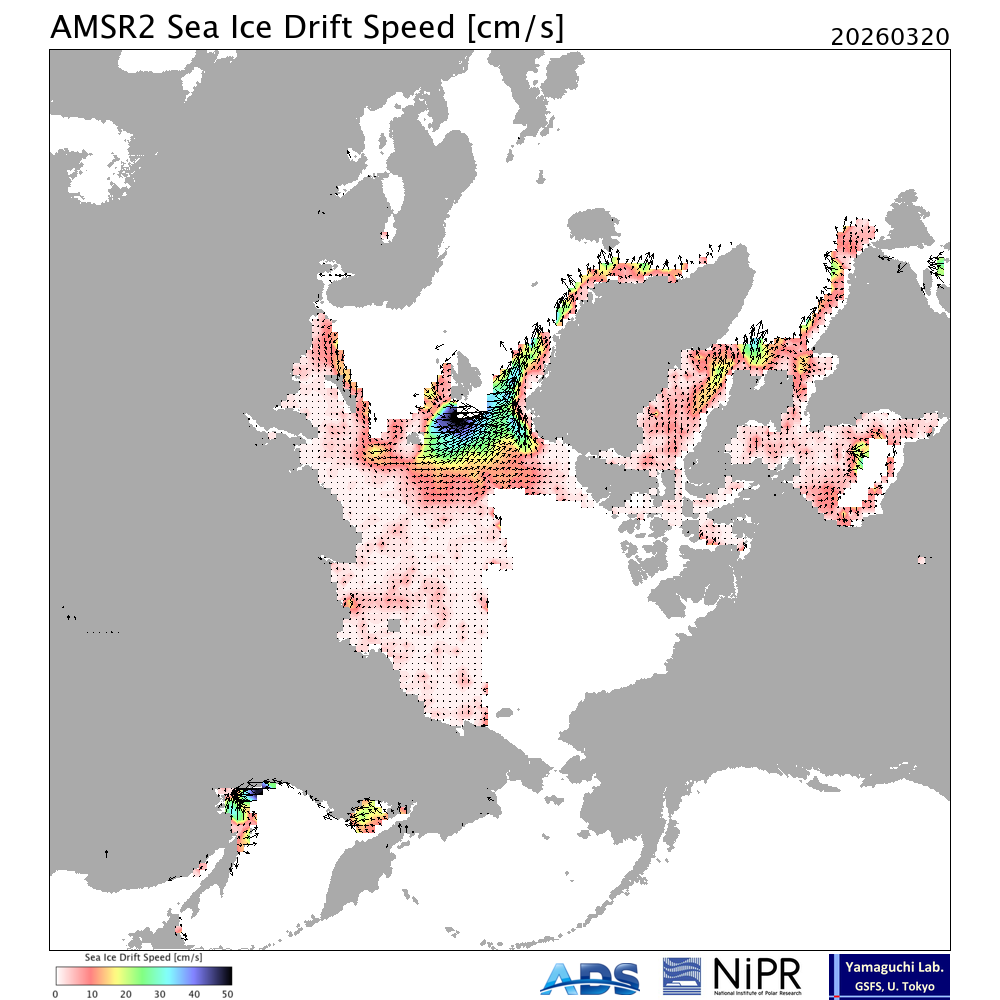
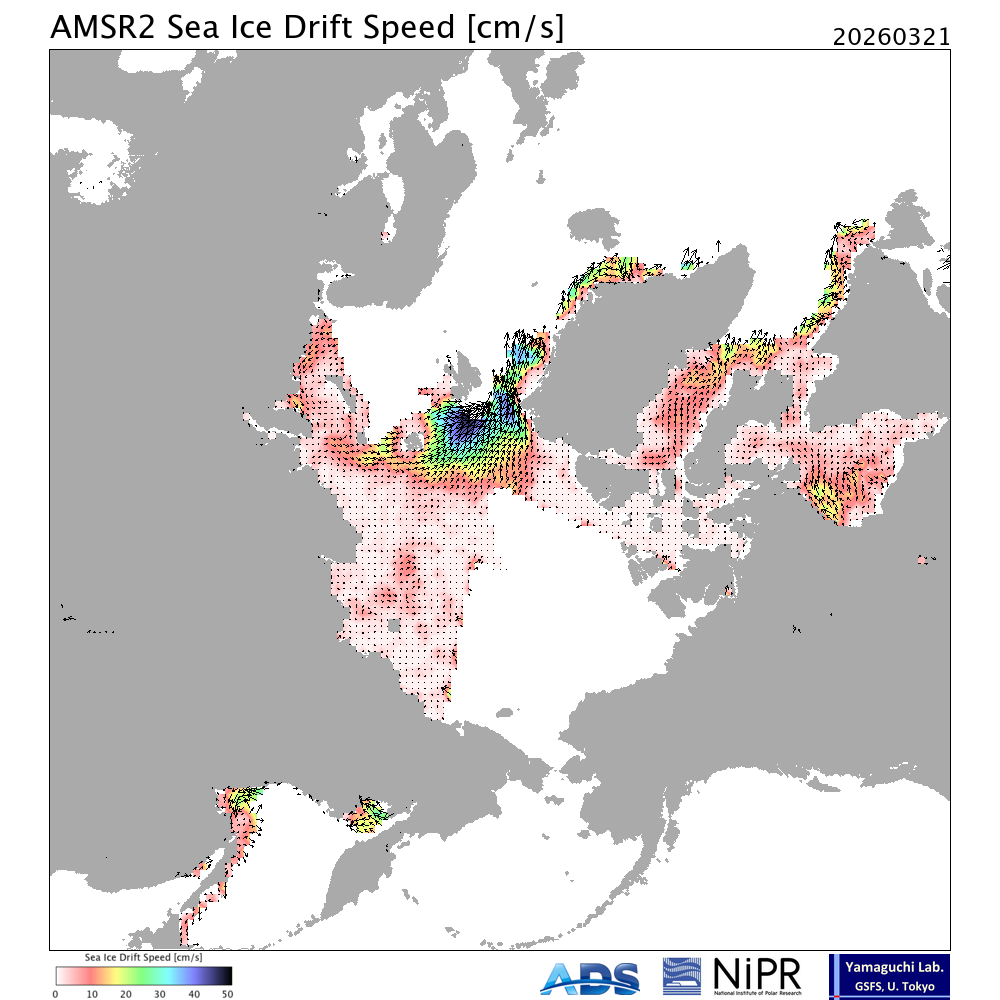
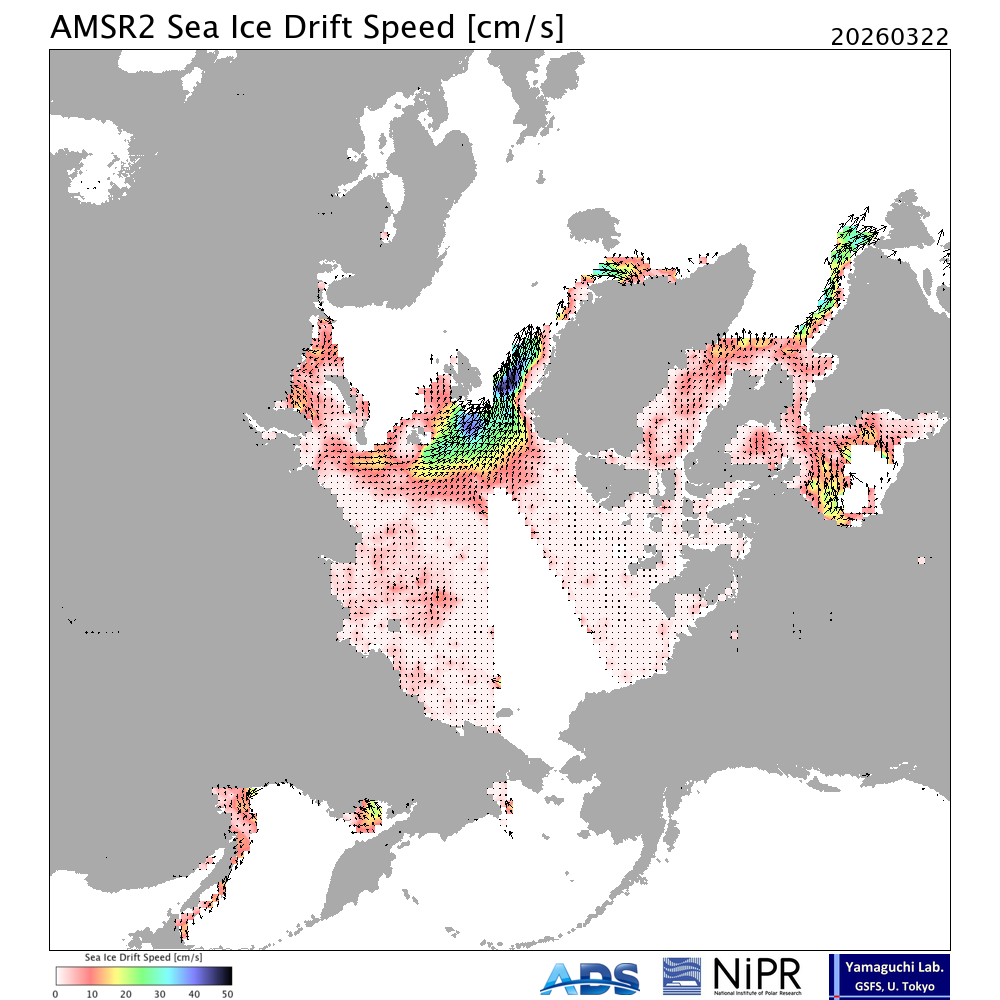
The Fram Strait appears that the same westward drift will continue at least for today (as in the drift vector image from ViSHOP).
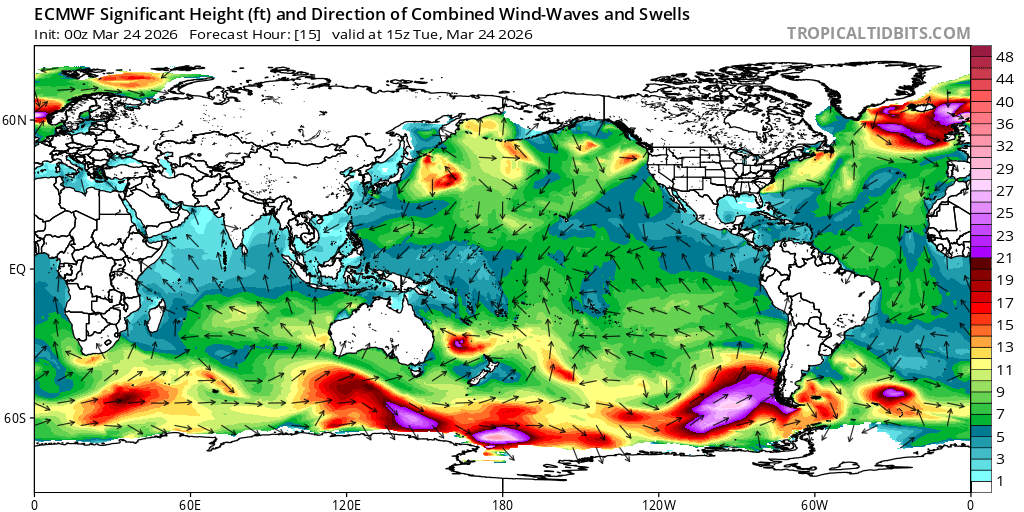
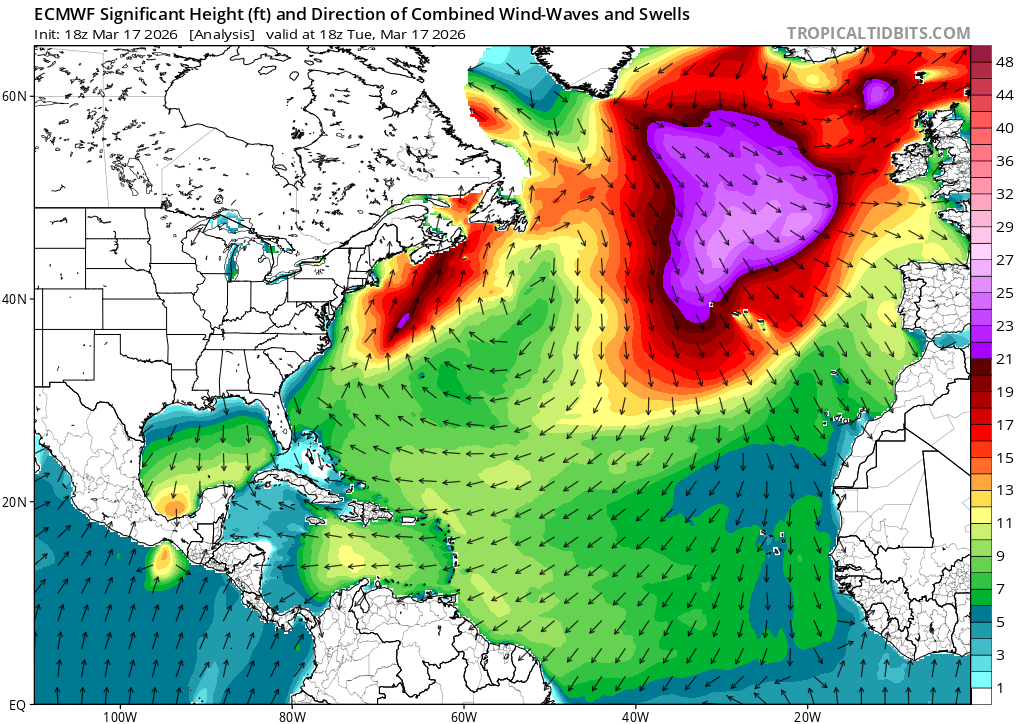
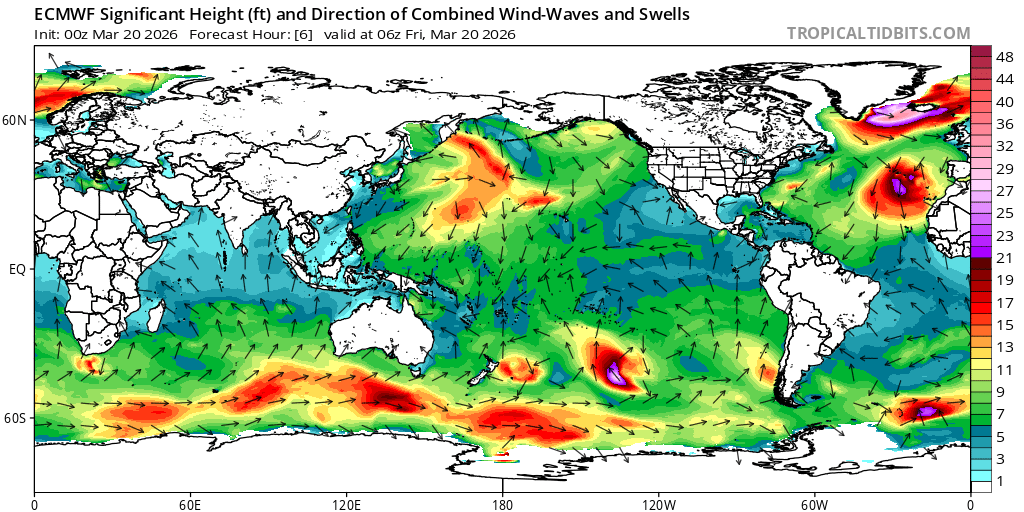
Looking further out (more speculatively to try to see whether the CMEMS trend upwards for the rest of the month is matched by ECMWF) I looked again at the only very rough proxy for sea ice extent I have since the sea ice concentration field isn't free/publicly available (which is the 30% sea ice concentration mask for the significant wave height in the significant wave height products)... Based on this it does show more advancement in 10 days (and moreso more than yesterday's run) (there is quite a bit of loss in the Barents Sea near the coast of Russia but that seems to have more than made it up elsewhere).
A little loss yesterday (-0.02). The most notable area I could spot visually was on the SE coast of Greenland after the thick first year ice has broken up and melted some (over the last couple days) -- I looked at that area (below) because the more modest ice drift vector from wind/waves alone over the last two days didn't seem to explain all the loss.
~
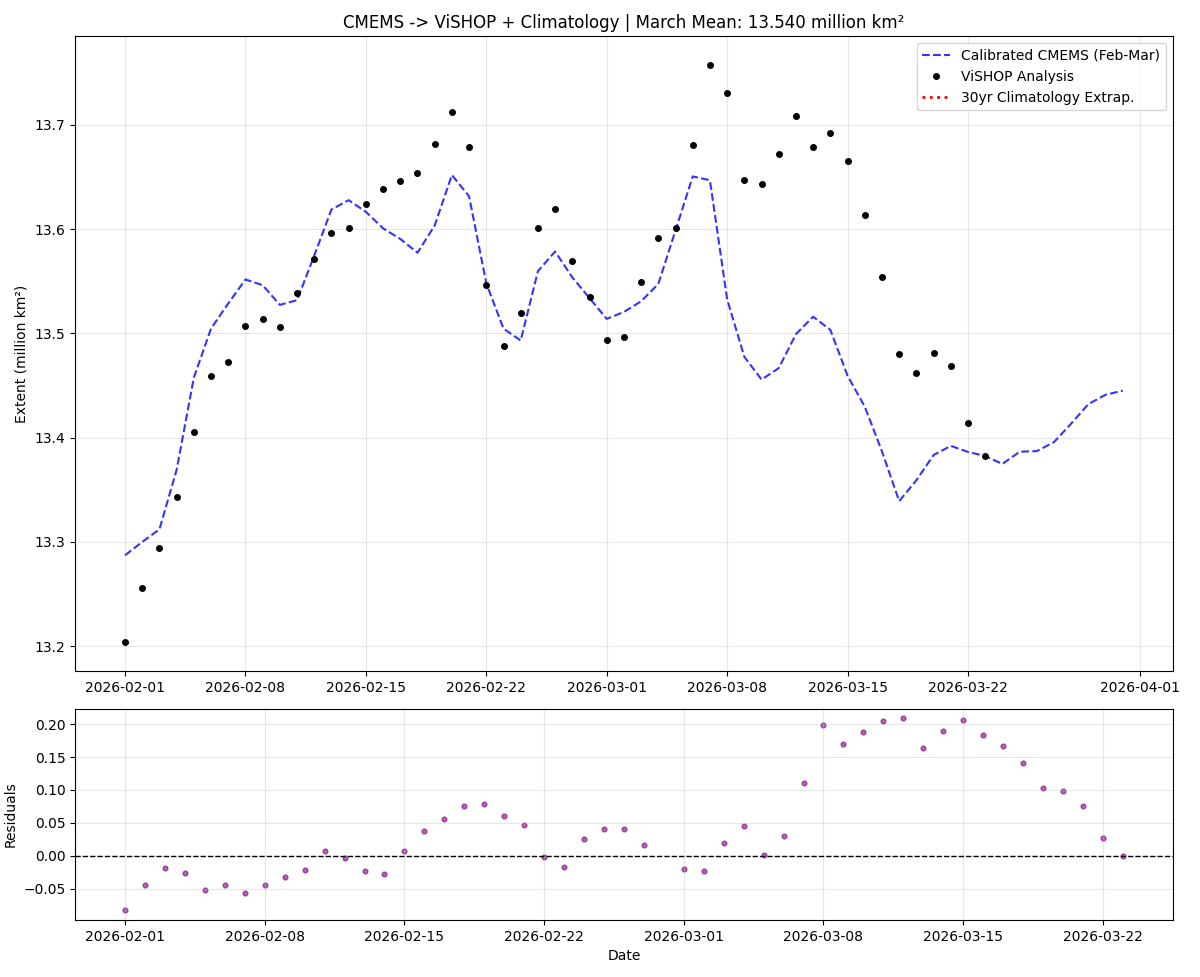
Latest CMEMS shows it mostly flat with some tiny gains over the last 4 days of March. Still suggests ~ 13.556 (adjusting the remainder of the forecast upwards by +0.07, the last residual. March 2025 was 13.544, so it looks like at the moment if it validates we will just barely miss setting a record minimum for the Arctic winter, but its still close enough that this may change since the predictions are well in the margin of error for the residuals. (Second place was 2017 at 13.679)

~

Night SSTs from AOML's Oceanwatch viewer (scaled -2 to 0 C), Mar 19-21:
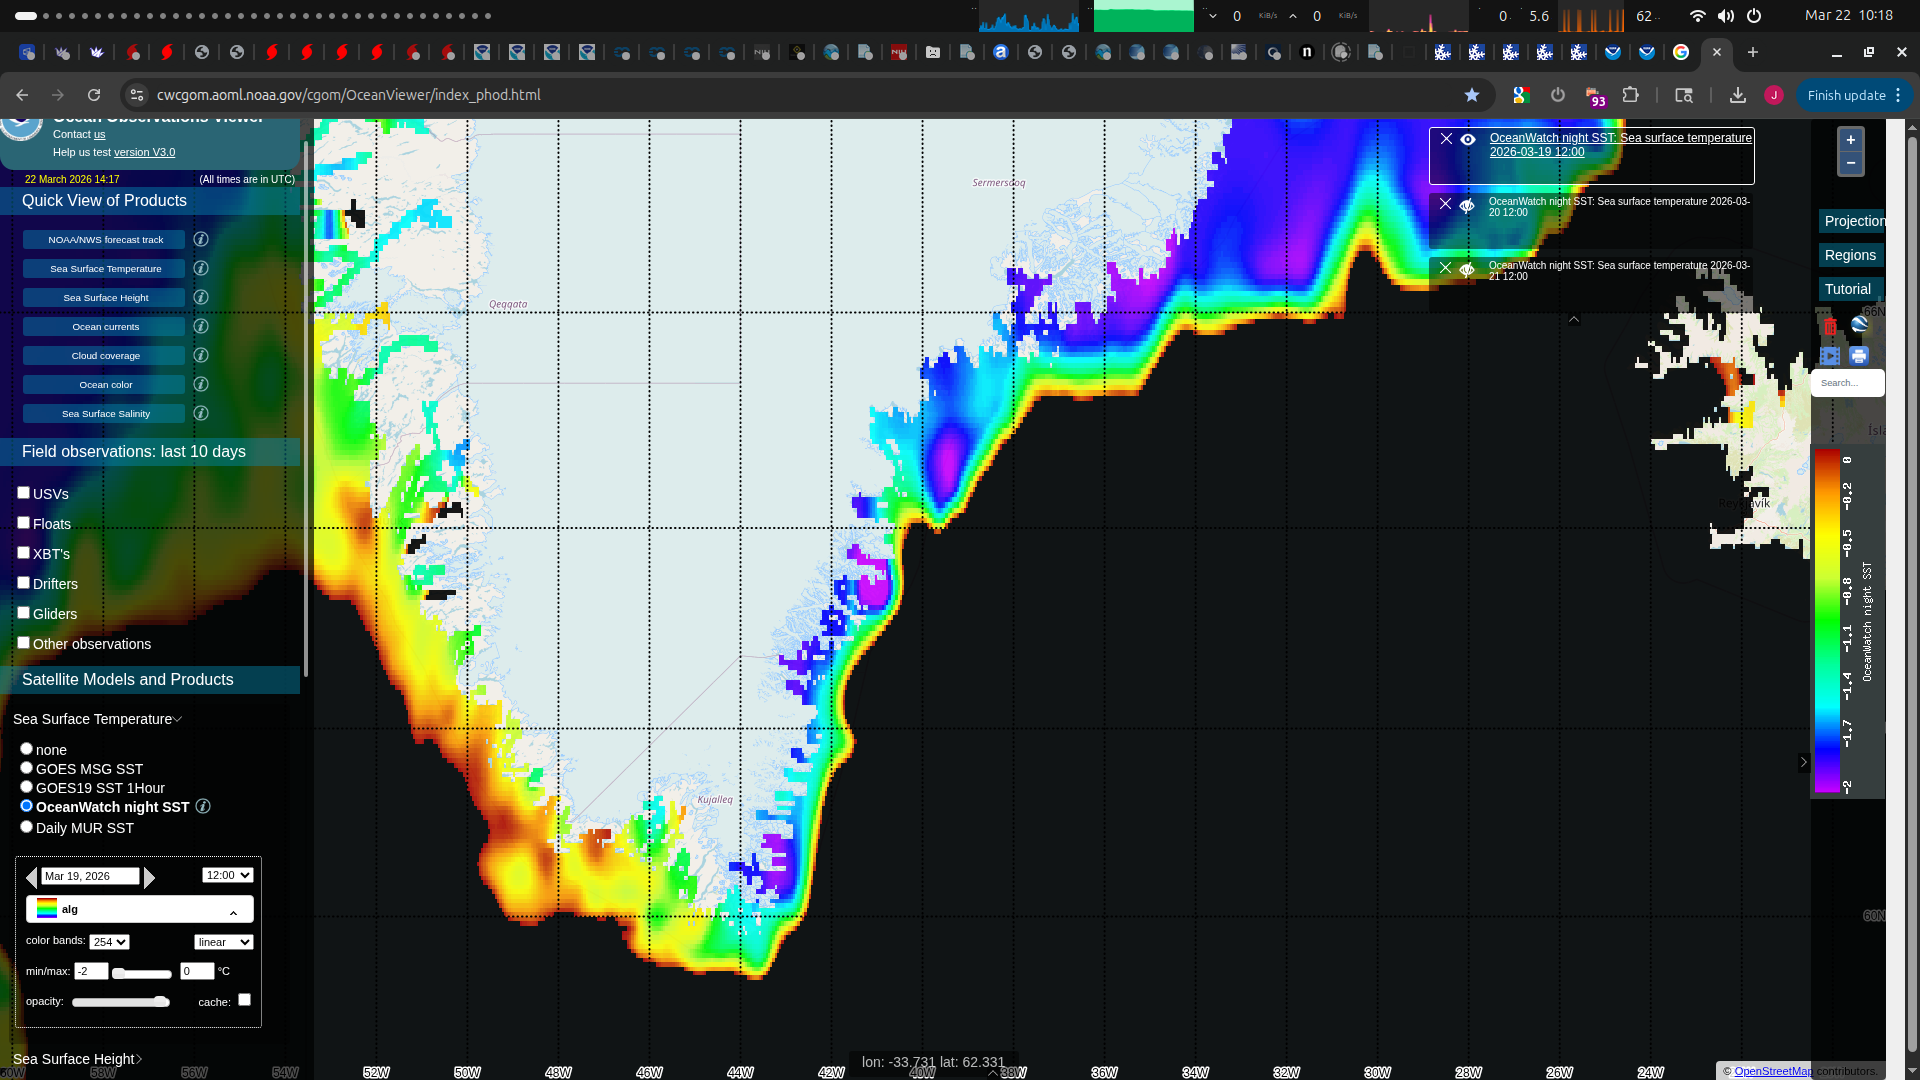
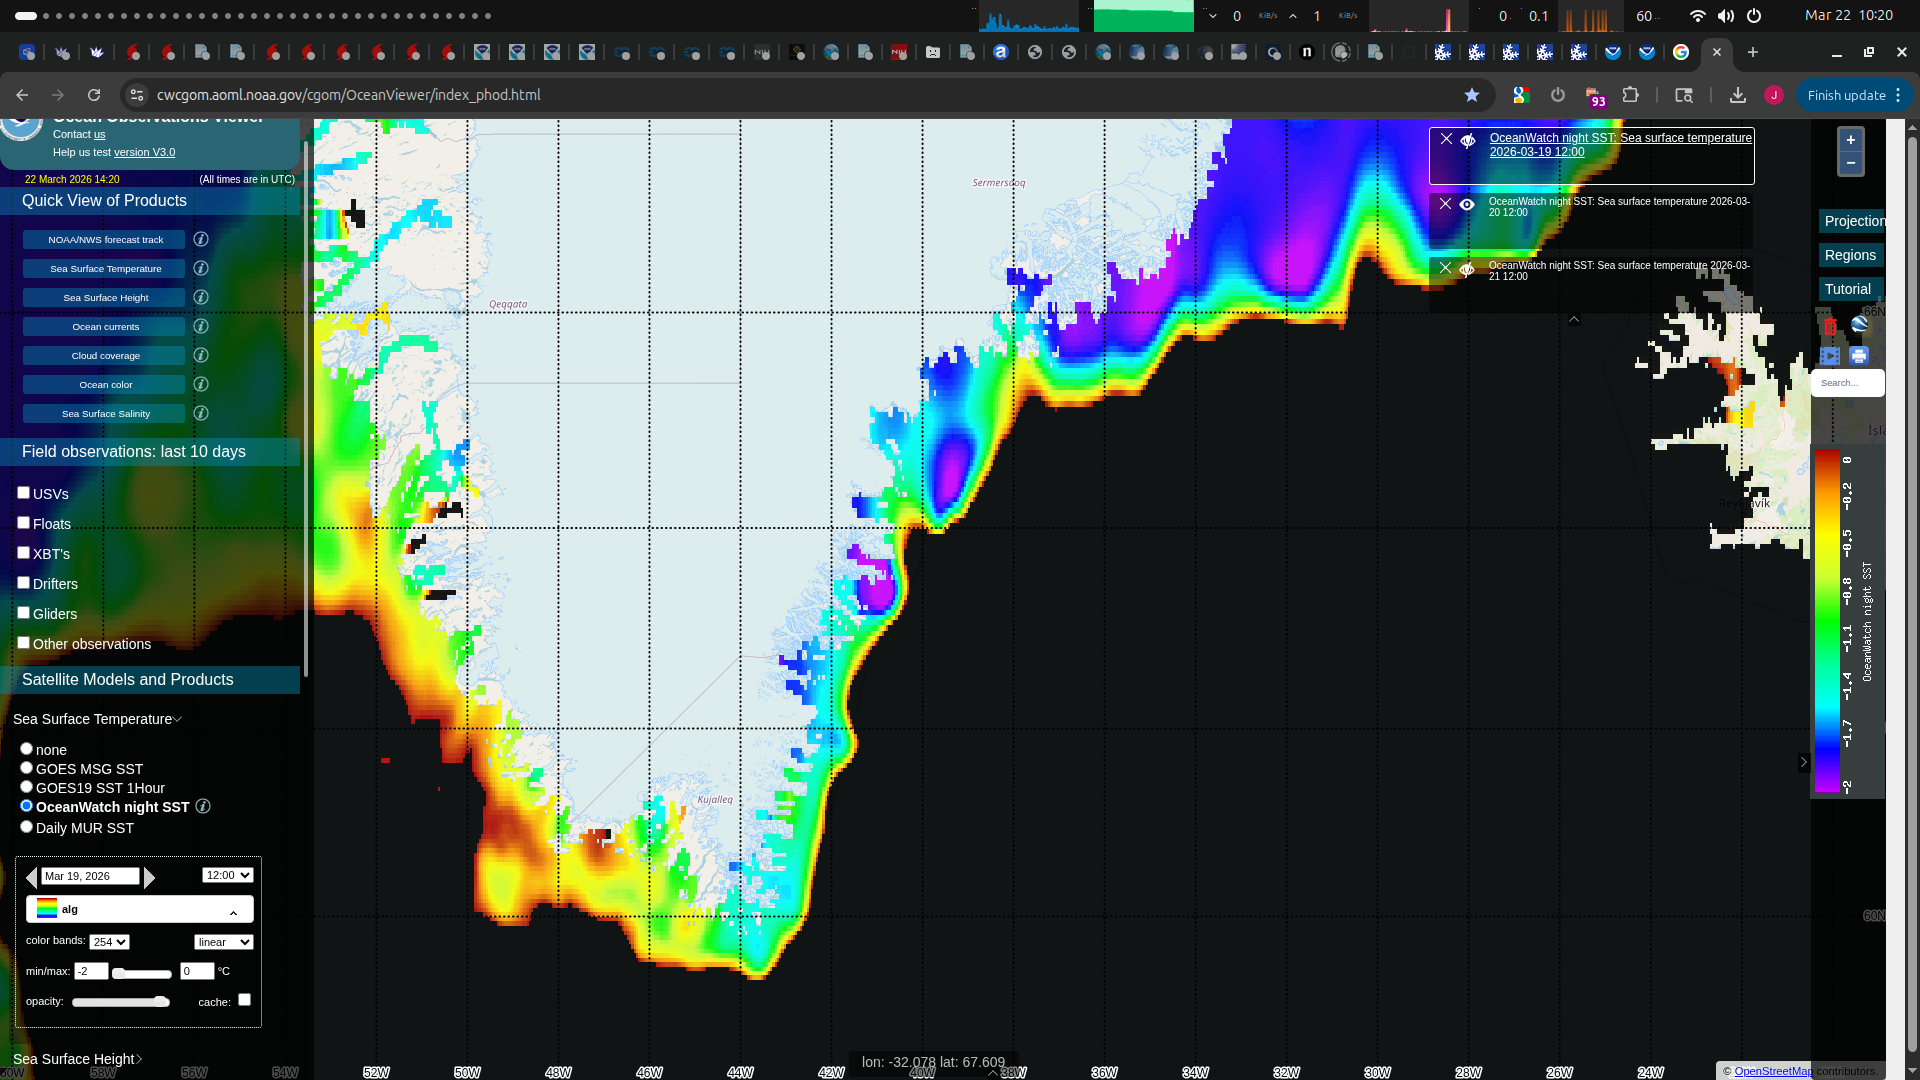
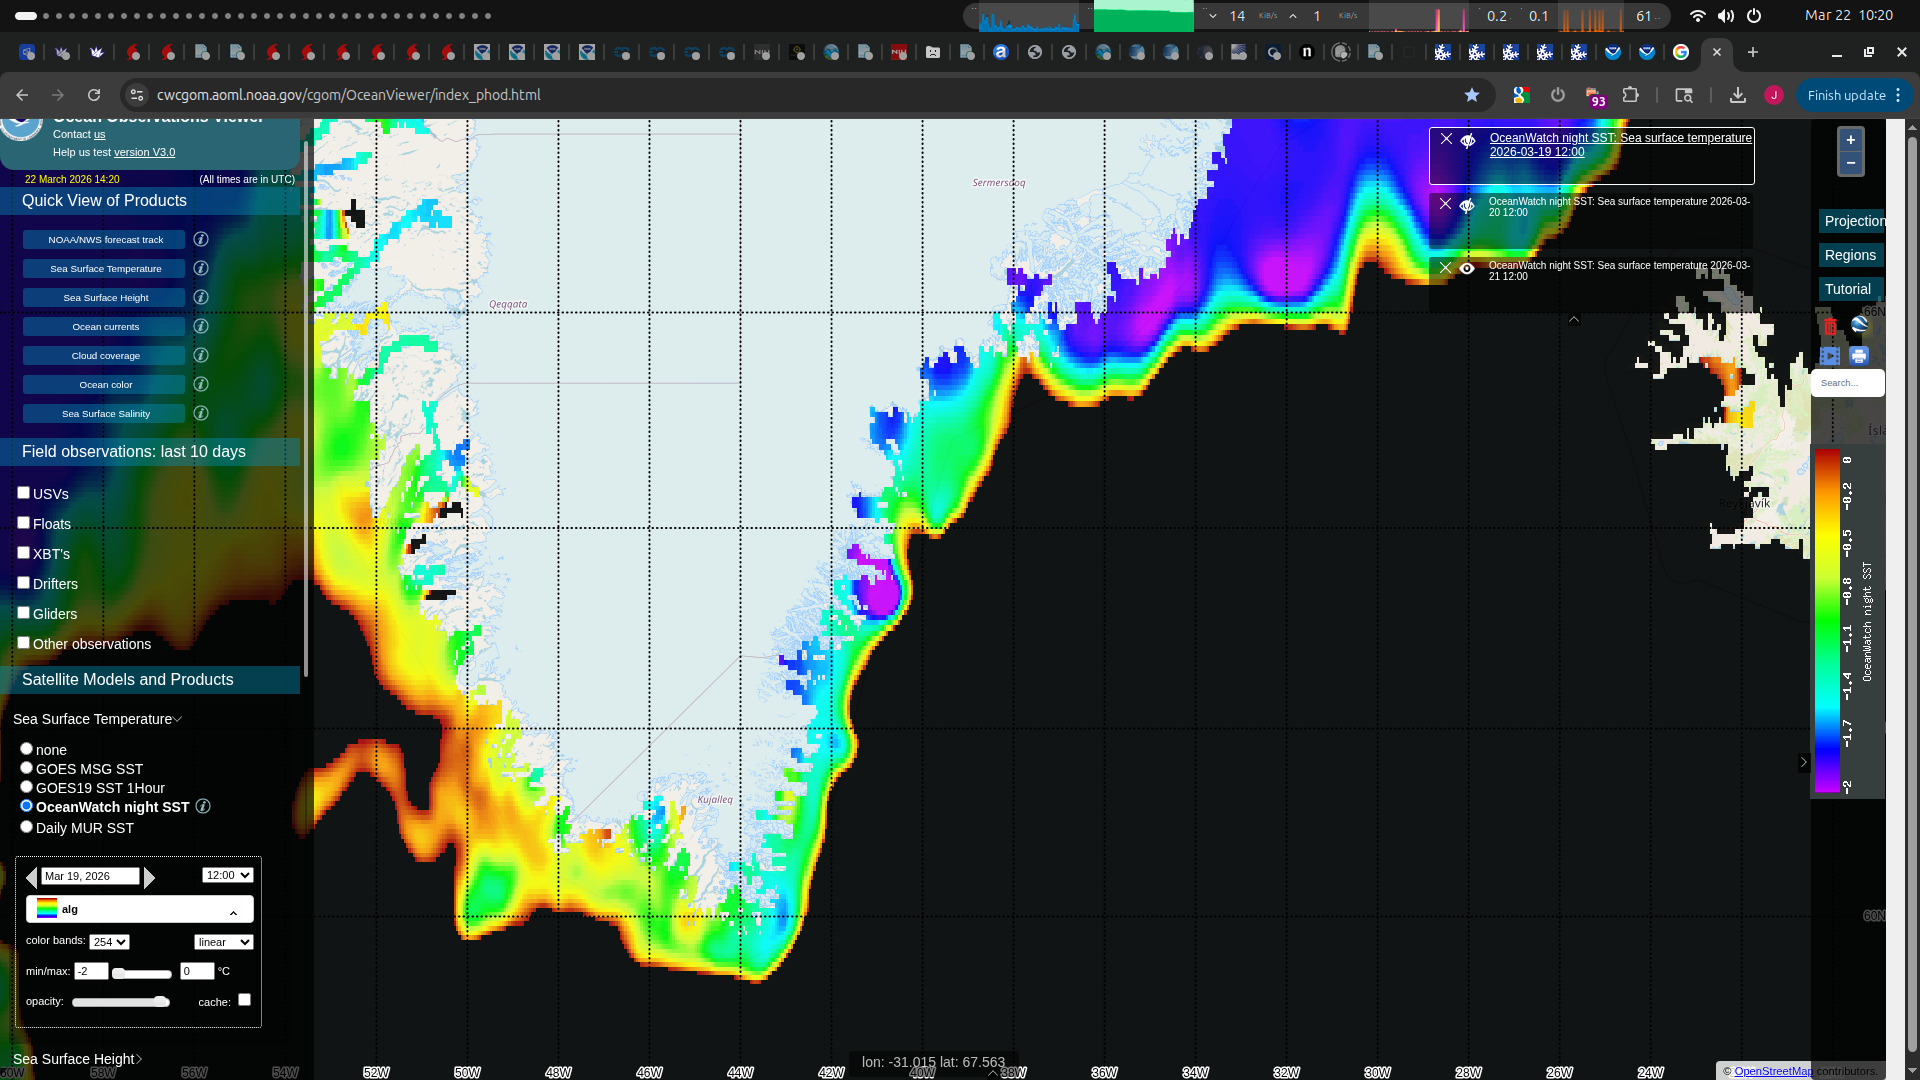
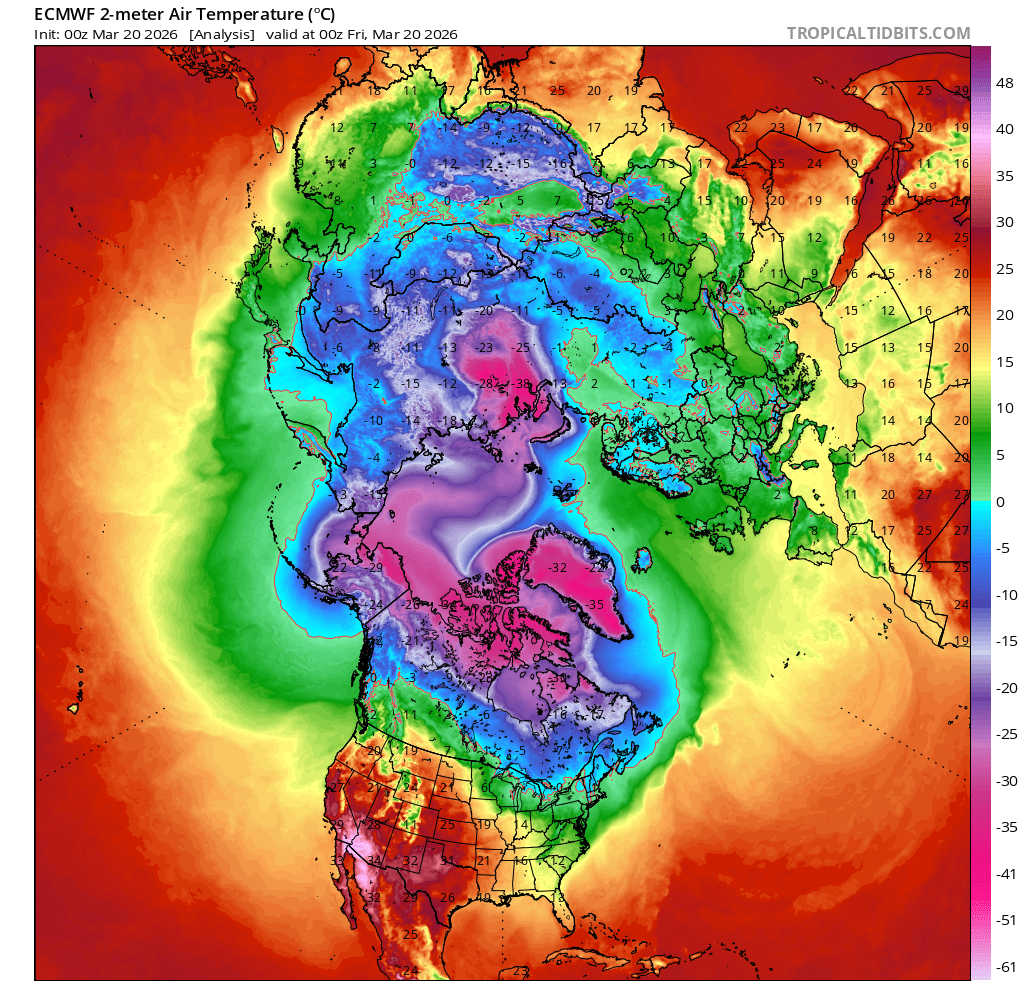
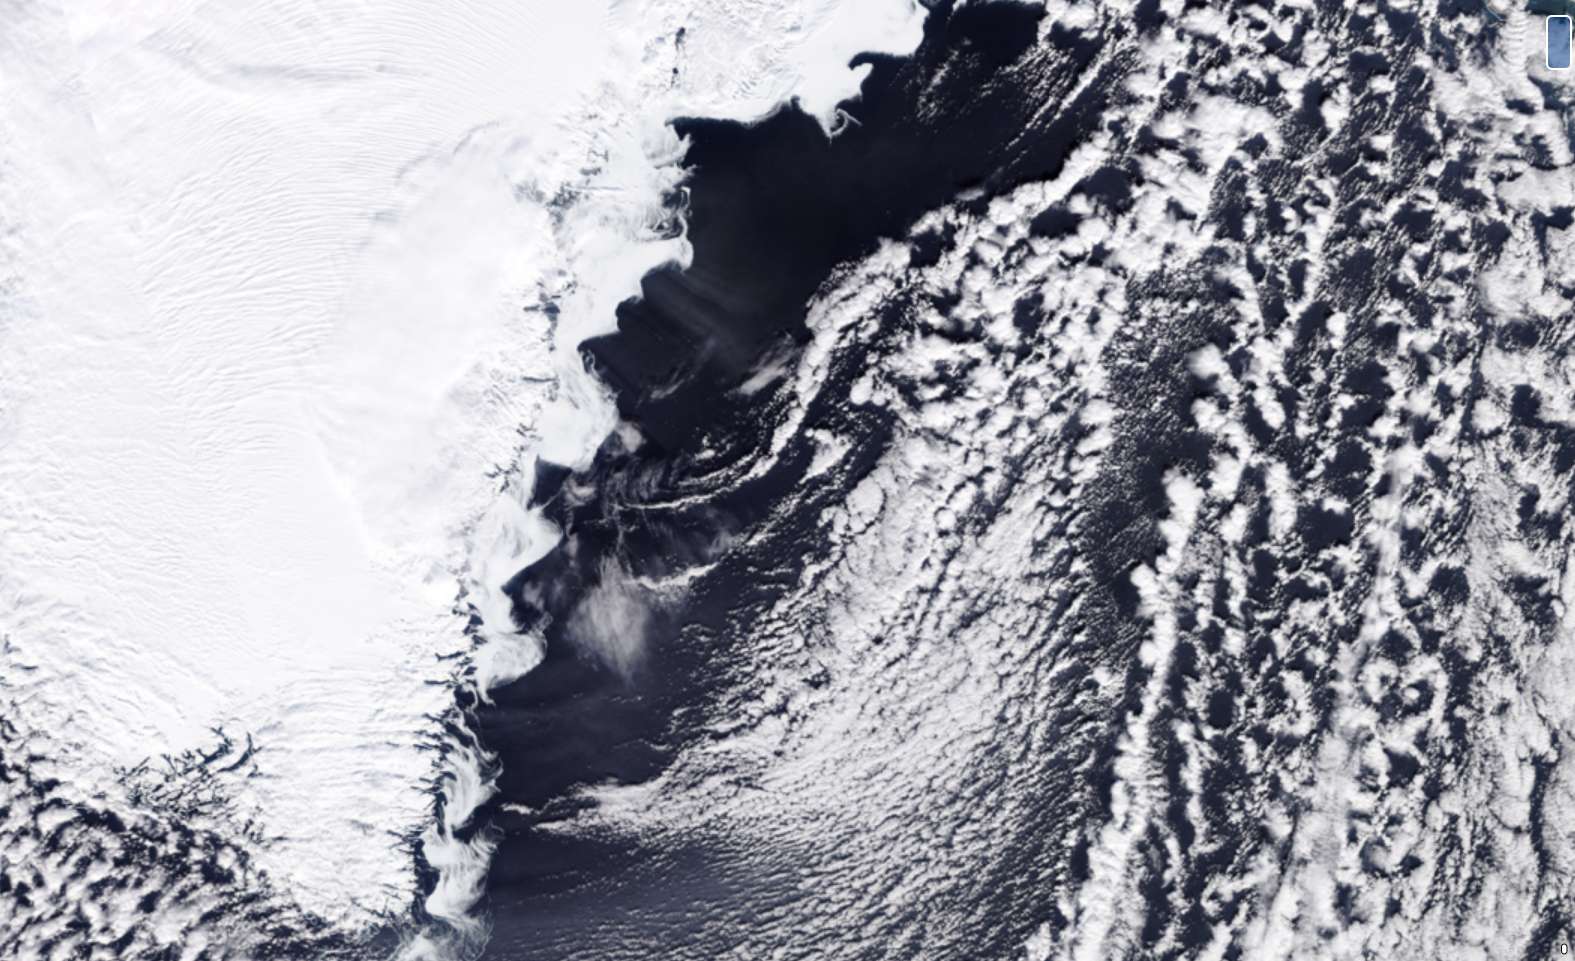
From the sea ice concentration images alone its harder to see exactly what caused the loss yesterday for sure, but it looks like a combination of breakup and some melt from SSTs slightly above the -1.9 C threshold. ECM shows below freezing air temps for 20-21st (but above that prior)), but SST temps (OceanWatch) show it meeting the threshold for melting. The above SSTs, wind/waves (above) and the progression (Mar 19-21) from VIIRS imagery below (pulled from NOAA-21, from the NESDIS JSTAR mapper) seems more consistent with a combination of breakup and melt:
Yesterday, some of Sea of Okhotsk is clipped in the descending pass but I'm not sure how much that contributed to the loss as the missing portion was in the ascending pass (I don't know how they combine the two passes).
The polynya near Franz Josef Island continued to enlarge.

CMEMS continues to show a trend of slight decline for today and tomorrow but afterwards an increasing trend... we'll see if that validates.
Closer now to falling below 2025's record given yesterday's drop, which was about -0.06.
The next ECMWF upgrade (June-ish?) will have better sea ice modeling and the significant wave height data will no longer mask on sea ice concentration >= 30%. So as it's the last meaningful chance to use this (proxy) data, I wanted to see how it looked compared to CMEMS:
Here is from today's CMEMS daily which shows generally a rise after a dip today, and here is from EPS deriving a poor man's proxy of (unknown/speculative value?) for sea ice extent by using that sea ice concentration 30% mask (which is normally 15% for SIE), by combining it with the land sea mask (<0.5) to infer the sea ice portion that is masked (where I reference the 18Z points to save on data from the ensemble). (Because of the masking and lower res it isn't as good quality a chart). Note the absolute value will be significantly different since it's not calibrated to ViSHOP (different masking) and uses some simple area calculation approximations.
I was suprised at how much spread there is actually in the data. I suppose the initial ensemble on init has a comparable amount (though there are alot of waves today that will affect the sea ice). Thankfully though, they both line up in terms of relative trends, even if not in scale (the CMEMS has shown multiple times a dip on the last day but a general trend up).
.Still neck in neck with March 2025 ....

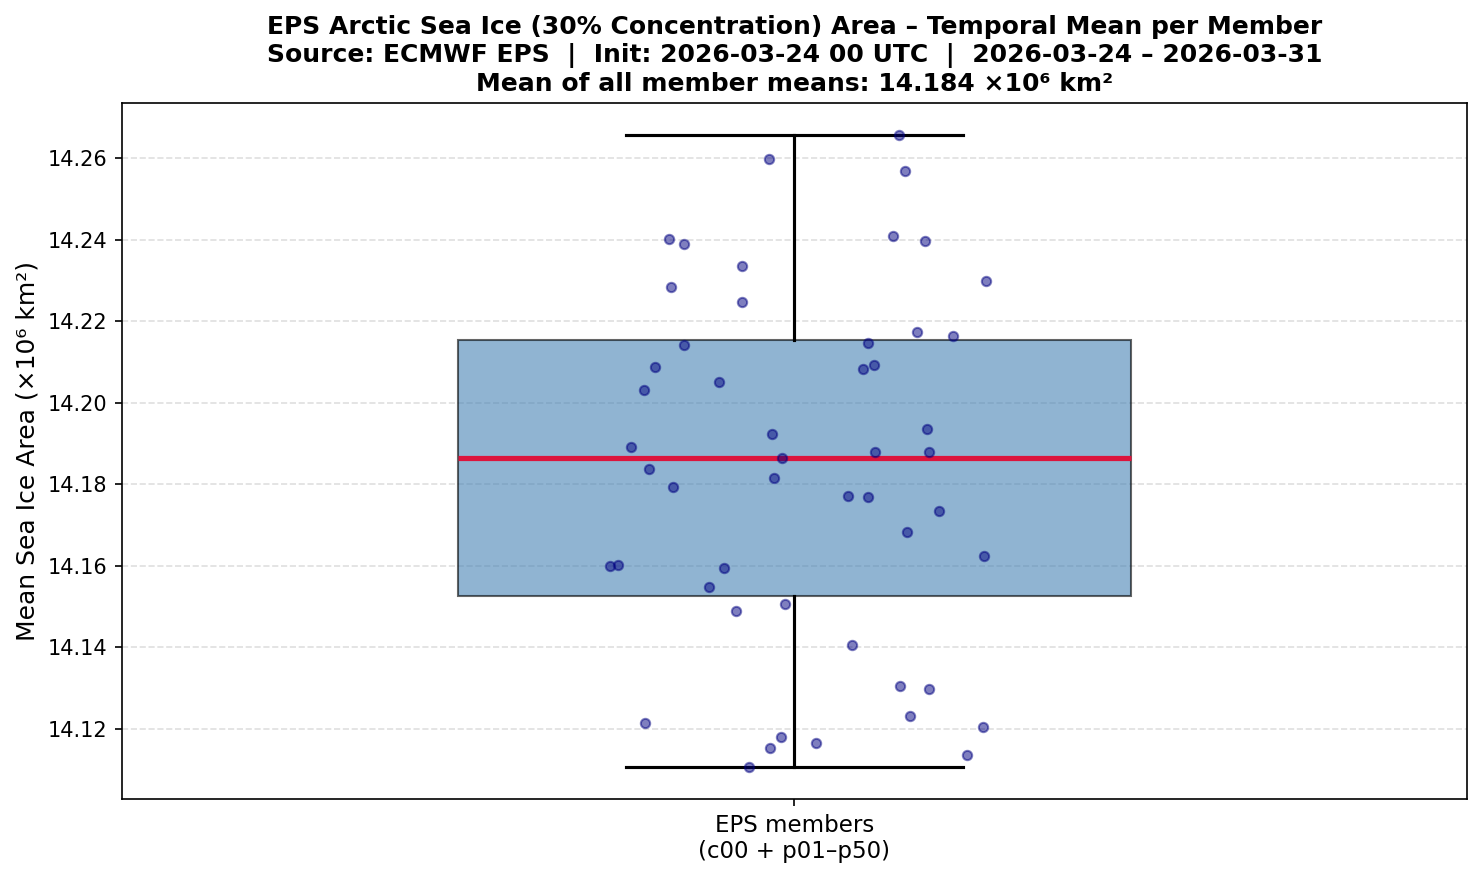
EPS (diagnostic for 18Z from control member) from Mar 24, 00Z init (quite a few differences! Sea of Okhotsk being one of them)

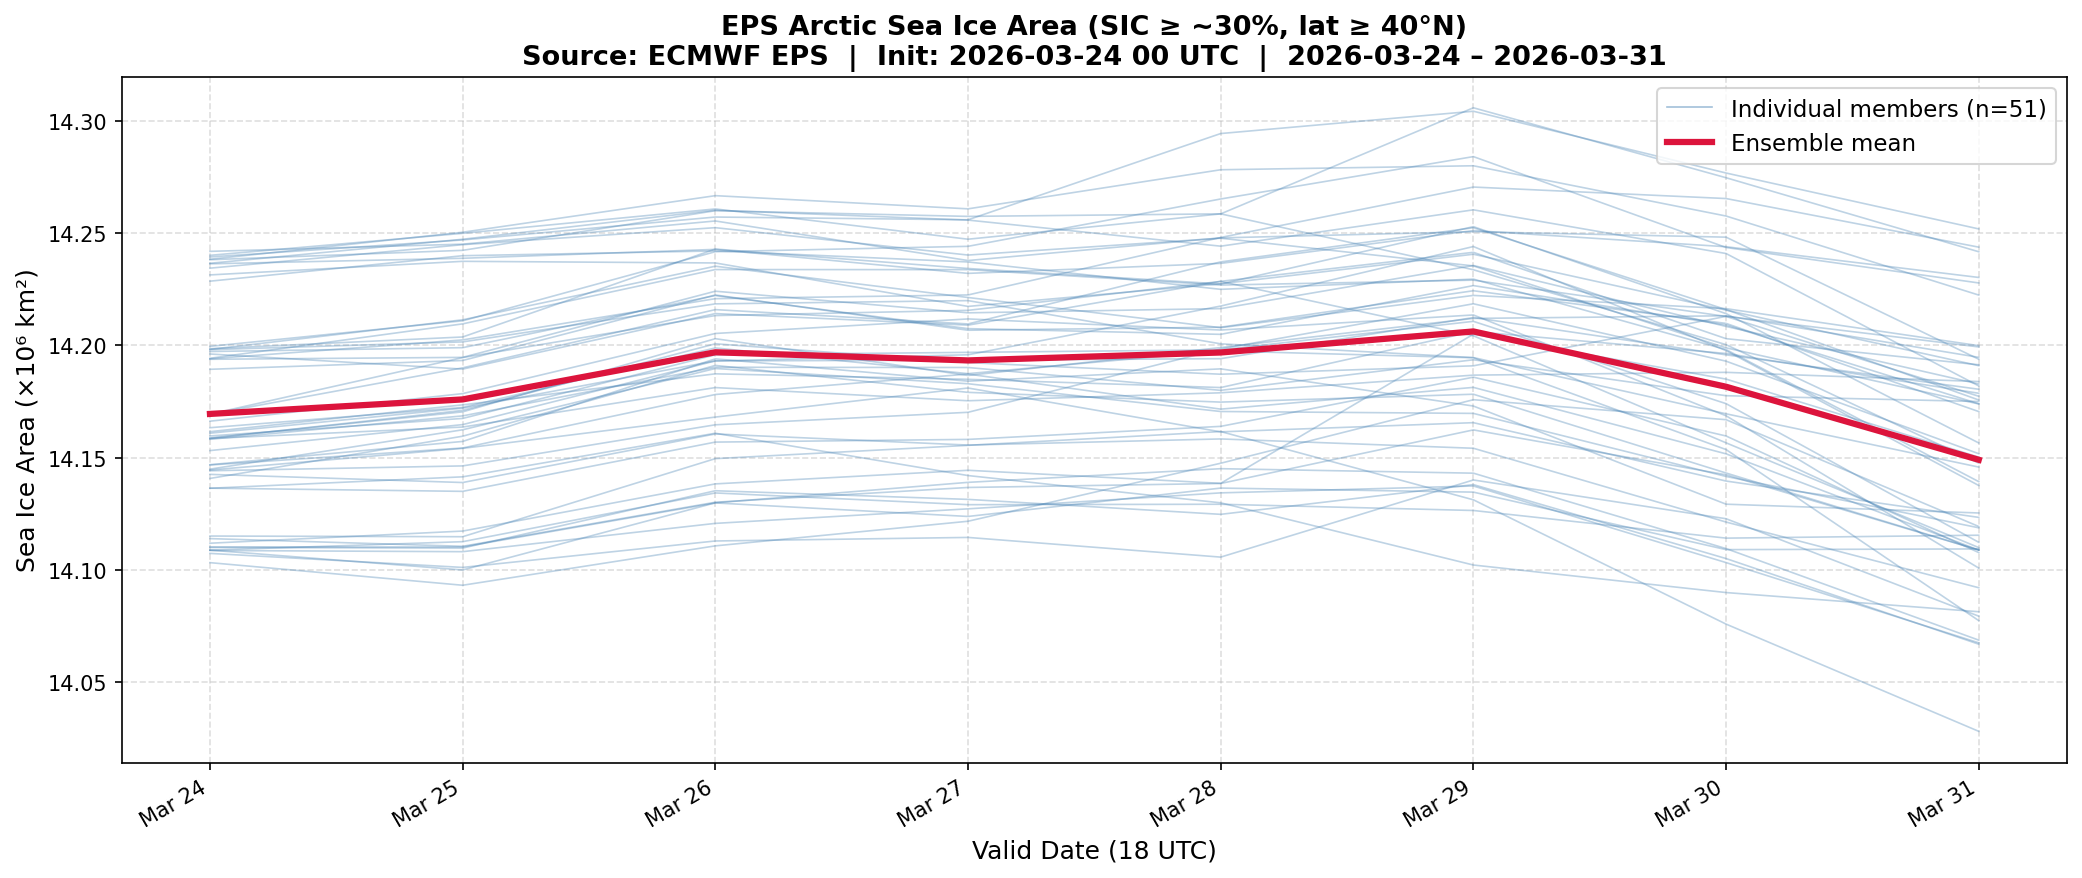
Plot of 24-31 by member (mean is 14.184, note that the 24th mean is 14.169, so this implies a positive trend on average):