Data is currently (subject to shutdown delay) at
https://data.giss.nasa.gov/gistemp/tabledata_v4/GLB.Ts+dSST.csv
or
https://data.giss.nasa.gov/gistemp/tabledata_v4/GLB.Ts+dSST.txt
(or such updated location for this Gistemp v4 LOTI data)
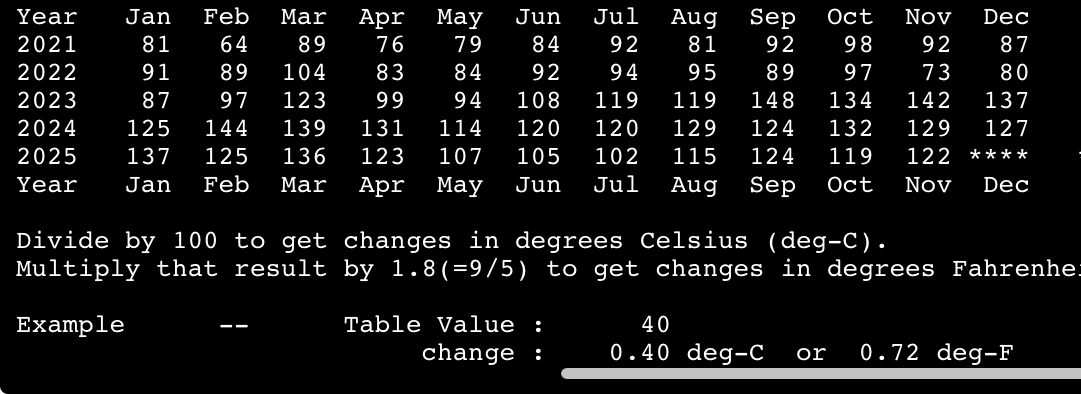
January 2024 might show as 124 in hundredths of a degree C, this is +1.24C above the 1951-1980 base period. If it shows as 1.22 then it is in degrees i.e. 1.22C. Same logic/interpretation as this will be applied.
If the version or base period changes then I will consult with traders over what is best way for any such change to have least effect on betting positions or consider N/A if it is unclear what the sensible least effect resolution should be.
Numbers expected to be displayed to hundredth of a degree. The extra digit used here is to ensure understanding that +1.20C resolves to an exceed 1.195C option.
Resolves per first update seen by me or posted as long, as there is no reason to think data shown is significantly in error. If there is reason to think there may be an error then resolution will be delayed at least 24 hours. Minor later update should not cause a need to re-resolve.
December 2025 market at
 1,000
1,000🏅 Top traders
| # | Trader | Total profit |
|---|---|---|
| 1 | Ṁ859 | |
| 2 | Ṁ175 | |
| 3 | Ṁ141 | |
| 4 | Ṁ101 | |
| 5 | Ṁ97 |
People are also trading
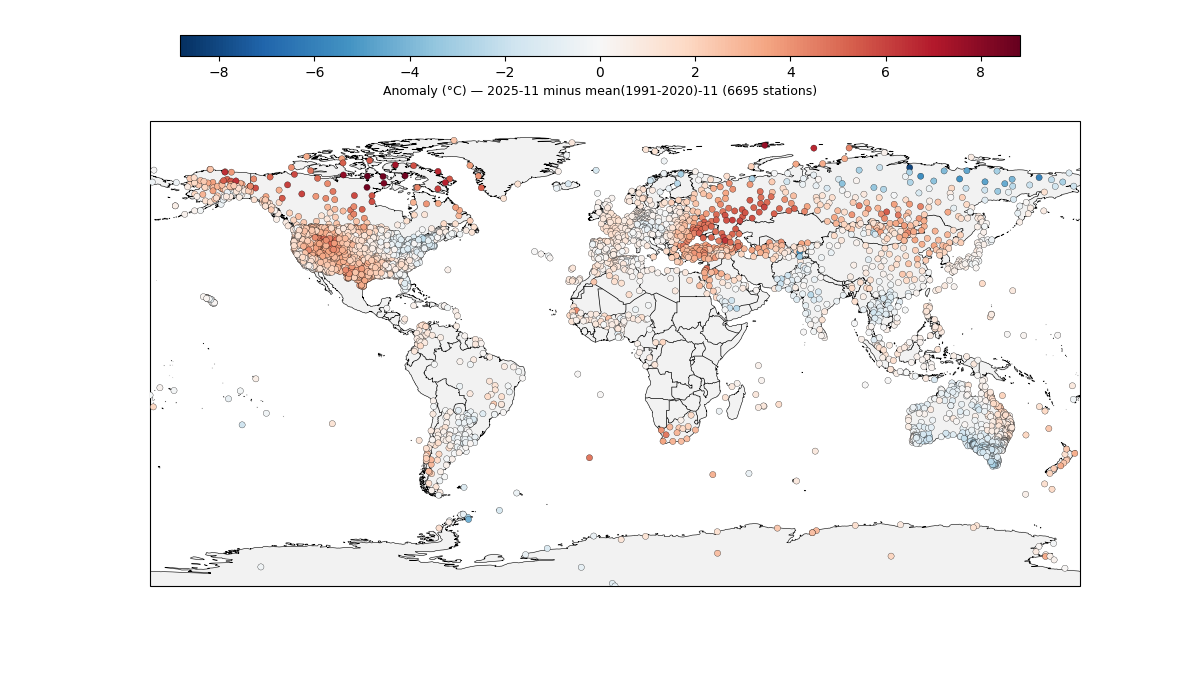
@ChristopherRandles It’s out officially, 1.22.
Based on their pub directory they used (as expected) the ghcnm from Sunday night, (ghcnm.tavg.v4.0.1.20251207).
1.224, 0.001 off my prediction atm 🗡 should drop once Spain and Nordic countries come in
@Rhhgdd estimate dropped to exactly 1.210 , let's see how close we get. We need to make a market to 3d.p. I'm too good 🤪
@Rhhgdd same pretty much with most recent model runs been slightly warm, and pretty close to last month overall.
I didn’t post but there was about a 1000 new stations added in the ghcnm compared to a few days ago (almost all from the Nordic countries), which pushed Oct ( barely ) back up into the 1.195- bin again.
No ERA5 last night (only prelim for last day), so don't have a final prediction from ERA5 utill tomorrow.
ERSSTv5 data came out but its still too early to update given the lack of ghcnm data this early on (much more missing than not). Regardless, the land data shows it quite a bit warmer than I'd expected (this being a very biased warm sample from mostly the NH, we should probably expect some fluctuations down and up from here), but I am guessing generally upwards from here given the whole of the SH landboxes are missing and that should bring it up a bit while several missing subboxes in Middle East and Southern Asia should bring NH anomaly down a tiny bit less ...
Regardless of the fact that the initial gistemp values are nearly useless at this point for anything beyond such above speculative predictions, I'll post the initial values again for completeness in reference for practice of trying to (subjectively) predict where it will go in subsequent runs (there was a considerable warm anomaly over NE Canada) so it could go up when that comes in but until then given that with the exception of NE Canada and Kazakhstan most of the most anamolous warm stations seems to have already come in)...
Based on the "new" stations that came in subsequently for Oct 4 (last month) and based on ERA5 I am guessing most of the countries that should come out with the next ghcnm (i.e. v4.0.1.20251203)), i..e Japan, Mongolia, Pakistan, Vietnam, Portugal, Uruguay in particular, should bring the gistemp down with tomorrow (New Zealand and perhaps a station in Antarctica being the exceptions that could bring it up a bit to counter that), so overall I'm expecting subjectively based on this tomorrow for it to go down (hard to predict how large NZ will shift the SH temps upwards and I haven't been skillfull at these subjective predictions so far)...
ghcnm.v4.0.1.20251202:
118.36
@Rhhgdd I looked at polymarket and noticed zenarxy has been subtly trolling you I assume ( in reference to https://manifold.markets/ChristopherRandles/global-average-temperature-nov-2025#5oprrvaay7)
https://polymarket.com/event/november-2025-temperature-increase-c?tid=1764688341515
In defense of myself I was agreeing with the point prediction -- I've never posted a +- 0.01 confidence interval in these markets...
ghcnm.v4.0.1.20251203:
115.712
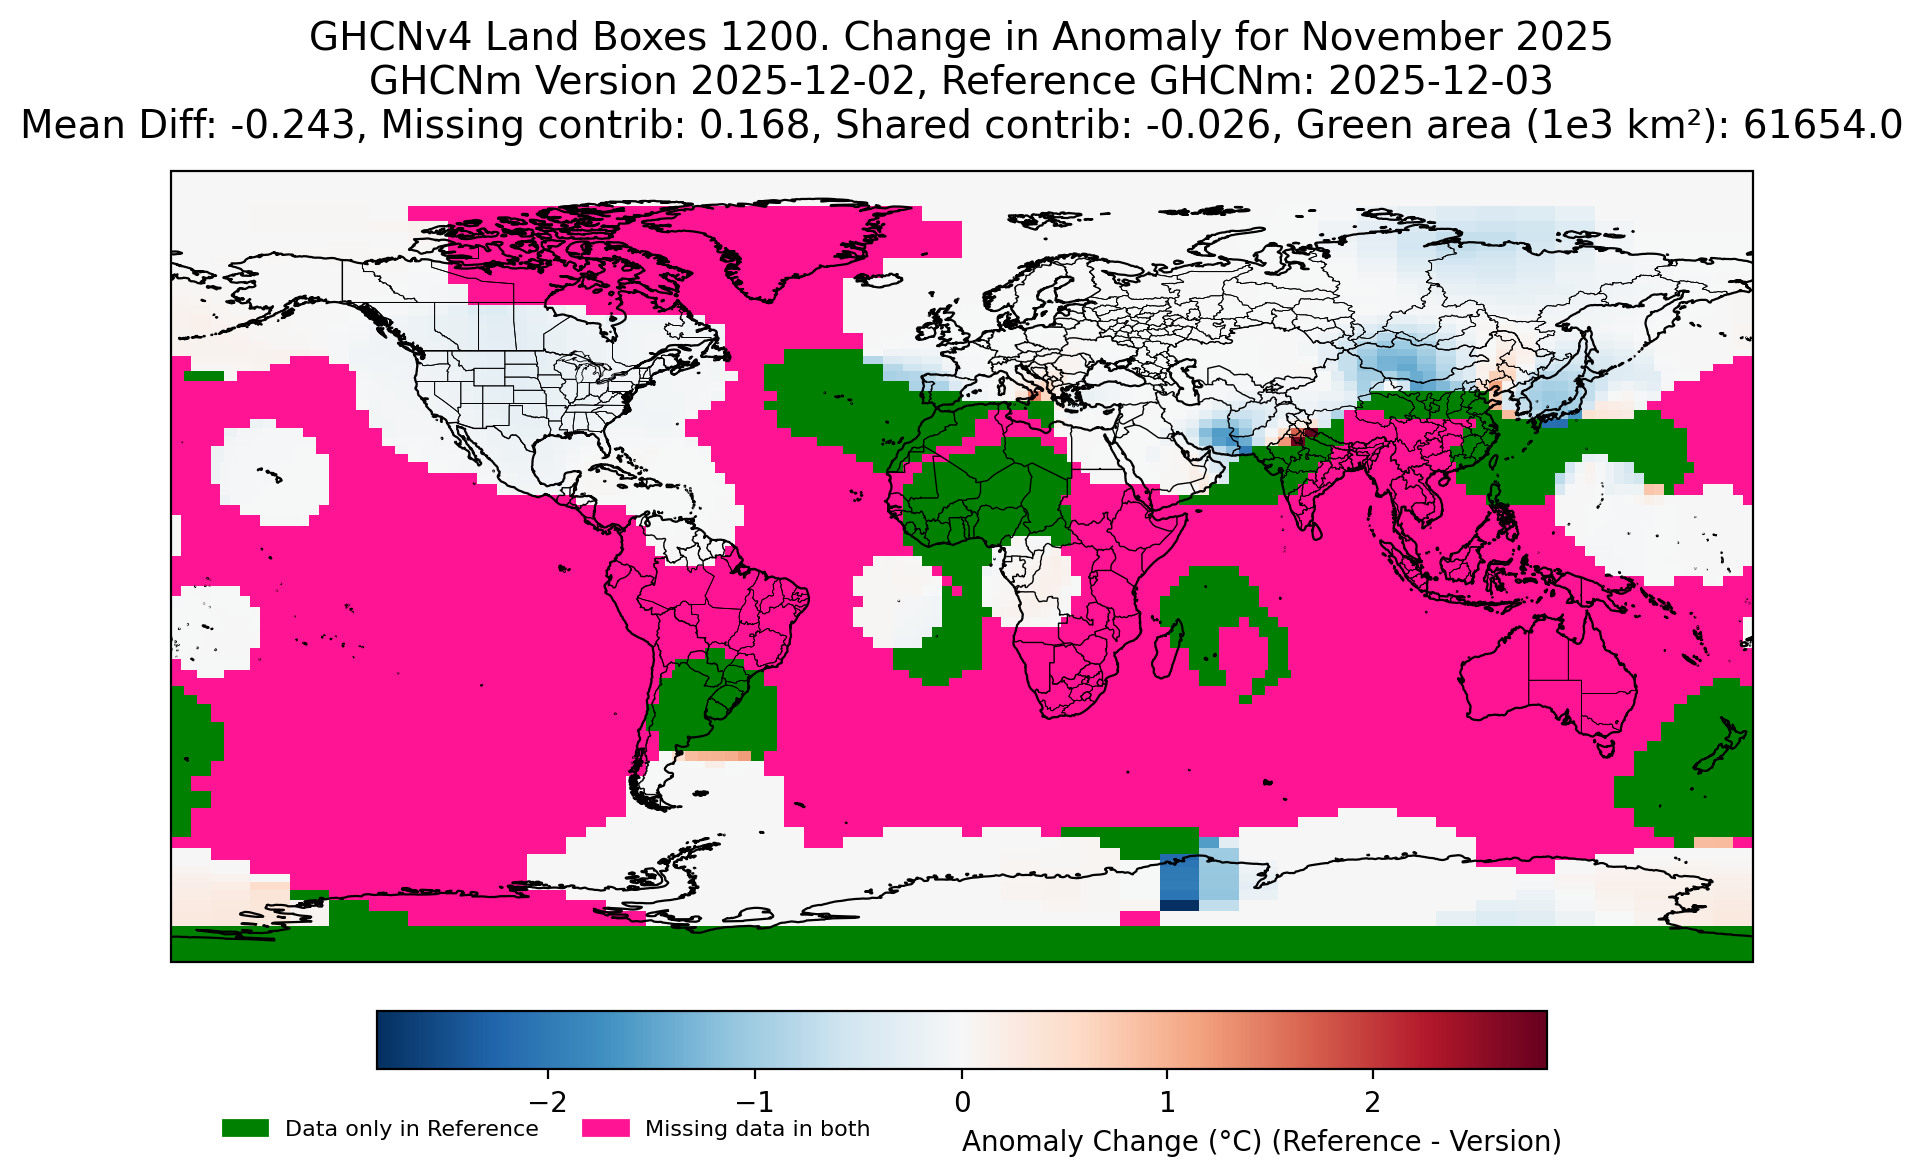
Comparing yesterday's landboxes with today, for at least the subboxes for the landboxes that already existed most of the contribution seems to have come from where I predicted, with the exception of a new Antarctica station coming in as well cooling its box a bit also.
I neglected to mention yesterday some of the islands that were likely to come in that were likely to be relatively cool compared to the nearby ocean boxes, like the Azores and Micronesia -- they are important contributors but too many to keep track of in this ad-hoc subjective manner (in the south Atlantic the South Georgia and South Sandwich Islands didn't come in at the same day, for instance, like they did last month ). As far as more unexpected data coming in early, multiple countries from West Africa did come in as well (earlier than last month) which likely contributed to the cooling as well (conversely smaller minor unexpeced contributions that might have contributed to some warming were Bulgaria).
I expected 6 specific countries to bring temps down, and 5 of them came in but Vietnam did not (i.e. Japan, Mongolia, Pakistan, Vietnam, Portugal, Uruguay)
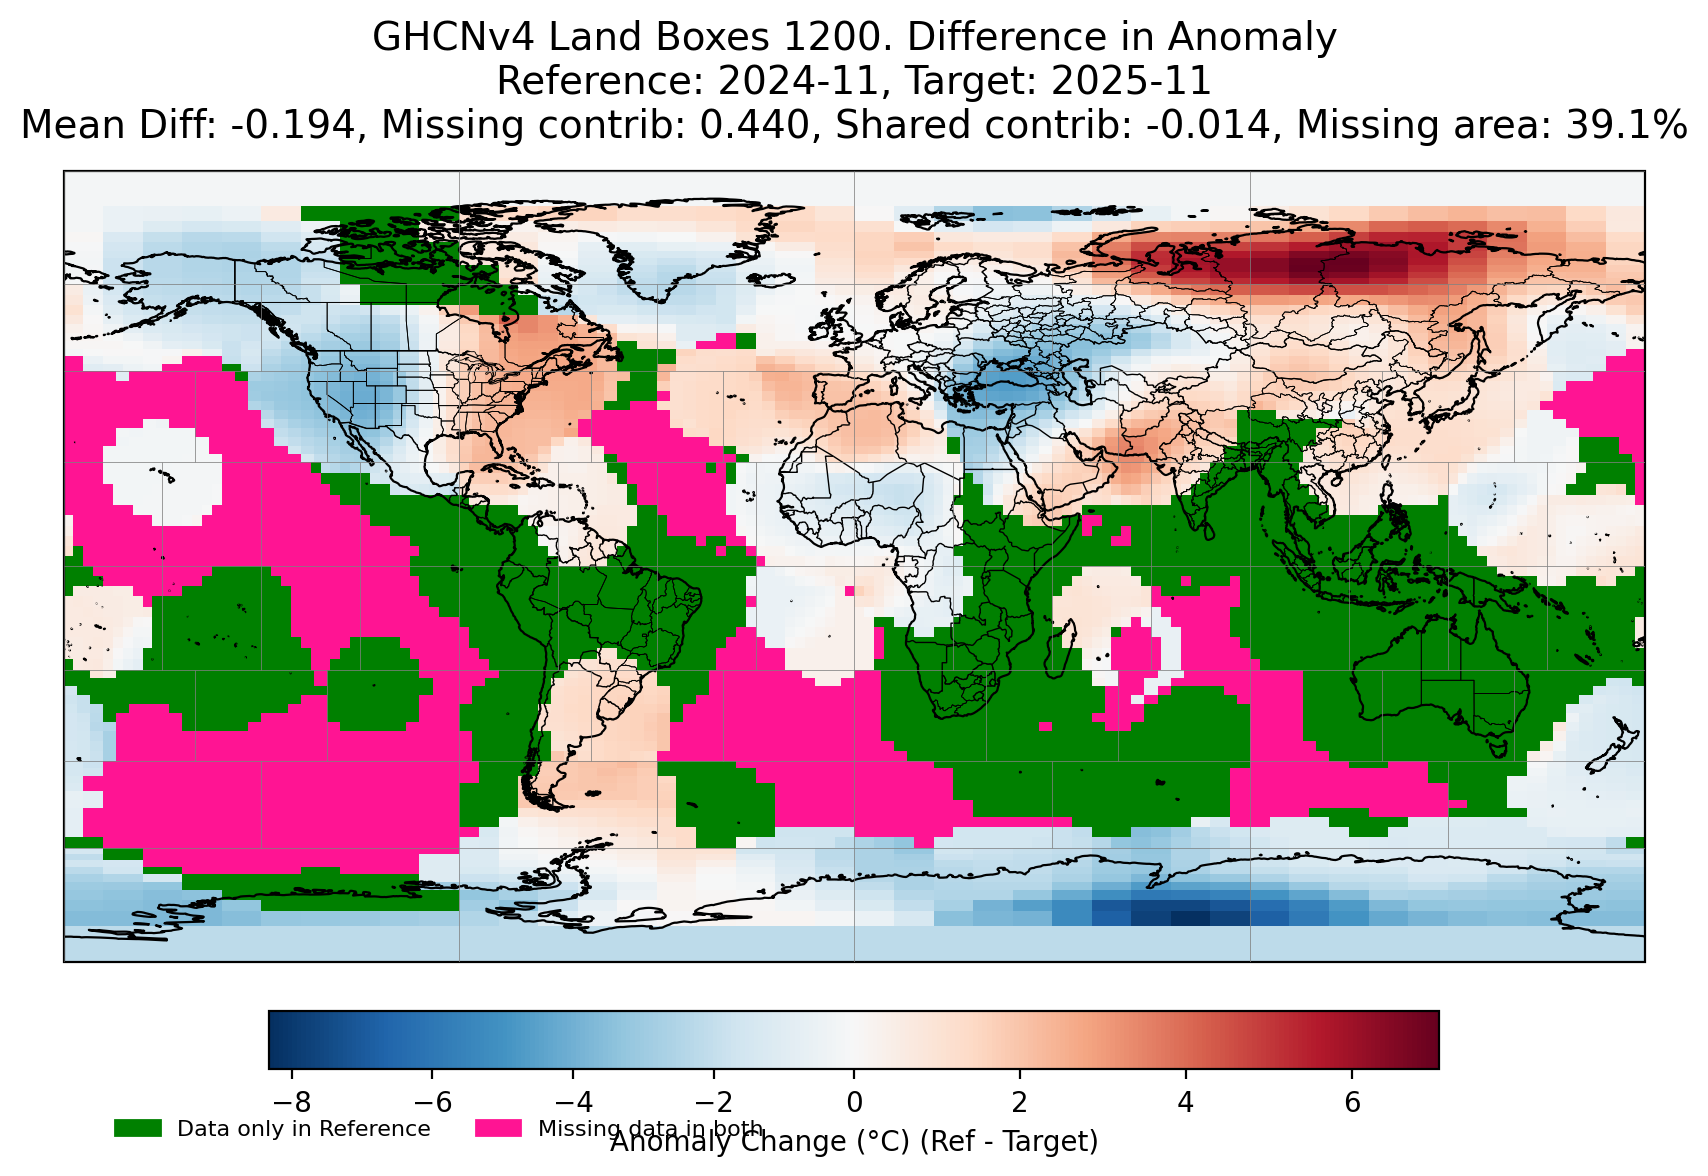
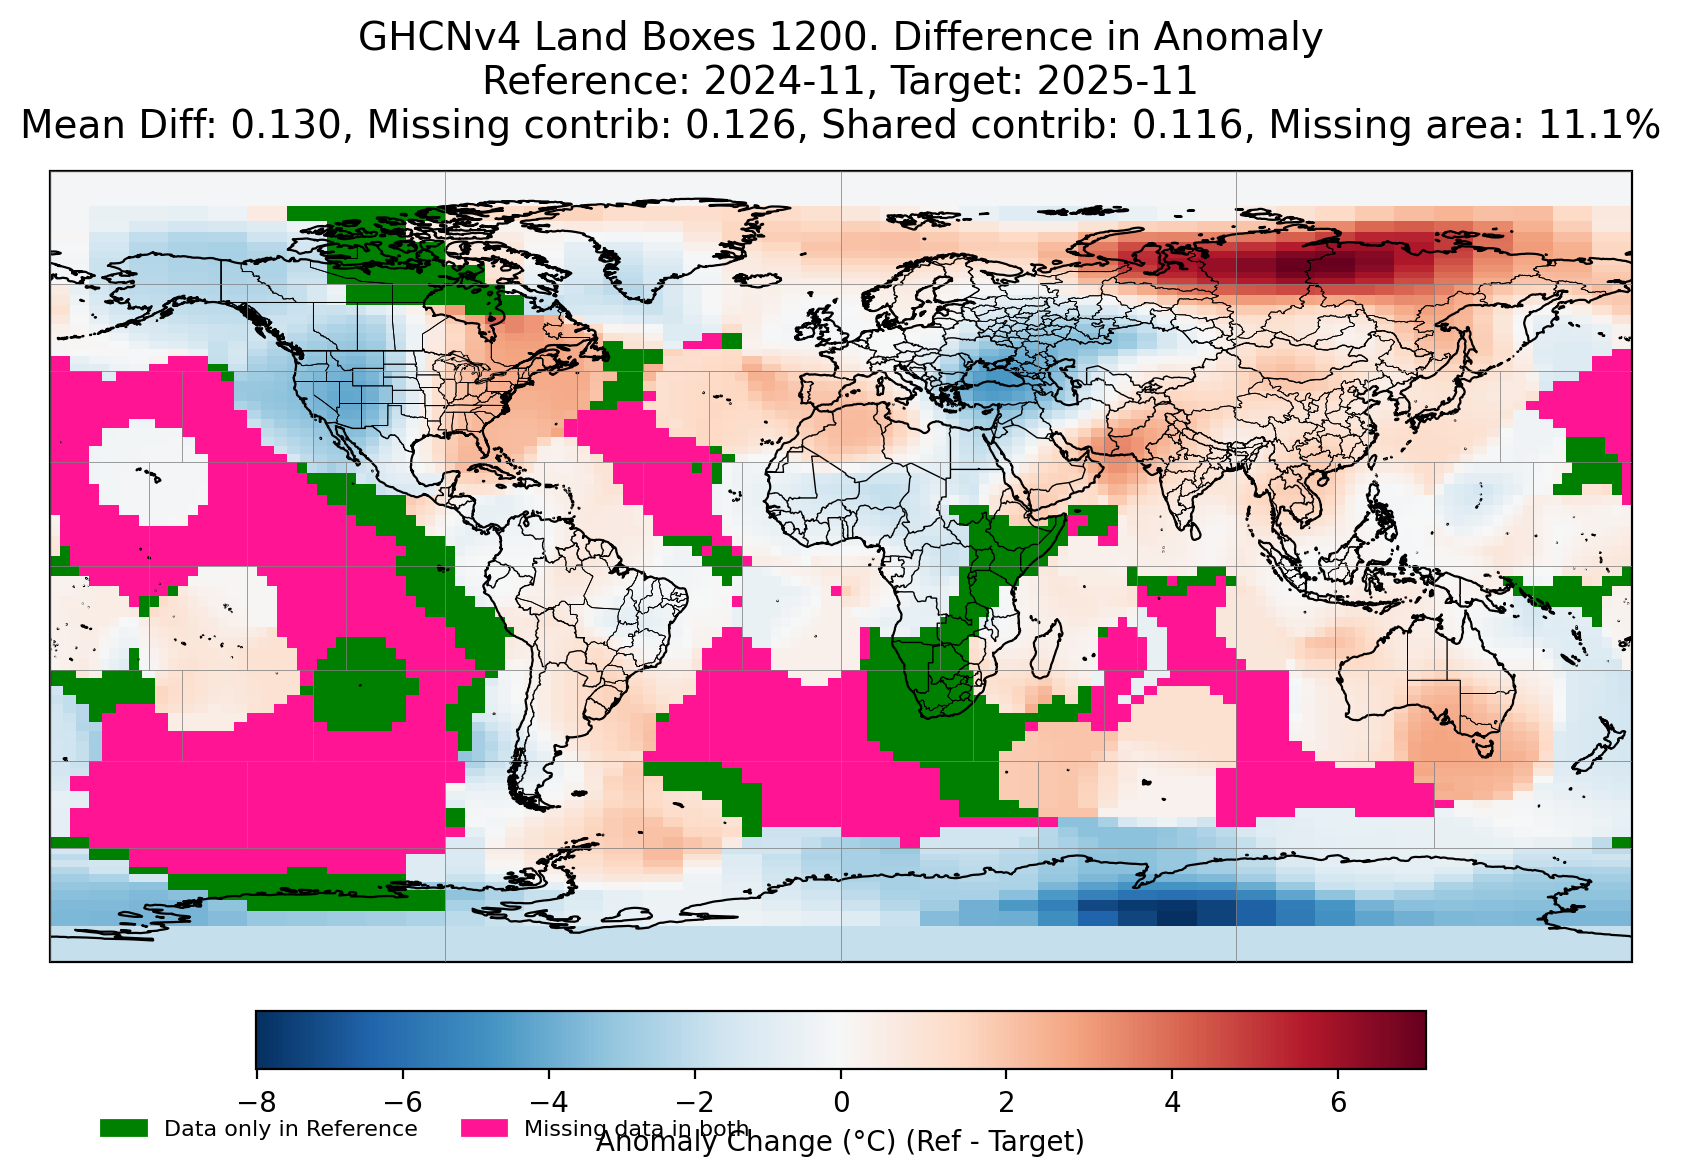
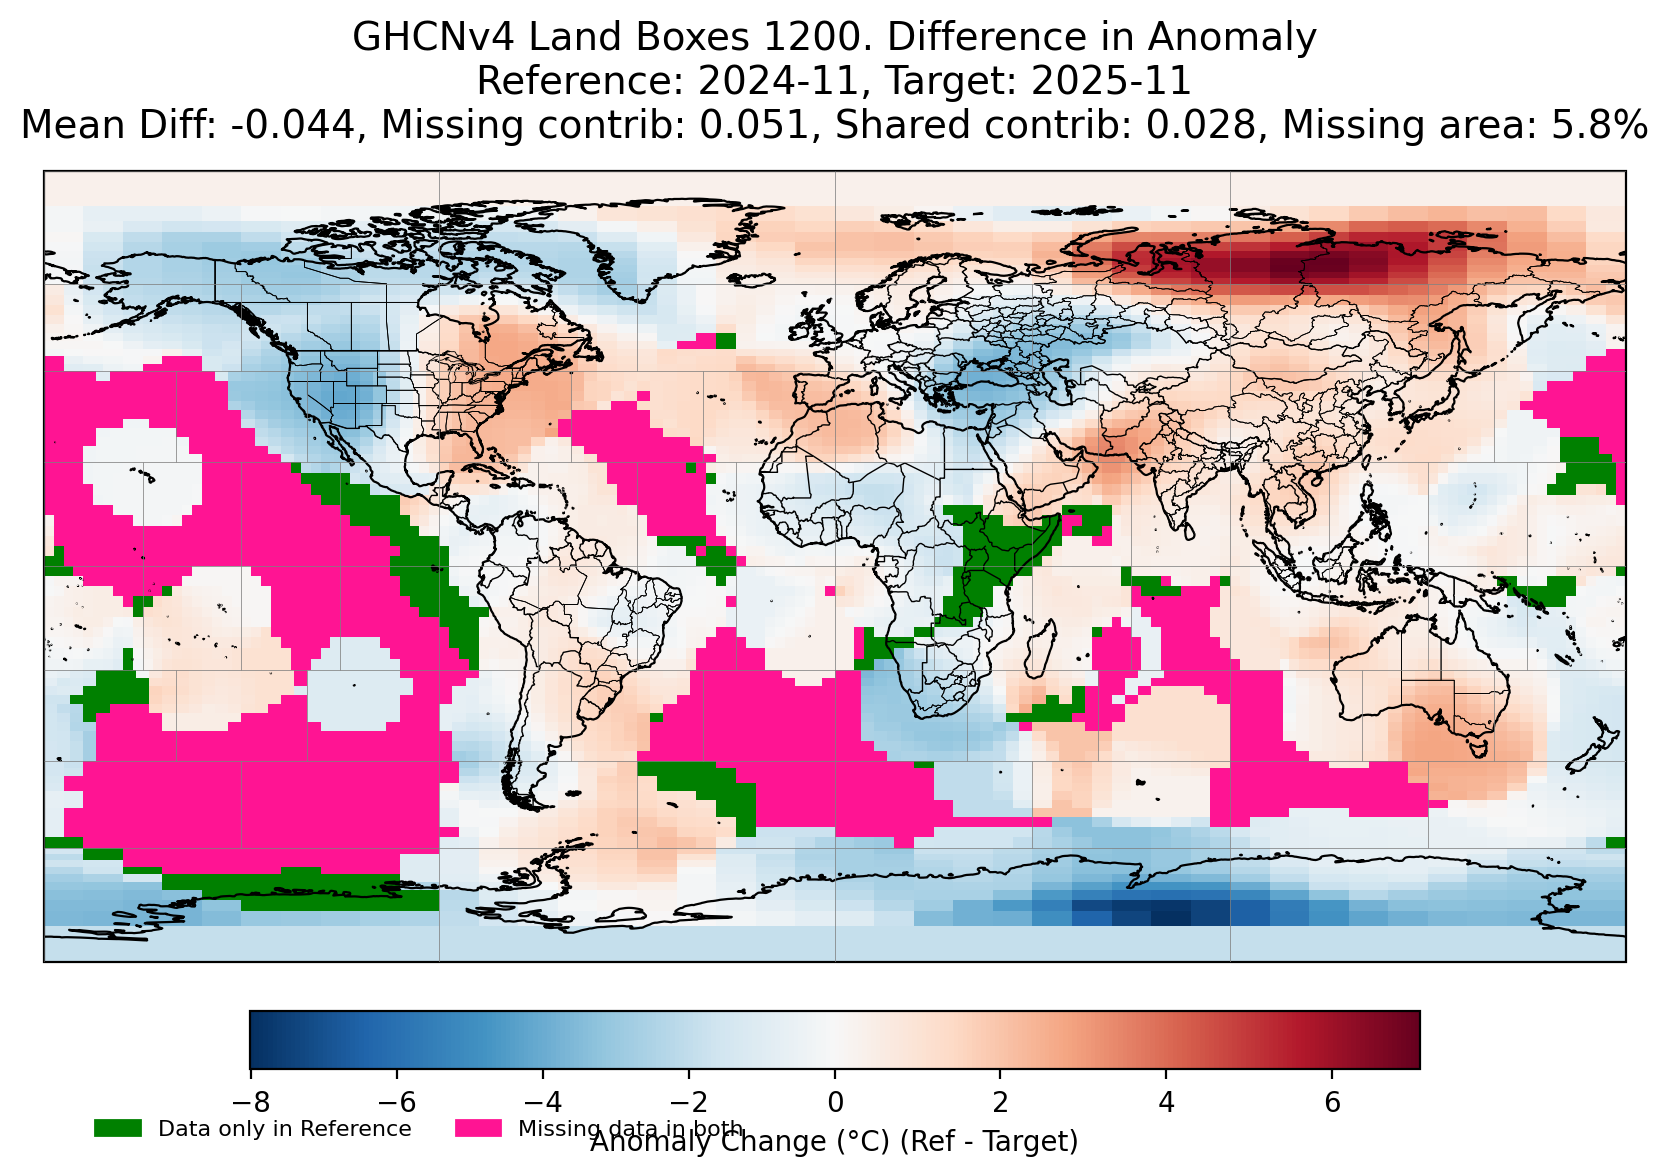
Comparing last two gistemp runs.... (where cold means colder in most recent run), can see what actually got changed within existing subboxes from both
Comparing last year as reference (where cold spots means colder LAST year, warmer this year), you can see which boxes are still missing lots of coverage.

Unlike yesterday where it was more straightforward (with most of the countries predicted to come in mostly being cool), glancing at what areas are likely to come in doesn't make it trivial to subjectively predict whether it will rise or fall tomorrow given the mix of expected cooler, and (marginally?) warmer places (i.e. Vietnam, the Nordic countries, and some islands (i.e. Jan Mayen in the Arctic looks anomalously cold in ERA5), while places like Algeria and Colombia for instance that look warm enough to cause some slight warming; there are also places like Saudi Arabia that should come but look like they are infilled roughly correctly?
So based on the above I have much less confidence compared to yesterday in any subjective prediction whether it will go up/down for at least tomorrow (If i I had to guess I would guess it will perhaps drop a tiny bit if we get both Vietnam and Jan Mayen island barring no other anomalously warm and unexpected countries). Still not enough data yet for me to revise upwards or downwards yet from my ERA5 prediction as there are plenty of landboxes still outstanding (especially in the Arctic like in NE Canada).
~
Final ERA5 came in for Nov 30 (revised a minor bit upwards), so for final ERA5->GISTEMP point prediction after all adjustments I get 1.225 C after all adjustments (1.210 C unadjusted from own past errors). Despite the minor adjustment, this didn't significantly alter the actual prediction from a couple days ago as it was only a single day, so no update is indicated.
~
I know last month I was a bit over in my prediction, and so far this month it looks a bit difficult to see where the additional warming is going to come from to bring it up 0.07C to match my prediction, but its still early and predicting the overall final rise from the additional landboxes is difficult but given that it looks like there is more outstanding and sufficiently warm landboxes than cool ones to increase the temps further I am still anticipating overall further rises later on ... After writing all of the above, I do note polymarket has adjusted slightly downwards since the last update. None of the above is enough to me be confident in updating in any direction.

@parhizj the two real questions are:
- If we're going to get data from China on the 6th
- How anomalous will South Africa be on the 7th before homogenization
@Rhhgdd In general I'm not expecting another patchwork trickle but this is speculation so for a decent portion of China I don't know why we shouldn't expect it to come in a timely manner (like it did last month). (I note ghcnh has it already to the 11-27th so it seems on track to get the last three days by the 6th or 7th again)
You make a good point about SA again, but it looks more bifurcated than last month in terms of temp so there will be SOME homogenization already by the 6th but given that the western half is anomalously hot and only the NE part anamously cold (with more stations in the western half) it looks like it will be fairly warm again given how much more anomalously warm it was in November again. But if the automation part of the NCEI upgrade is done for SA and we get more of the eastern part of SA in a timely manner (similar to what we have now for October) I still expect it to be more anamolous than last month but not like it was on Oct 7th (I am going to speculate we will not get a patchwork trickle and we will end up with more stations in SA than we did last month, so we are not likely going to reach almost 1.24C like we did last time on Oct 6th)

(still havent had time to do my own ERA5 spatial chart so quickly blending the ones from climate analyzer which are missing a few days still from Nov...)
ghcnm.v4.0.1.20251204:
115.36
Still too early to update -- not enough coverage ... (39%), runs starting tomorrow should start to become useful for updating.
Nothing apparently suprising in the data that did come in...
~
Temp went down (as predicted with low confidence), but not exactly per the scenario I had in mind so I won't call it a clear success.
With the exception of more of Antarctica, West Africa, Algeria, and Saudia Arabia the other new data that came in were not expected (North Korea, Poland, Greenland), and we did not get any data from Scandinavia, nor still Vietnam or Jan Mayen island, instead we got from Hong Kong and a few other places, showing its still very hard to predict what data will come next. Total coverage is where it was last month but of course in slightly different regions.
Data is still too early to be useful IMO; tomorrow ghcnm there should be a significant enough update in terms of coverage and stations to slightly update on this market (i.e. last month we got to 116.95 for the same day and presently its 119.09 -- of course in subsequent updates it went way above that with the partial data until more data came and it went down to where it is now); there are actually too many countries/regions to expect in this update so there is not much meaning to narrow down on just a few, but besides whats mentioned previously as outstanding its notable that Australia and India will be on the cool side.
However, most of the new data tomorrow coming in should be on the warm side (based on what came in last month) so we should expect the temp to rise tomorrow.
ghcnm.v4.0.1.20251205:
116.01
~
Got quite a few more stations, but missing some key warm contributors (Canada and SA being the most important)...
~
Temp rose a bit comparable to last month as predicted... (although we got some more stations than the same day we don't have nearly the same coverage as the day after). Before looking at the gistemp final result from last night I did look at the data coverage and stations first and it did rise roughly in par based on the countries that came in to what I expected so based on the below and my original ERA5 estimate I placed some small upgrade in the bets based on this that I am slightly more confident that it will jump up enough with tonight's ghcnm (but keep in mind I still think the lower bin 1.15-1.20 is overall undervalued based on the ERA5 estimate alone but I am already overweight in that bin relative to being underweight in the 1.20-1.25 bins and 1.25-1.30 bins in terms of shares):
~
Tomorrow I'm expecting Canada and South Africa (at least the western half) to bring a large jump to bring the anomaly up into the next bin (i.e. last month we got a nearly 0.07C increase -- given that we may get all of SA possibly at the same time tomorrow (at least relative to what is available now for Oct 2025) and the various possible combinations of unknowns listed below its hard to tell to what degree temps in Africa will end up contributing since the eastern half of SA, and Mozambique is anomalously cool while Rwanda is likely on the warm side -- see list below).
Unknown whether we will get some likely warm contributors that should be fairly influential including: Mexico, Rwanda, Easter Island, Turkey
On the cold side unknowns are: Mozambique
Ambiguous uknowns: Norway and Sweden (hard to tell with infilling), and other countries that are already infilled for their box but could cause it to shift up/down with better land coverage (i.e. Chile, Peru, Bolivia).
ghcnm.v4.0.1.20251206:
122.44
~
Disregard what I said about Easter Island yesterday. I looked at the ghcnm data for it and realized its data starts at 1976 so it will be a masked landbox (i.e. an area that doesn't contribute) -- with this respect I need to update the landbox code to mask the ones that need to be masked for the mixed subboxes to get a better idea of the coverage for the mixed boxes outstanding...
~
(Still doesn't look like there are any erroneous data points, looking at top hot/cold by usual methods)
~
Temps are near where I predicted yesterday (and today after looking at the stations before looking at the numbers; i.e. SA came in fairly well homogenized but without Mozambique).
Tomorrow, Mexico and Turkey look to be the last possible warm contributors (it's already infilled partly on the warm side for both so its difficult to tell whether its already baked in).
As mentioned yesterday there are still outstanding unknowns that could come in and cool/raise it depending on what combination (i.e. Mozambique but not Rwanda vs Rwanda only vs both come in would be cooler vs warmer vs ambiguous relative to today..). But the odds are more South America countries will come in (i.e. Chile, Peru) to bring temps possibly down (they are also infilled to some extent fairly well). In other words I am expecting the countries mentioned previously will come in by tomorrow and bring temps down a tiny bit (maybe to 1.20 or 1.21).
However given the odds of what is outstanding and how decently they are already infilled it shouldn't shift in one direction too much tomorrow (maybe 0.02C max in either direction?) however this makes the lower bin much less probable now, and subjectively for me increases the 1.20-1.25 bin and 1.25- respectively compared to yesterday...
Its also possible that GISS ends up using the data from last night rather the forthcoming ghcnm tonight for the preliminary report, which shifts the probability higher further.
Subjectively 70% seems about right given we are currently at 122.44 and the above expectations that a preliminary report will come out on Tuesday using last night or tonight's forthcoming ghcnm... (The lower bin is still a bit undervalued I think but I am already hedged as much as I want to be.)
ghcnm.v4.0.1.20251207:
122.14
~
Given the below, that the few outstanding countries will likely only drop it a tiny bit further (even if it is delayed by one day), and my anticipation of a preliminary release tomorrow (we are at 96% coverage with infilling of landboxes) coming in on schedule, and with it being based on most likely this ghcnm data or yesterday's data, I see less reason to keep such a strongly hedged position.
It dropped a tiny bit as predicted but not for the predicted reasons as the countries data we did get in were marginal contributors, we did not get several of the anticipated countries like Mozambique or Mexico, etc.
~
Despite Mexico not coming in, Turkey did come in and it looks like it was infilled marginally on the warm side for the eastern part cooling the box a bit while the western part warmed up a tiny bit (overall probably slightly cooling the box). Aside from that, the Canary Islands came in with a similar behavior, cooling it's subbox marginally further. Chile looks like it was actually infilled marginally cooler originally so its addition was a very marginally warm contribution to the south it appears.
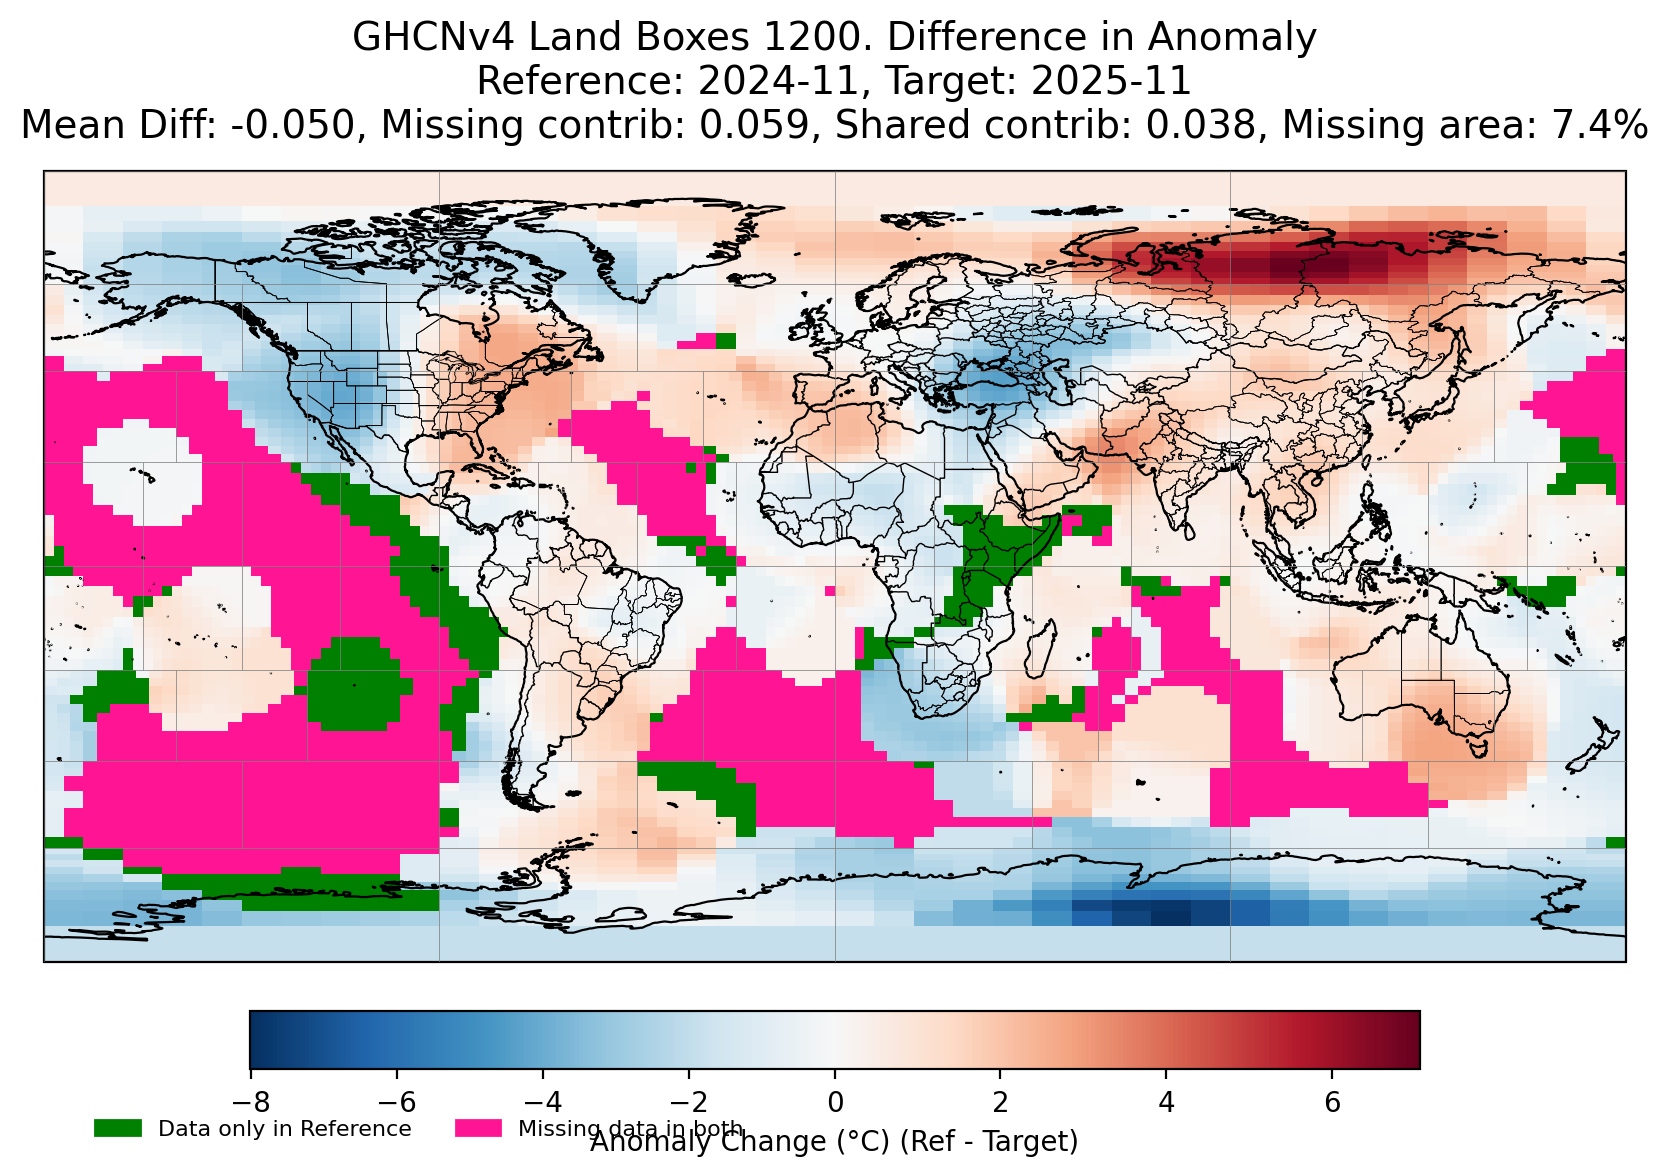
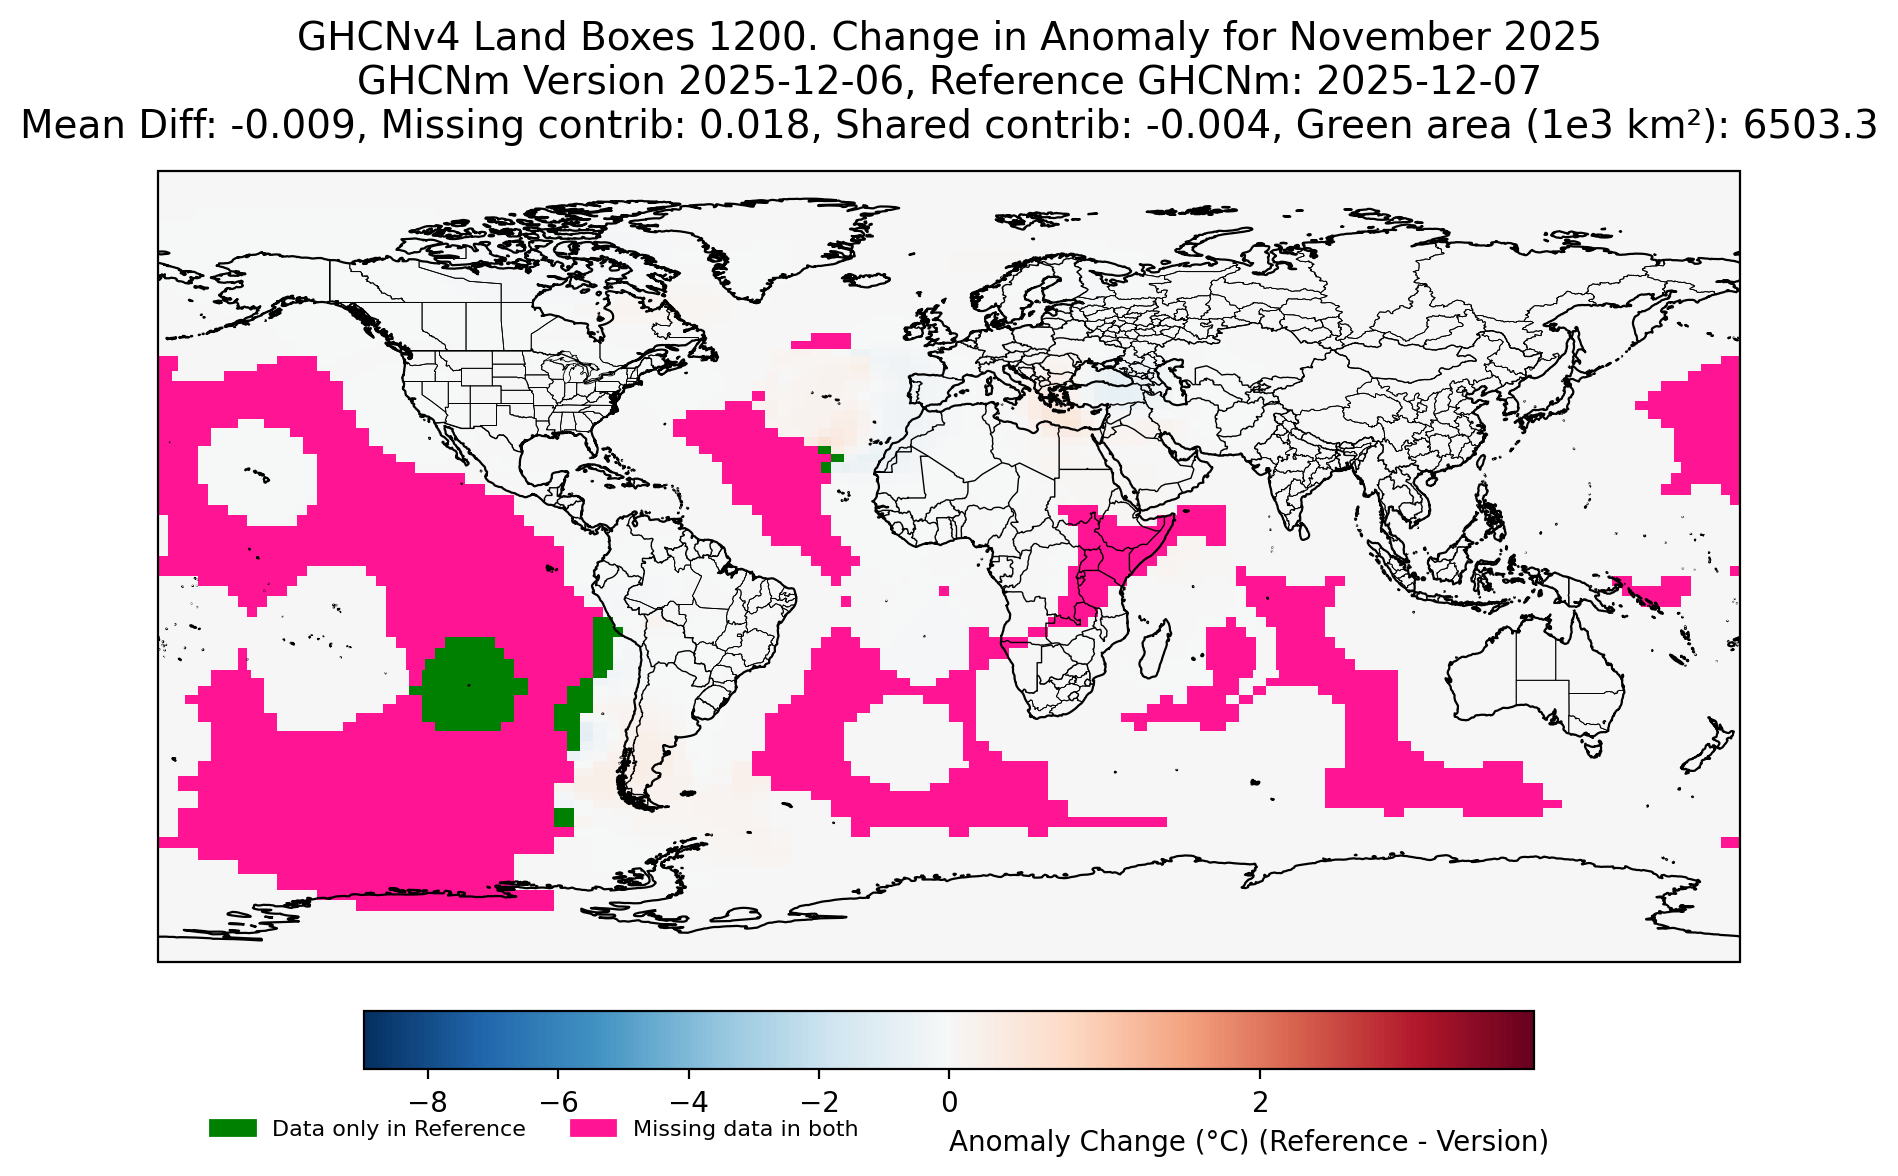
Comparison of landboxes from last two runs...
ghcnm.v4.0.1.20251208:
121.79
~
For completion sake posting again today but unlikely they'll use this one (regardless its still 1.22 C with rounding). 4 more hours until the scheduled release.

A few more stations came in that (net) reduced it slightly cooler again (cooling looks to be mainly from a few more stations from the Antarctica peninsula, while Peru appears to have marginally warmed it).
Edit: I forgot to mention I am a bit surprised we still haven't gotten Mexico but the data coming is still unpredictable to a degree (also missing Rwanda to cover central Africa). Should still be enough for a preliminary but thus not updating (past 85%) since there is still remaining (small) uncertainty whether they will delay or not.
@Rhhgdd Getting 1.230 (1.215 without adjustment from own past errors).

That sharp drop at the end of the month seems to be from mostly Siberia and N. America:
Looking at the forecast for December I do wonder if whether we will get another year where there isn't a proper dip/inflection for winter and it sort of flat lines like the winter for 2024-2025.
~
Nov data release date is scheduled for Dec 9 ... should have enough for a preliminary report by then based on the timing for the data this month, but even with sufficient coverage its still going to be a bit sparse data wise...
I note that the October data has shifted as of a few days ago now to a lower bin (1.1943) when they some more data for Bolivia and parts of Antarctica came in.
I don't know if we should expect a drip-drip of data again for areas that came late for October, or to expected those to make it next month on time. Based on the rate they have been going it doesn't seem likely NCEI will finish the upgrade in the next 2 weeks ((before the November report is released). A good deal of the mana again will seem to be made guessing what regions will make it into the data in time for the report and how much shift will occur...
banana
@Rhhgdd Even without the very end of the month still not in the medium range ensembles, the very end of the month looks to be a bit more uncertain than usual.
~
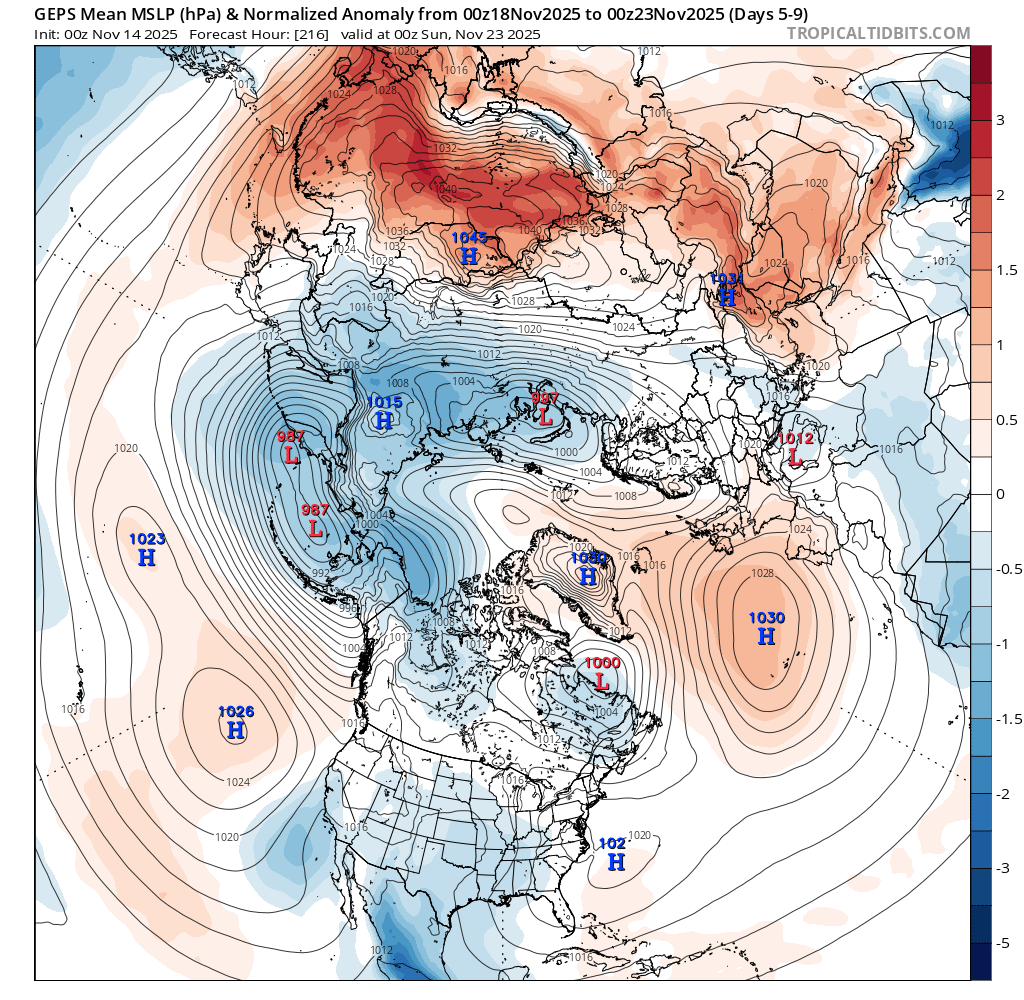
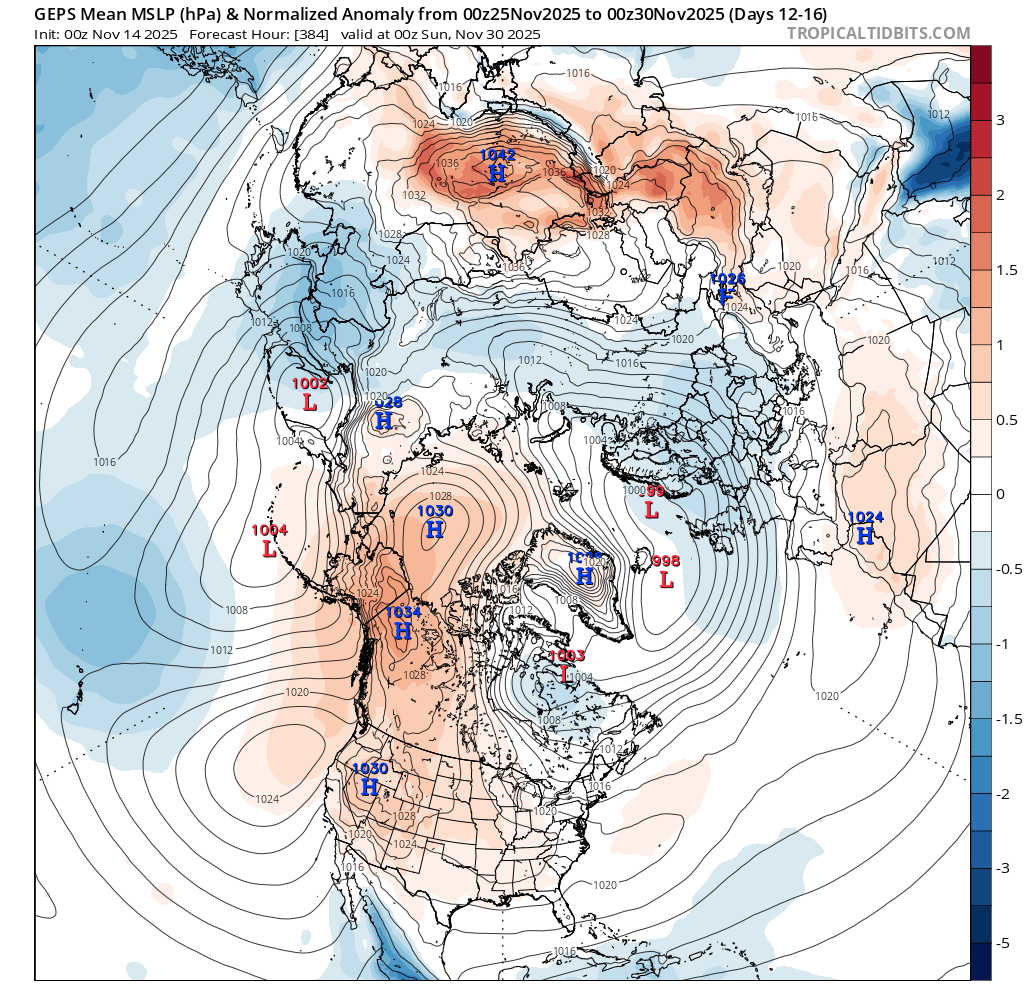
Regarding Alaska/NW Canada:
I can't say how large a contribution but it looks like from examining the synoptic scale from medium range forecasts, some of the warm anomaly in Alaska / NW Canada from the bump in temps over the next week (especially ending near the 21st) looks to be coming from warmer extratropical air advecting poleward from (frontal?) extratropical cyclones.
ECM/00Z EPS/00Z disagree about the synoptic situation of course at the end of the month with the jetstream arcing poleward in ECM creating a high pressure over Alaska (but EPS doesn't have any strong agreement that far out on such a speculative scenario).
From the 00Z ensembles... (very last day in medium range is GEPS/GEFS only thus higher uncertainty).

~
For the bump in the next couple days perhaps?:

and for the Nov 19-20th bump...
~ Edit (Nov 14):

~
For anyone that cares pivotalweather's (open) beta has finally made their site (more) usable as they now have a slider like tropicaltidbits that makes it so much better to quickly advance ...

~
Anyway based on the steep trend at the end of the month and some subjective expectation of above average uncertainty for it (i.e. the last week) I expect above average error from that period, so I'm flattening my bet now a bit.
~~~~~
~~~~~
I note also that there has been disagreement in the short term trend (last 4 days) of the center point predictions between the two notebooks I use (one with the higher variance per-ensemle debiased temps in the superensemble has trended upwards slightly, and one with the unbiased one which has lower variance has trended downwards slightly -- I usually rely on the latter though as the bias seems generally comparable).
~
The latter after all adjustments has a center point prediction of 1.246 C for reference.
~~~~
~~~~
I don't know if I've noted it but I switched a few months ago to referencing less dispersive distributions using my own empirical estimates of the super ensemble variance (i.e. not including the super ensemble member distribution's variance) along with some other measures to give a better subjective idea of the distribution (i.e. a statistical model, and one without any ensemble variance -- i.e. as if this was the ERA5 data after the month ends to cap the probabilities).
I.e. this is what it looks like (I also look at the trends in center point predictions from the two notebooks and agreement between them for some measure of confidence) (usually the middle one is the one I anchor my predictions to mostly (in bold), with the last of the three I also reference if I feel its overdispersive or if a one-sided bin looks to have too much of a contribution) (the rest I briefly look for agreement as a sanity check) :
From the unadjusted ensembles notebook (the one I reference as it has slightly less empirical variance):
Mean of Statistical, End-of-Month type (no ensemble forecast variance), and Estimated Variance
Bin Probability (%)
<1.095 5.9
1.095-1.145 9.6
1.145-1.195 19.1
1.195-1.245 27.7
1.245-1.295 21.7
>1.295 15.9
Mean of End-of-Month type (no ensemble forecast variance), and Estimated Variance
Bin Probability (%)
<1.095 6.6
1.095-1.145 5.0
1.145-1.195 10.9
1.195-1.245 27.0
1.245-1.295 27.5
>1.295 23.0
End-of-Month type (no ensemble forecast variance)
Bin Probability (%)
<1.095 0.0
1.095-1.145 0.5
1.145-1.195 9.2
1.195-1.245 39.6
1.245-1.295 40.4
>1.295 10.3
~
From the debiased ensembles notebook:
Mean of Statistical, End-of-Month type (no ensemble forecast variance), and Estimated Variance
Bin Probability (%)
<1.095 5.2
1.095-1.145 9.1
1.145-1.195 17.2
1.195-1.245 24.2
1.245-1.295 24.0
>1.295 20.3
Mean of End-of-Month type (no ensemble forecast variance), and Estimated Variance
Bin Probability (%)
<1.095 5.4
1.095-1.145 4.3
1.145-1.195 8.1
1.195-1.245 21.8
1.245-1.295 30.8
>1.295 29.6
End-of-Month type (no ensemble forecast variance)
Bin Probability (%)
<1.095 0.0
1.095-1.145 0.1
1.145-1.195 4.4
1.195-1.245 29.5
1.245-1.295 46.8
>1.295 19.3
Regarding people betting the lower bins up... I wish you luck (I would appreciate some cooler December weather):
~
Something that I failed to mentioned yesterday was that my impetus the other day for looking at the synoptic situation in the arctic was spurred by a lot of people on social media discussing the potential of a SSW in the Arctic around the end of the November (~Nov. 26). (This is something I did look at for quite some time but didn't mention in my post, for reasons below...)

Regardless of whether/how this (13+ day forecast) verifies, this still is far out with respect to how that uncertainty might translate into the synoptic situation (especially for Siberia and US/Canada) at the end of the month.
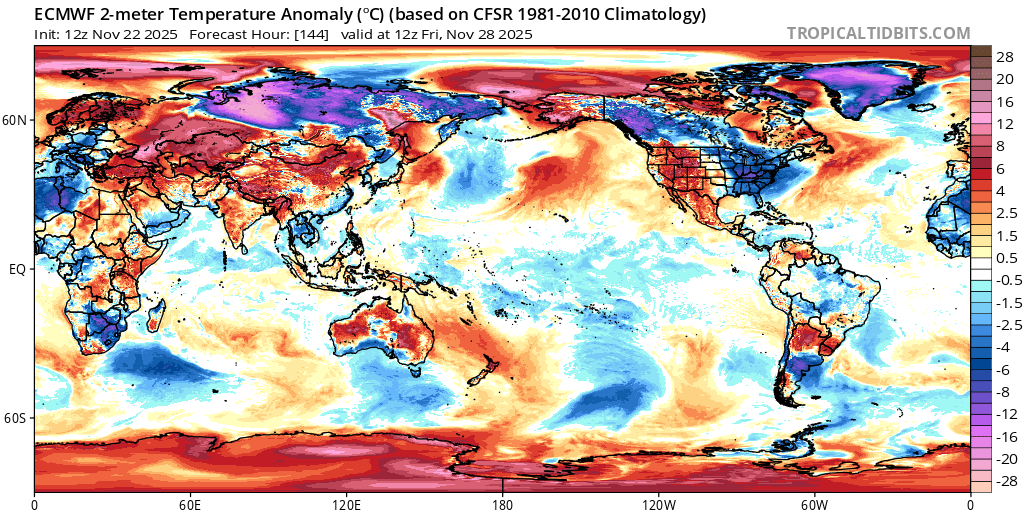
For instance, GEPS shows a Siberian high developing for the end of the month (~10 days or so) and a corresponding cold anomaly...
While GEFS,EPS do not show this..
For the continental US the amount of cooling also has very different scenarios for the end of the month. For this comparison I just show det. models for ECMWF/GFS (the ensembles are necessarily less dramatic but this is just for ease of understanding, also CMC doesn't go out that far...)
(Edit: corrected images)
(GEPS, GFS, ECMWF 00Z runs below for same valid time Nov 29/00Z):
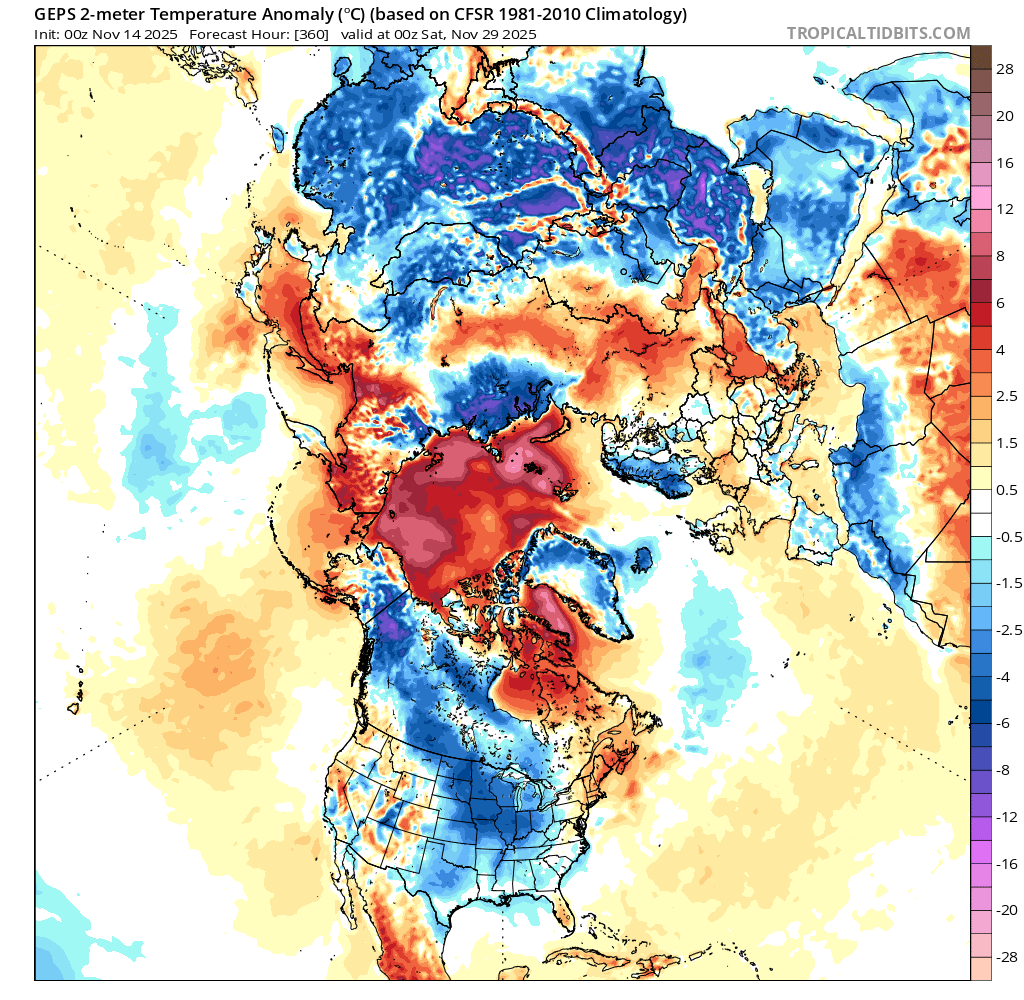

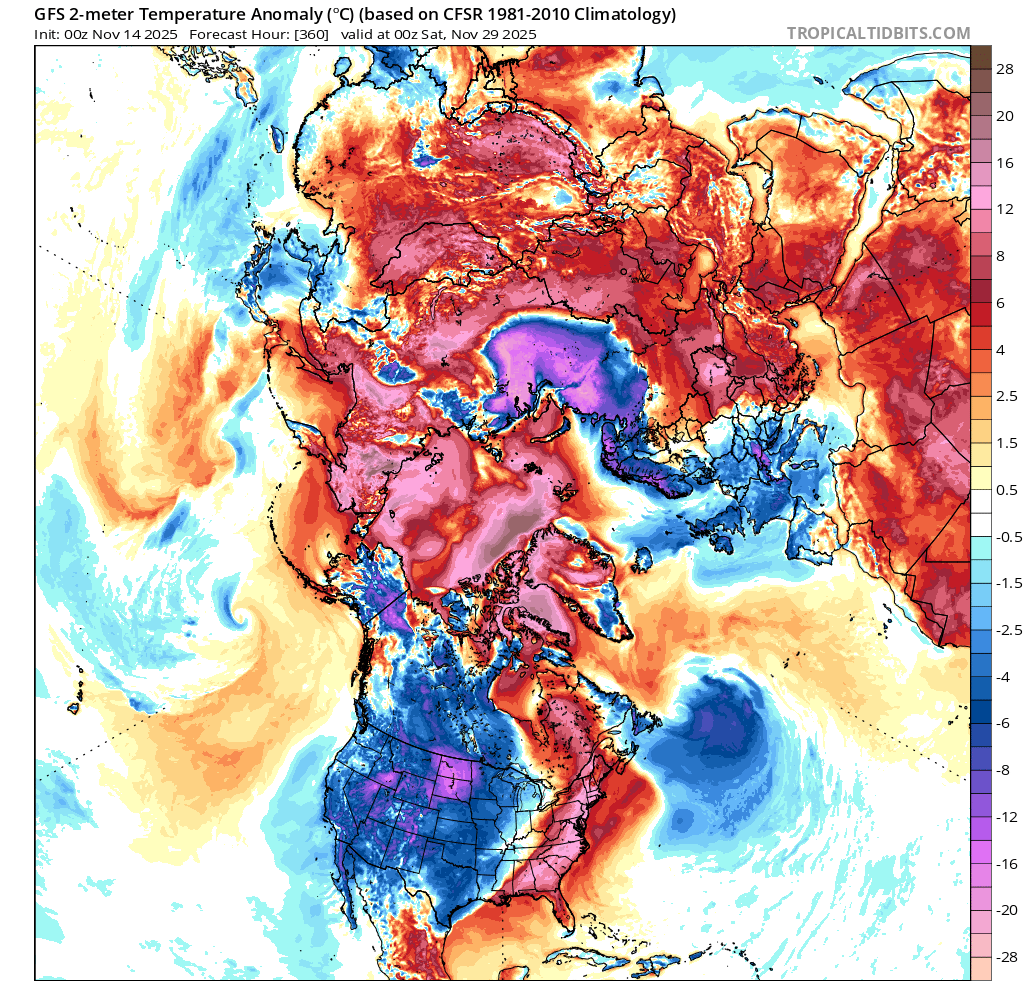
The mid range ensembles for 00Z are only missing the last day or two depending on the ensemble and have already baked most of this temp drop in (minus the last day), but afaik there is still a chance of a false alarm for the SSW in terms of how overdone it results in cooling temps for the end of the november (magnitude and timing).

December is a different story depending on what exactly happens...