Update 2025-06-12 (PST) (AI summary of creator comment): The creator has added answer options for the following values of N:
100
500
Update 2025-06-12 (PST) (AI summary of creator comment): The creator has provided the following definitions for how the market will be resolved:
A robotaxi service is defined as one where a user can request a ride on-demand, similar to Uber or Lyft. It will still count if riders must first join a waitlist.
The fleet size will be determined by the total number of Teslas used for an autonomous ride by someone other than the owner.
A vehicle is considered "actively operating" if it provides at least one such ride within any given week.
Update 2025-06-28 (PST) (AI summary of creator comment): In response to a question, the creator has specified that a vehicle will be counted as a robotaxi even if a safety monitor is present, as long as there is no human in the driver's seat.
 1,000
People are also trading
https://www.tesla.com/robotaxi
Tesla website estimate of unsupervised miles.over 4 miillion cumulative miles. Continuing 560,000+ per week

Tesla passed Waymo last week in driverless miles in Austin. The Tesla geofence service area is far larger than the Waymo service area in Houston. 49 square miles to 254 square miles. 561 tesla vehicles on the crowdsourced tracker.

@brianwang Intriguing graph! (Btw, did you see my other comment here with the parenthetical beginning "moderator hat on"?)
First, a quibble: Notice that we don't have the latest numbers from Waymo to know who had more miles in Austin last last week:
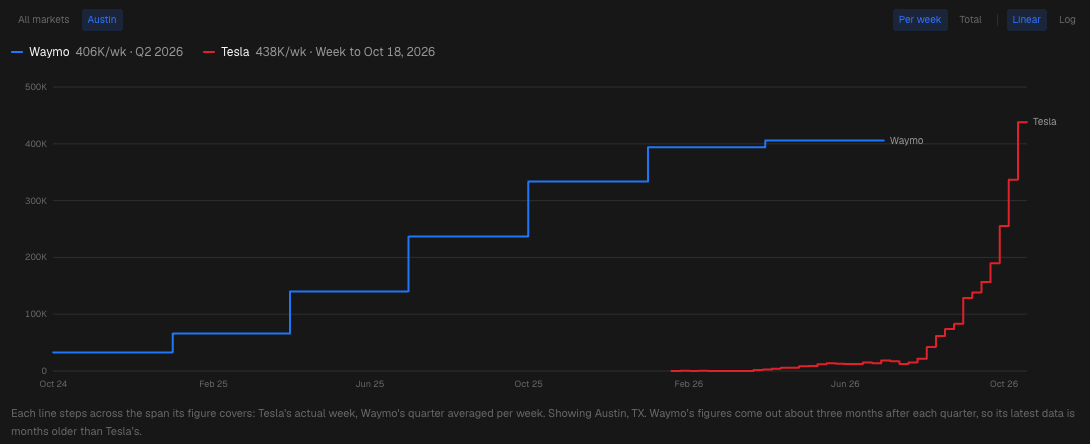
More to the point, Waymo is only available in Austin through their Uber partnership and Austin is a small fraction of Waymo's miles. Overall, Waymo vs Tesla robotaxi looks like this:
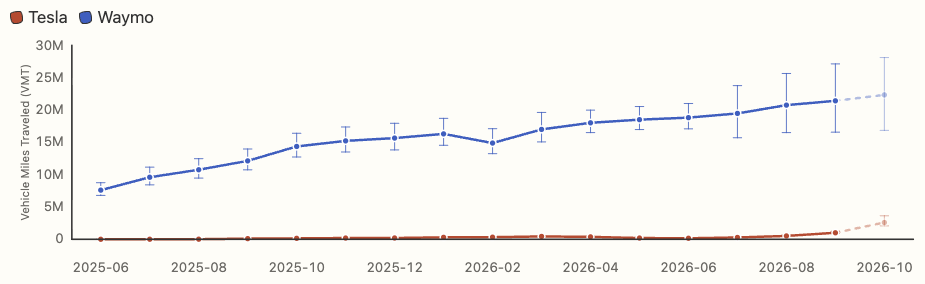
It's possible that Tesla will shoot past Waymo in 2027 but, just, please be diligent about confirmation bias.
PS: The expanded Houston service area seems to be a publicity stunt:
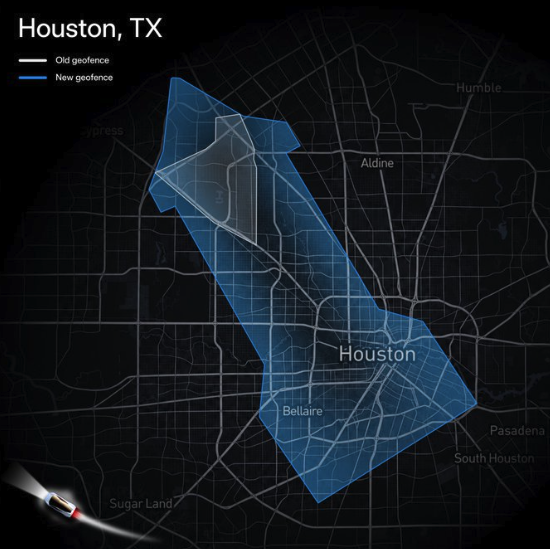
Actual Houston mileage is tiny and recently decreasing somehow, per robotaxitracker.
PPS: I also explained in my comment below why that 561 fleet size number from robotaxitracker is not very meaningful for this market.
@dreev I agree the crowdsourced undercount number is not meaningful. 558K miles up to Oct 18. Median ride length 3.4 miles. 164000 rides in that week. Increasing 20% per week. 641 rides logged in a month. 160 rides logged in a week. 0.1% of rides were logged.
At Tesla 20% compounding:
Week 8: ~2.4M
Week 10: ~3.5M
Week 11: ~4.15M (crosses the ~3.9M Waymo Q2 benchmark)
Tesla should be 5000 vehicles with 20% mileage growth.
Waymo rider-only miles:
~271.3 million cumulative through June 2026.
Weekly average in Q2 2026: ~3.90 million miles per week.
Based upon the current sampling rate would required scaling from adding 300 every 2 weeks and getting to about 2500 should just get to over 1000 logged with the 160 ride per week logging.
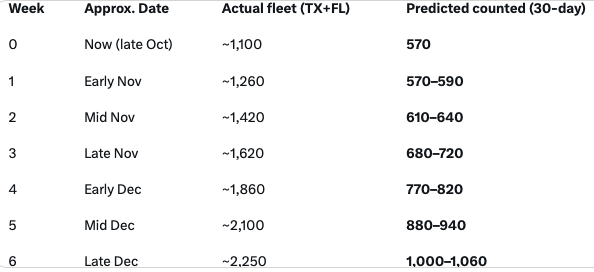
On tracker headed Tesla Robotaxi miles · no safety monitor In week to 18th Oct:
Austin 438k miles
Dallas 95K miles
How few vehicles could do this mileage? There are some non operating hours and probably some charging time during operating hours. Most mileage is I think highly likely to be non highway driving and there is lots of stopping and waiting for customers to get in and out. I also don't believe that all vehicles will be doing like 3000 miles per week, some vehicles will only operate at peak demand times and do much lower levels of mileage. I would doubt the average is over 1500 miles per week.
555k / 1.5k suggests at least 370 vehicles in that week?
So 750k miles a week sufficient to resolve 500 question? Of course, we could get better constraint(s) in future but do we currently have a better constraint?
@ChristopherRandles If we use this standard then over 15 million miles per week would resolve 10,000 cars. I think this is a higher standard that gives bias to the NO side of questions. Having 10 million miles and indications like 5000-6000 registered in Texas but clear indications of large cybercab fleets in Florida would push 10,000 into an indeterminant within margin of error level. 1 million miles per week would put 1000 into the unknown margin of error. I doubt this will matter for 1000. Dumping hundreds into Dallas and Houston will resolve that one.
@brianwang @dreev It is possible that 1500 miles per vehicle week(mpvw) is too high. But I think it doesn't look like it is too much lower:
In Texas week ending 18 October the miles driven were 438k + 95k + 7k = 540k miles. The Texas registered vehicles in the middle of that week were 739 while the number shown as "in service" went up to 502 on 19th October. The 30 day spotted number increased from 256 on 12 Oct 2026 to 273 on 21 Oct 2026.
The registered vehicles is a firm upper limit on vehicles and not all of them will have been brought into use and some that have been used before might not be used for even 1 ride in some weeks. So the mpvw to use definitely has to be more than 540k/739 = ~730 mpvw.
Going to more uncertain measures:
I think the 30 day spotted number is an underestimate from too few logged trips while the "in service" number might be closer but doesn't delete enough vehicles that might not be being used. 540k miles in week /490ish vehicles = ~1100 mpvw and 540k/265ish = ~2000 mpvw
So I think this limits us to a range of 1100 mpvw to 2000 mpvw. 1500 mpvw is a convenient number near the middle of this range but it is possible, even likely, that the "in service" number is nearer to being the more accurate measure than the 30 day spotted number. This could well make a number nearer the lower end of the 1100 to 2000 range than 1500 more appropriate. I think I would be uncomfortable if we didn't at least knock 10% off the "In service" number. That might suggest a minimum of 1200 miles per week per vehicle.
Better constraints may become available.
858 registered in Texas, crowdsource count 32 in Florida. Combined 890.
dallas adding 300 cybercab in November. Houston in November or December.
Adding 550,000 miles per week in latest week in October. 1.3 million added in 20 days in October with more added in the later week. 13% of the 4 million miles per week of Waymo. Waymo claims 4000 cars. With 17% growth per week. Tesla likely reaches 5000 vehicles by end of 2026.

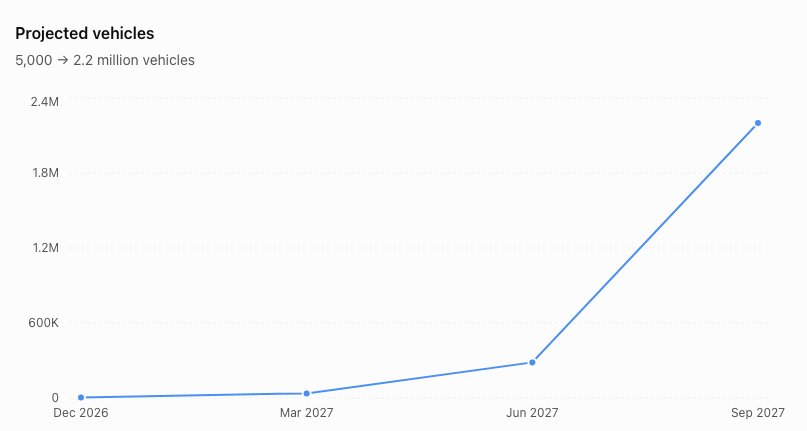
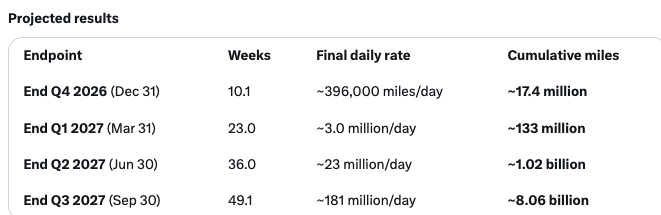
@brianwang Robotaxitracker says it counts a vehicle active if it's been spotted in the last 30 days, whereas this market defines a vehicle as active if it has provided a ride in the last 7 days.
So I would not say this is settled. There's an earnings call tomorrow, which might settle it.
(Moderator hat on: Can I make a request that you be less tendentious and demanding? I know the haters can be annoying but your excitement about Tesla seems to put you in soldier mindset rather than scout mindset. You're sharing some valuable research but I find I have to take your comments with enormous grains of salt.)
PS: Oh my goodness this is super subtle and confusing but the 509 number on Robotaxitracker is even less useful than I realized. It only excludes vehicles from the count if they haven't been seen for 30 days AND the vehicle no longer appears in any registry. It looks like we have:
509 = 297 spotted within 30 days + 212 not spotted but still registered.
As far as I (i.e., my robots) can tell, the only solid lower lower bound we can establish for number of vehicles that actually gave someone a ride in the last 7 days is the number of distinct VINs in Robotaxi's vehicle registry with passenger trips in a given 7-day window. If we pull that data with a rolling 7-day window I'm getting this:
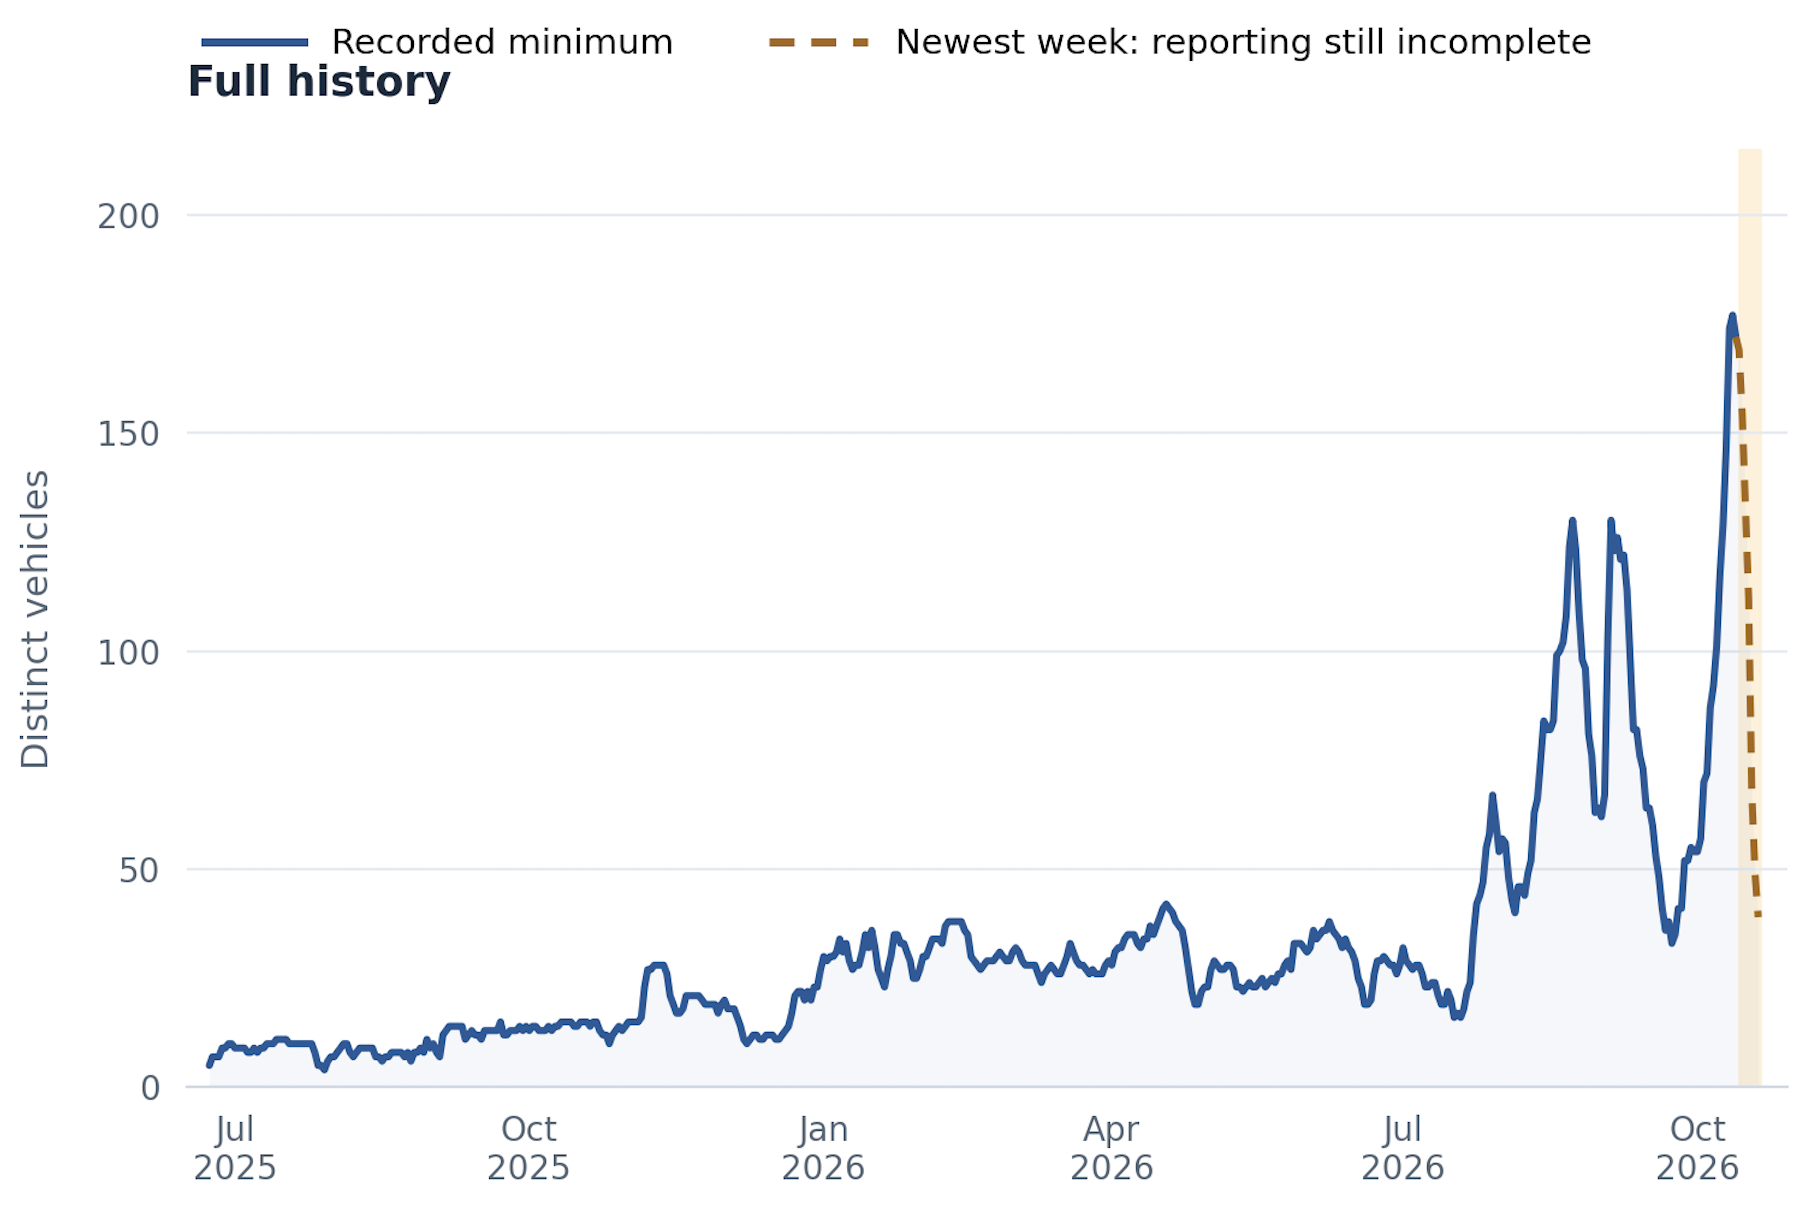
So hitting 100 is established pretty well (there's still the question the market creator should adjudicate, whether it counts if the fleet size briefly hits some N and then shrinks again) but not 500.
You're right to emphasize that those are just confirmed rides from user-submitted reports. Presumably most rides are not submitted to Robotaxitracker. So the above graph is just the provable lower bound on fleet size. But that doesn't imply any confidence that we're over 500. If I try to have the robots construct an elaborate model of likely true fleet size based on repeat VINs in the reports, they come up with something like this:
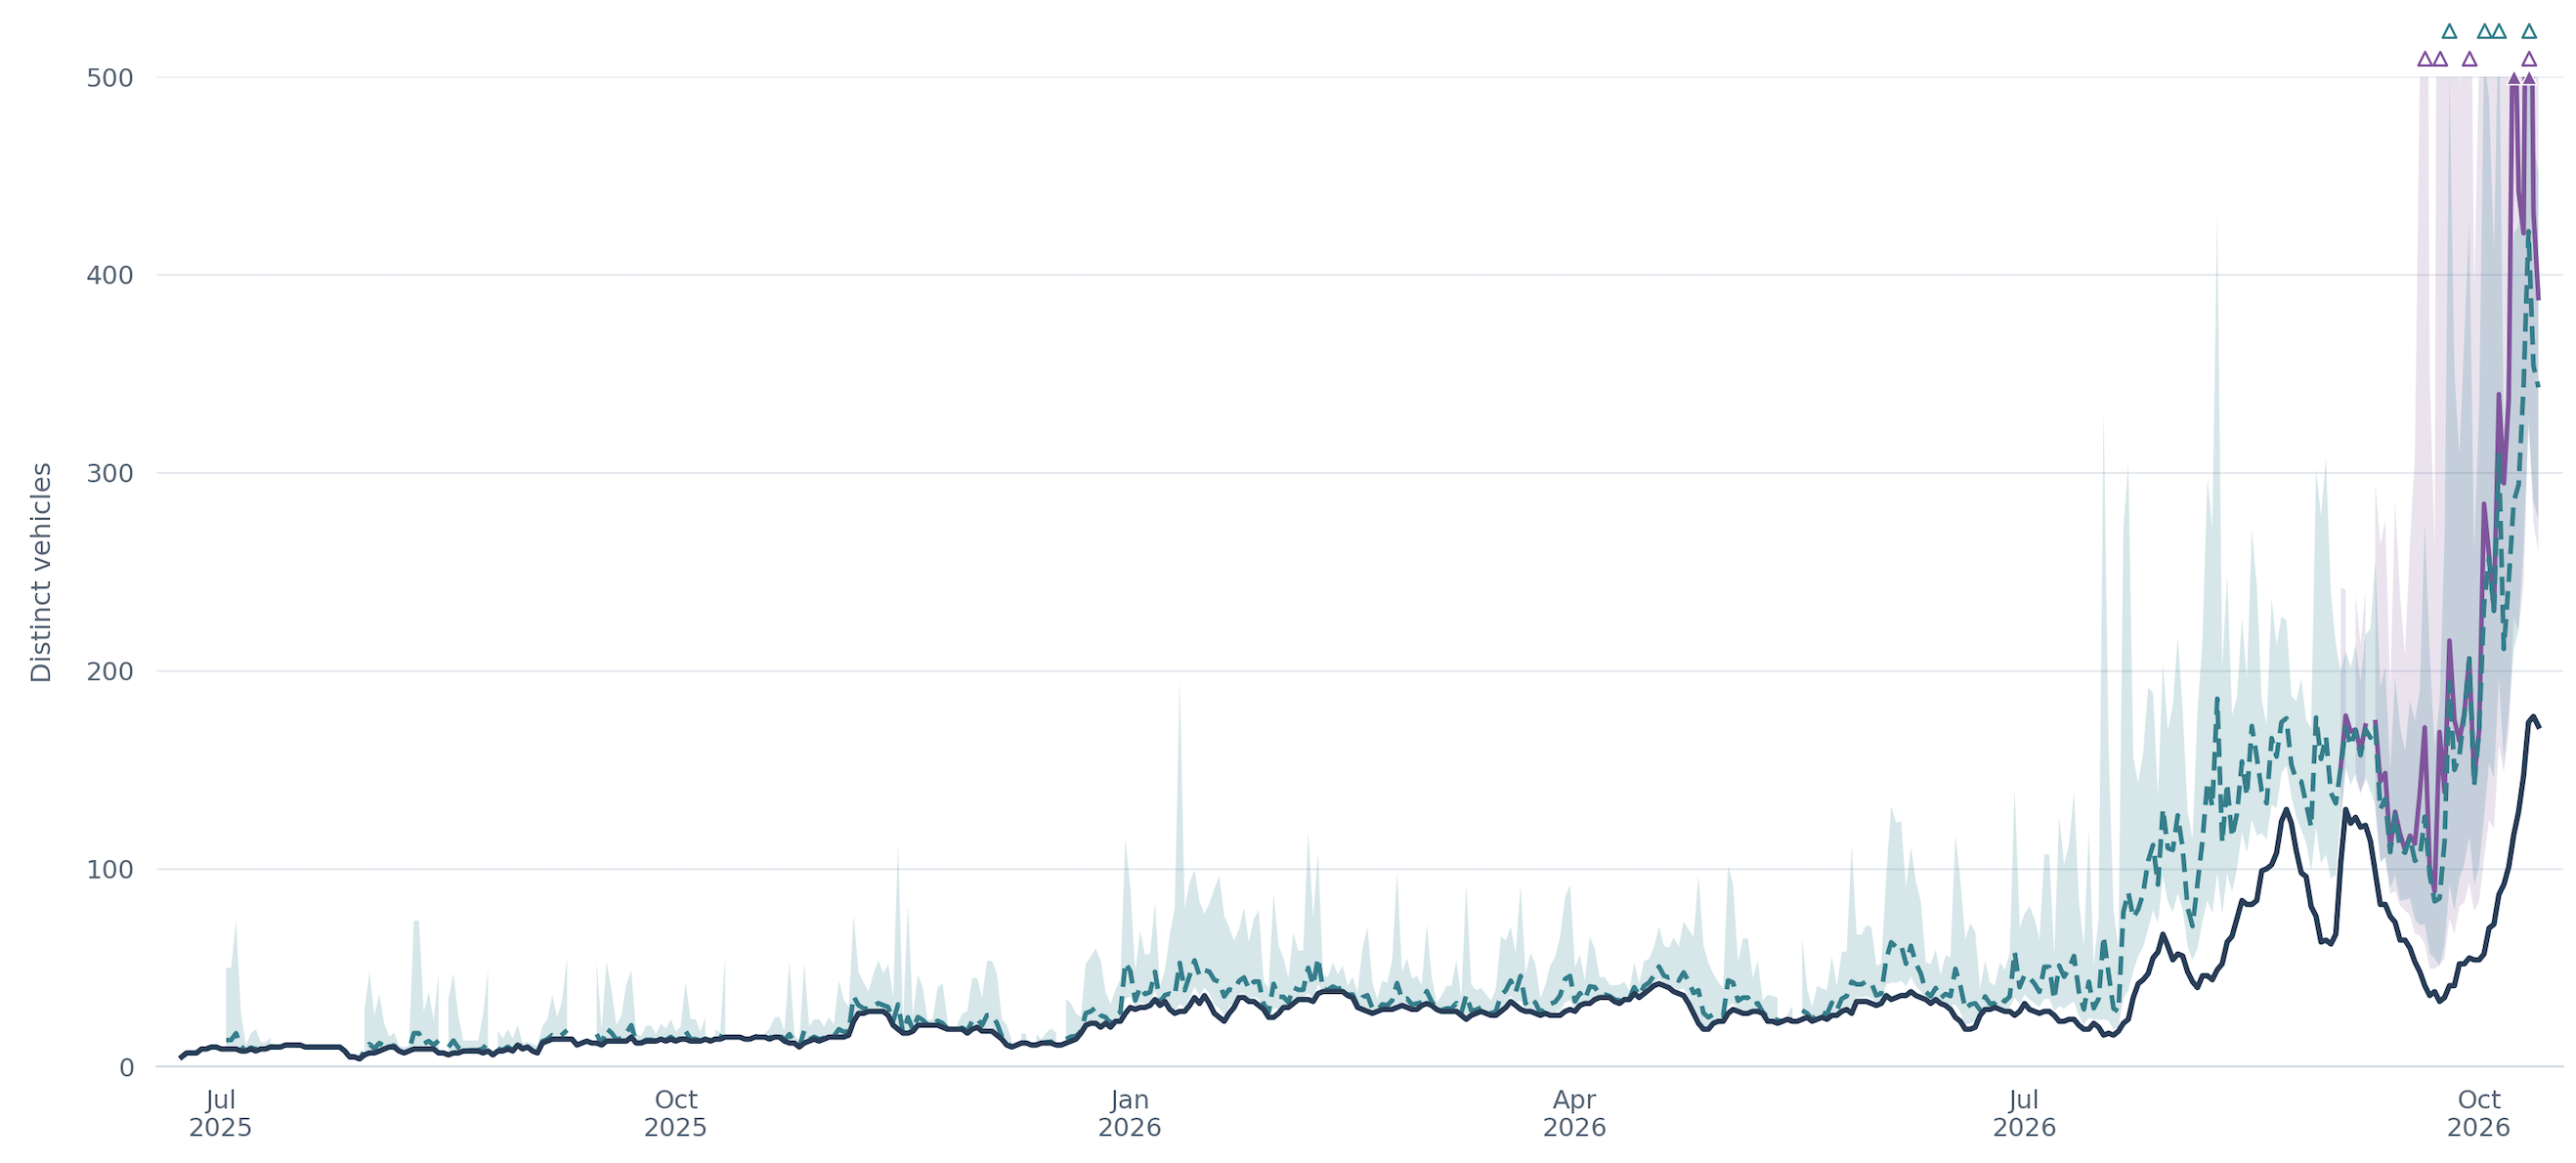
The black line should be the same as in the previous graph above -- a provable lower bound on the weekly active fleet size.
In conclusion, 500 isn't implausible but the uncertainty is huge.
@dreev I see 273 spotted in 30 days. As this is under Texas registrations I guess this excludes Florida spotted vehicles so your 297 could well be correct, I am not sure where your figure come from.
On 23 Sept trips logged were 7718 and now 8359 which suggests 641 logged trips though this could be wrong as the number went higher then has been reduced. 641 logged trips wouldn't find 500 different vehicles. Could 641 trips only find 297 vehicles if there were actually 500 vehicles? Seems quite possible but it doesn't put a good limit on the number of vehicles.
I am thinking 297 seems likely to be an undercount due to low numbers of logged trips. 511 could be overstated due to some vehicles not doing a trip every week. Some being staged ready to be used in case there is a peak demand period which is unlikely and often doesn't happen seems entirely plausible to me. There could be some undercount in the 511 due to low sampling but for now I am more inclined to believe 511 "in service" figure is nearer to being an upper bound then an underestimate.
Vehicle miles travelled or better paid vehicle miles for September Oct Nov and Dec seems more likely to provide better estimates. So I agree we should wait.
Insisting on a strict provable lower bound seems overly restrictive. We should do as best we can to estimate the number and not resolve too quickly if there is potential for better data soon.
@brianwang Communication does not seem to be occurring here. You understood me as saying "don't put out information"?
The 7 day metric is an absurd bar for accuracy
That's what the creator chose and it's pretty standard. A vehicle is active if a customer rode in it in the last week. You go on to say it's hard to estimate. Would that be any less true for any other definition of "active"? Ok, vehicles registered is easier, but not the market creator's intent and can be an almost arbitrarily poor proxy for what we mean by active fleet size.
It is completely plausible that there are over 1000 Tesla unsupervised on the roads [...] upper bound has clearly passed 1000 and 500.
I probably agree with "completely plausible" but not "clearly" which you accidentally reverted to. If you could just remove all instances of jawboning/hectoring language like "absurd" and "obviously" and "ridiculous", it would go a long way towards more scout-mindsettiness.
defaulting to a ridiculous lower end of the error bar when there is no proof that the lower bound is more accurate.
I didn't mean to imply we should resolve this market to a lower bound on the possible fleet size. I was responding to you @-messaging admins and mods with "500 needs to resolve". Did I convince you that that's premature? I guess an affirmative answer to that would be less than maximally Tesla-bullish so the question answers itself.
It bothers me that a moderator is not stepping up to clarify a fair resolution methodology.
I'm mostly participating as a Manifold user in this market, just putting that mod comment in a parenthetical. I have a conflict of interest so may not be the best moderator to take over this market, if it needs taking over. But I'm willing if needed. In the meantime, let's just collaborate on working out what's most fair. We don't need to agonize too hard yet. Tesla may well shoot up comfortably past 1000 by the end of the year and make resolution easy.
@dreev 7 day metric is flawed bar. If we are going to do it then the best way that I can think of is it to use poisson distribution. Against the log sampling. But if you have zero samples or super low sampling then nothing can be seen we are almost blind in Florida.
I think we are comfortably past 500.
Florida and the artifact of low sampling. Tampa has 129 logged rides and 25 identified cars and Orlando has 20 logged rides and 8 cars and Miami has 10 logged rides and 5 cars identified. Impossible for Miami to identify active cars. Because no rides were logged in the past month. But 20,000 miles and 7000 rides were given.
Orlando has logged 6 rides in the last month.
Tesla’s latest reported unsupervised (driverless) miles are in the same range for all three:
Miami: ~5,626 miles/week (46,262 cumulative through Oct 18)
Orlando: ~6,008 miles/week
Tampa: ~6,131 miles/week
The logical deduction is that there are 25-30 vehicles in all three florida cities.
Houston was a 30 square mile geofence before the jump to 250 miles. It has 940 logged rides and 42 identified vehicles, In July a surge to 25000 miles per week but the last 2 months about 4000-5000 miles per week. The more miles in each florida city indicates more active vehicles. 35-50 vehicles makes sense. They are more active than Houston. No reason to believe all vehicles in service are identified in Houston.
That is roughly 6,000–8,000 miles/week each. At an average ride length of ~3–3.5 miles, this supports on the order of ~2,000 rides/week per city. The service areas are also similar in size (~24–31 square miles).
25 Tesla robotaxis per Florida city (Miami, Orlando, and Tampa), consistent with similar weekly miles. IS THERE ANY REASON to assume different levels of cars with the same miles. And it is clear that zero active cars in Miami is wrong. No sampling at all in 30 days and 10 logged rides over perhaps the lifetime or 90 days

Tampa has logged 5 rides in the last 7 days. 6 rides in the prior week. 6 the week before that and 2 the week before that. No more than 5 cars could be spotted in Tampa. There has to be a poisson sampling calculation against the 30 days with error bars and some 7 day approximation. We would need to look at a more active city like Austin and back into the 30 day versus 7 day activity. The less than 10 logged rides per month in each Florida city is nearly useless for identifying any more ten vehicles per month.
How do you propose to solve the zero sampling per month against 2000 rides per week.
What is your analysis of Houston, Tampa, Orlando and Miami. Similar Geofence, similar miles and rides per week ? Big difference in logged rides per month and per week.
@brianwang 6000 miles per week and 2000 rides per week in each of the three florida cities and Houston. 30-45 per city. Lower bound 90. in three florida cities.
Houston has 114 in the registered lookup. Houston expanded geofence and zone to 114.
150 estimate for active vehicles in Houston and three florida cities.
94000 miles in Dallas with 75 recorded cars.
84000 miles per week in Austin had 114 recorded cars.
Dallas has 75 to 108 cars. 567 logged rides in Dallas ever. 930 logged rides in Houston. Houston had more coverage than Dallas. 108 cars on registered lookup. 90-100 active estimate
Austin 450,000 miles in a week. 417 spotted, 719 in the registered lookup. 500-600 plausible. 450 lower bound of active in 7 days.
90 Florida
60 Houston
90 Dallas
450 Austin
690 for all cities.
Low mile cities 10,000 miles per week or less still have both lower miles week per vehicle. 200 miles per week approximate. 6000 miles per week is 30 cars active.
Mid range 100,000 to 500,000 miles per week. Go to 1000 miles per week per active vehicle.
@brianwang This aligns with Waymo.
National / high-level checks
Waymo’s published figures support the conversion method:
~3.90 million rider-only miles per week (Q2 2026 average) across all markets.
~4,000+ vehicles in the fleet (company statements + trackers; Texas alone has ~1,200 registered).Robotaxireport
That implies roughly ~900–1,000 miles per vehicle per week on average — matching the mid-range assumption of ~1,000 miles/week per active vehicle.
500,000+ paid rides per week also works out to a plausible ~100–150 rides per vehicle per week at that fleet size.
@brianwang >"6000 miles per week and 2000 rides per week"
This perhaps seems a low mileage per ride. Can you tell me where this comes from?
I think I saw 5 miles as the average distance per ride but I believe this included Austin, but could certainly believe the rides are shorter in a smaller area, so that 3 mile average trip length may well be correct for a small area. What are your assumptions about distance travelled by the vehicle between rides?
You are advocating ~900–1,000 miles per vehicle week (mpvw)
I don't think this is crazy low but I am putting a range of more like 900 to 1500 mpvw.
I am suggesting 1500 to resolve early but if it is in 900-1500 then we wait for better information and if nothing better comes along then we might use the mid-point of this range which would be around 1200 ish mpvw , though it is quite possible that you can put forward a decent argument for 900 - 1000 mpvw.
Dallas did 95k miles and you are suggesting 90 as a best estimate so that seems like it is suggesting 1050 mpvw.
Houston Tampa Orlando Miami did 7k 6k 6k 6k miles. All very similar as you said. If cars elsewhere are doing 900+ mpvw why do you think there are so many more than 8ish vehicles actively operating? Yes I do see Houston shows 43 tracked vehicles and Tampa shows 25 tracked vehicles. What evidence is there that these are actively in use?
AIUI just because a vehicle is shown as tracked doesn't mean it has had a logged ride as some tracked vehicles have not been matched to licence plates. If you have better info on whether tracked vehicles have actually entered service that might help persuade me.
Otherwise it seems quite easy for Tesla to put vehicles there then find there isn't the demand to keep that many vehicles operating. The "In service" number is tracked vehicles less those that are both removed from Texas register *and* not spotted for 30 days.
This suggests to me this "In service" number is overstated in a few ways, eg
* Some could be listed as tracked but not brought into use.
* Some used some weeks but not others are counted as in service every week
* Vehicles removed from the register remain within this "In service" number for up to 30 days after removal from register.
@ChristopherRandles the crowdsourcing has fares and mileage recording. Again the low sampled areas are likely off. Dallas and Houston are 2.2 miles and 0.9 miles average. 3.6 miles and even 4 miles for florida even though the geofence is like 5 miles X 5 miles. All Tesla is 3.4 miles.
Why more than 8. Because Houston counted 16 in seen in the last 7 days despite low logging.
Waymo is 900 to 1000 miles per week.WHY should Tesla have a higher bar ?
I do see Houston shows 43 tracked vehicles and Tampa shows 25 tracked vehicles. What evidence is there that these are actively in use? Miami has no measurement. All Miami vehicle count is garbage. It is more logical that the small zones 5X5 miles and early fleet are running short 1-2 mile trips and they need more vehicles with less intensive usage. Houston and Tampa of the 2 cities of that class have more measurement. 5 times more data in Houston. Houston is the more measured location. It is closer to ground truth.
16 vehicles spotted in the last week in Houston and 16 spotted in Dallas. Minimum active vehicles is 16, this would apply to more active in miles cities. I willl observe the number of logged rides for the next few days currently at 992 logged over 90 days 3pm today. The Houston ride data shows strong heterogeneity (not equal Poisson rates), so simple occupancy estimates understate the true active fleet—especially with new cars being added. The early miles surges reinforce that community tracking lagged the real fleet. Under equal rates, seeing so many singletons while a few cars dominate is improbable. The distribution is overdispersed (closer to negative binomial, power-law, or a mixture of high- and low-activity cars)
Late June 2026 shows only 11 unsupervised cars ever in service while driverless miles were already rising (13k that week, +92%). Later weekly miles reached the 17k–25k range the user notes. Likely 30-50 cars.
At those mile volumes, even with short Houston trips, dozens of vehicles are typically required if utilization is realistic.
Lumpiness and new car introductions can easily have the 16 observed cars in the week indicate a sampling of 30-37 active vehicles. If the mileage is spiking and cars are being added we might not detect it for weeks.
Tesla community-logged rides (last 90 days): roughly 3,140–3,190 total.
Approximate city breakdown (last 90 days):
Austin: ~1,607–1,643. (100 to 150 per week)
Houston: ~793–802 (9 per day, 63 per week) But it is unequal, indications of only 25-40 rides in the most recent week were logged.
Dallas: ~393–394 (4.5 per day, 30 per week)
Tampa: 124. (1.3 per day, 9 per week)
Orlando: 15. (1 per week)
Miami: 4. (0 per week)
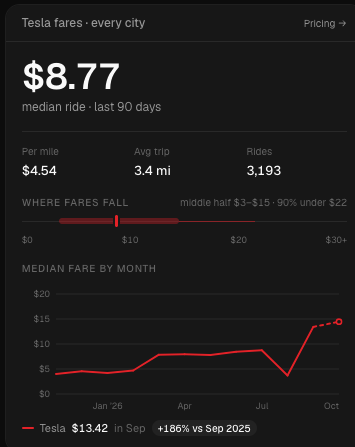
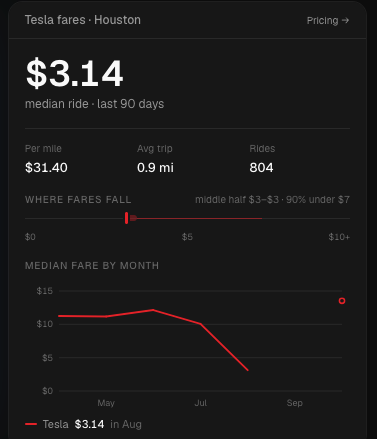
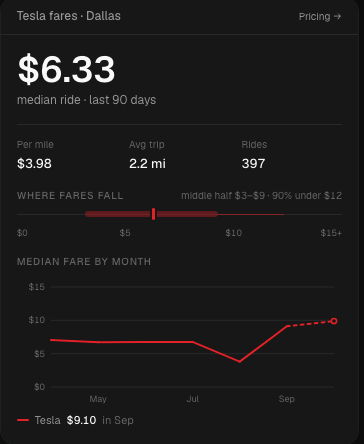
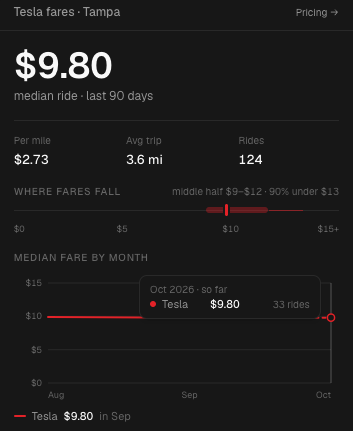
@brianwang >"Waymo is 900 to 1000 miles per week. WHY should Tesla have a higher bar ?"
The tracker page says Waymo did 50.7M *rider miles* in a quarter which is 13 weeks. If 4000 vehicles is accurate this is 975 rider miles per vehicle week. However Tesla is showing driverless miles not rider miles. I would expect driving to next customer after a ride has finished and any beginning and end of day mileage could add to rider miles anywhere from 50% to 150% to get driverless miles.
So I am not sure I can narrow it down to a smaller range than Waymo vehicles doing 1500-2500 driverless mpvw. 2500 sounds too high to me so probably 50%-100% addition is more likely than over 100%. What was your source for 900-1000 again?
Edit it was 3067 vehicles for nearly half the quarter before jumping up to 3800 then 3871 for the last 2 weeks of the quarter, so that further increases Waymo's mpvw.
@brianwang I have found the tracker site saying for Waymo under
CPUC driverless deployment · California
that empty miles are 41% to 45%.
Not completely sure but would guess this 41% to 45% is of the total miles so taking 43%, the rider only miles would have to be grossed up to 100 / 57 or a 75% increase on the rider only miles.
975 *1.75 = ~1700 mpvw for Waymo.

Rider only miles driven .. includes the miles without the passenger. Rider only miles are miles without a driver. Grossing it up is double counting. There is possible changes in vehicles Q1, Q2, Q3. Can try to watch the miles per vehicle with more reports. I think now they are saying 4000+. AI agrees that waymo rider only miles includes empty miles already.
Tesla’s Q3 update gives Austin service hours of 6 a.m.–midnight: 18 hours daily. Tesla likely does less miles per vehicle per week.
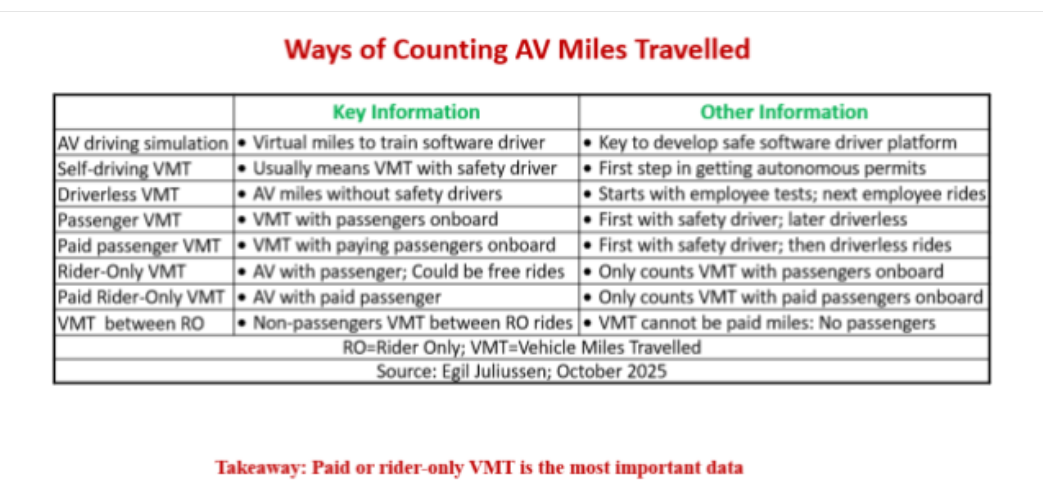
@ChristopherRandles I think the same metric for waymo rider only miles is the same as Tesla unsupervised miles. Neither includes repositioning dead head miles. Both need a car for each 1000 miles per week.
@brianwang So why does the tracker site use "driverless VMT" for Tesla and "Rider-only" for Waymo?
I am not completely sure of my interpretation, but your "I think" doesn't really provide much evidence for an independent moderator to assess. Early resolution needs a high level of certainty.