Details of data is currently at https://data.giss.nasa.gov/gistemp/
with a txt file with the data at data.giss.nasa.gov/gistemp/tabledata_v4/GLB.Ts+dSST.txt
(or such updated location or updated version for this Gistemp v4 LOTI data)
For this annual market, it is the J-D column for 2026 when that is shown after Dec 2026 data has been published.
More options can be added but please keep these sensible.
January 2024 might show as 124 in hundredths of a degree C, this is +1.24C above the 1951-1980 base period. If it shows as 1.22 then it is in degrees i.e. 1.22C. Same logic/interpretation as this will be applied.
If the version or base period changes then I will consult with traders over what is best way for any such change to have least effect on betting positions or consider N/A if it is unclear what the sensible least effect resolution should be.
Numbers expected to be displayed to hundredth of a degree. The extra digit used here is to ensure understanding that a display of +1.35C causes the 1.345C or more option to resolve yes.
Resolves per first update seen by me or posted as long, as there is no reason to think data shown is significantly in error. If there is reason to think there may be an error then resolution will be delayed at least 24 hours. Minor later update should not cause a need to re-resolve.
I also do monthly markets like
August 2026 Global Average Temperature August 2026 per LOTI v4 vs 1951-1980 base period (NASA Gistemp)
September 2026 Global Average Temperature Sept 2026 per LOTI v4 vs 1951-1980 base period (NASA Gistemp)
 1,000
People are also trading
(Dating this forecast for 2026-10-10 since its based off old 2t run data through 06Z on Oct. 10)
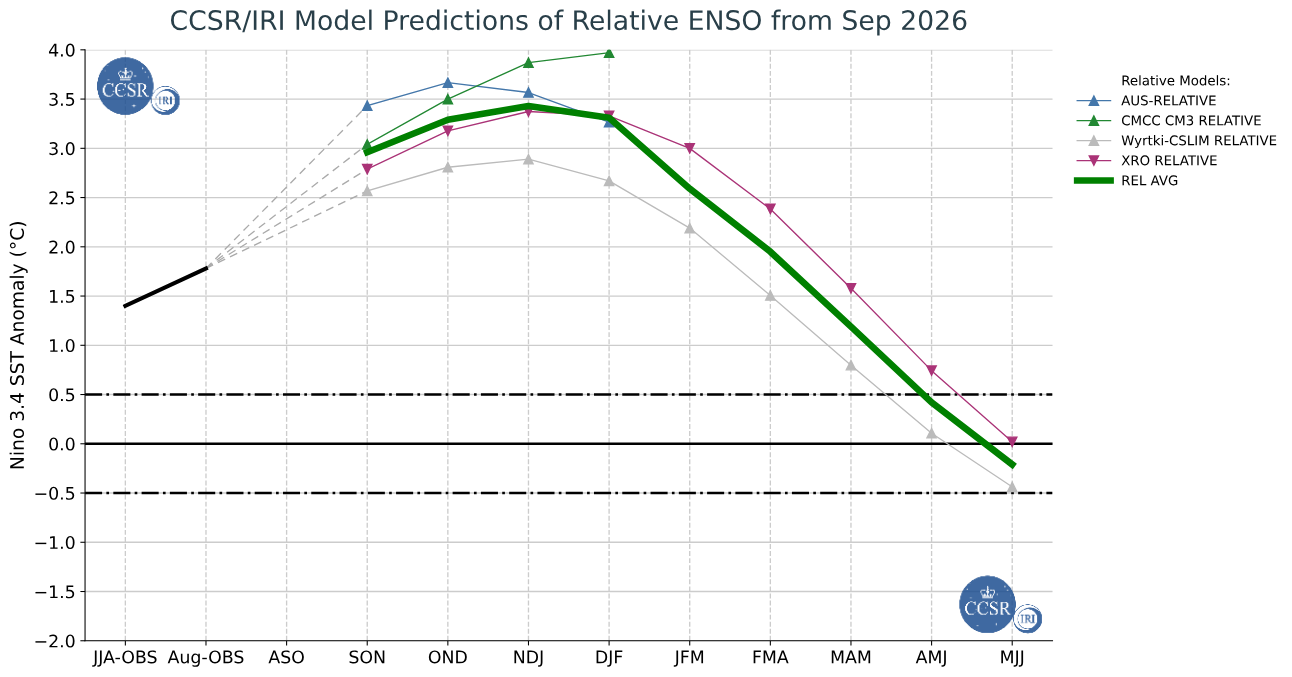
Based on some vibe coding and my usual 2t notebook forecasts data for the lead month along with using daily sst climo+forecasts (roni) for analogues+persistence, assuming ERSSTv5 for GISTEMP) I get for center point predictions for Oct, Nov. Dec: 1.40, 1.43, 1.41. This seems plausible enough since the 3 month RONI forecasts (IRI) show El Nino peaking in December.
This leaves a center point prediction of 1.28 C for the LOTI 1951-1980 anomaly annual mean.
This is close to 2024's value, but marginally lower (-0.002). Because its far away from the lowest available bin, I've added a closer bin a bit lower nearrer my current forecast.
Assuming even large 2t climo variances (of ~ 0.02 and 0.03 for Nov, Dec, with the normal calibrated variance for Oct currently at 0.007)), I don't get beyond 23% for the exceedance of bin
"1.295 degrees Celsius or more".
As usual, given that the center point prediction is liable to move, I have hopefully bet conservatively enough this time.
I did some further robustness checks using some simple statistical reasoning (as well as comparing ERSSTv5 and ERSSTv6 versions as well with it since that is a possibility, which in that case only made the values lower in v6).
There is also (unaccounted for) the (small) chance that past months values (especially the most recent month) will be significantly revised up or downard which makes it a bit tricky to judge precisely.
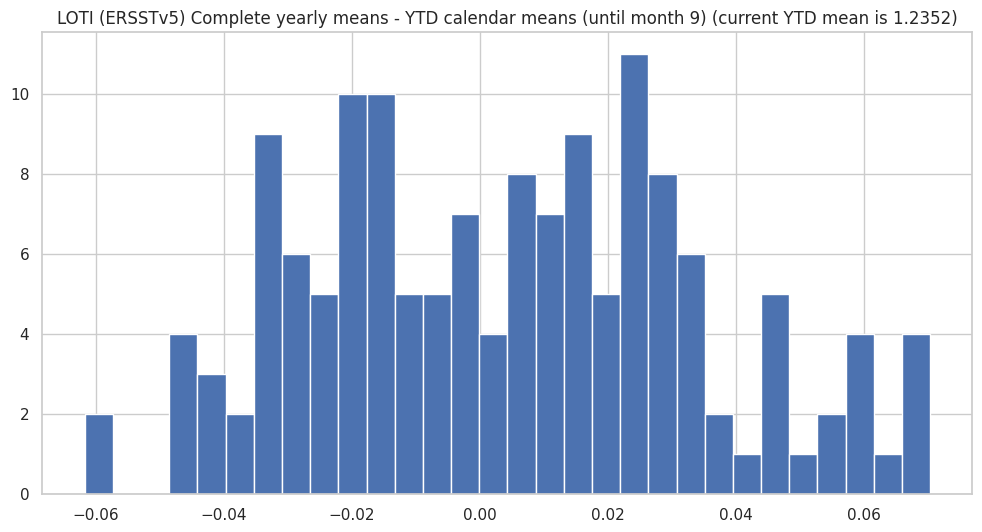
Comparing the annual LOTI averages for the calendar months YTD against their annual means gives a fairly robust insight into how likely some of those much higher bins are (given 146 samples).
Given that the LOTI YTD is 1.2352 and that the difference between the yearly means and their YTD means (i.e. up to and including month 9), this difference has never exceeded 0.08.
This leaves values above 1.315 out of distribution and low likelihood (< 10% is an extremely conservative upperbound for the 1.315 bin, but not profitable to move further)
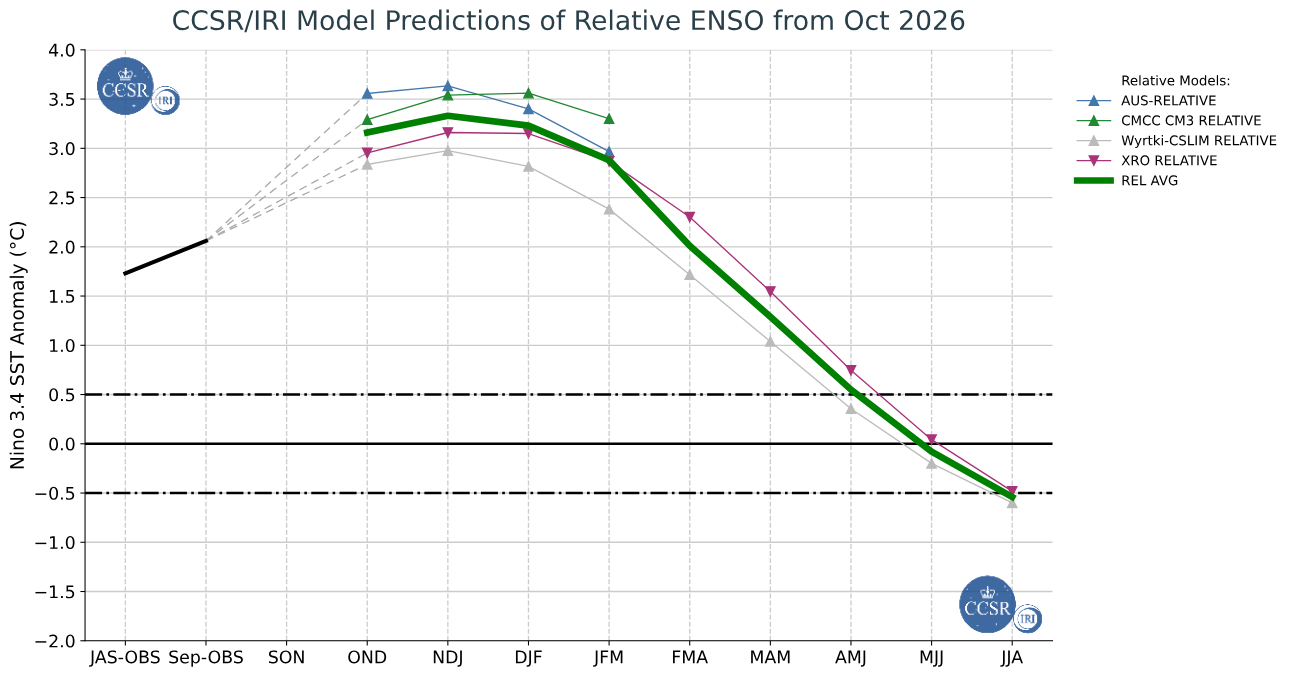
In the last several days EC46 SST forecasts for daily RONI have trended to become more flat for november (with a mild increase halfway through); this is partly from the NINO3 anomaly itself flattening (NINO4 still looks to warm up).
The latest dynamical seasonal models and RONI from IRI also show a slightly lower value for November and a lower peak for December now:
On top of the October value itself trending slightly lower from the usual from the medium range and ERA5 data when evaluated through the ERA5 -> LOTI three model ensemble I usually reference for the LOTI markets, I get center point predictions for LOTI as of today (Oct. 20) of:
Oct: 1.39
Nov: 1.41
Dec: 1.38
The Oct. and Nov. values are about 0.01 C lower than 9 days ago, but the December value from the model is ~ 0.03 C lower.
This puts the annual value right at the bin edge, at 1.275 C.
Edit:
I mentioned before that most of the NINO34 anomaly looks to come from NINO4 as NINO 3 is mostly flat...
ECMWF's seasonal plumes (from Oct. 5 forecast) for NINO4 anomalies show a steep increase over October and increasing further in November...
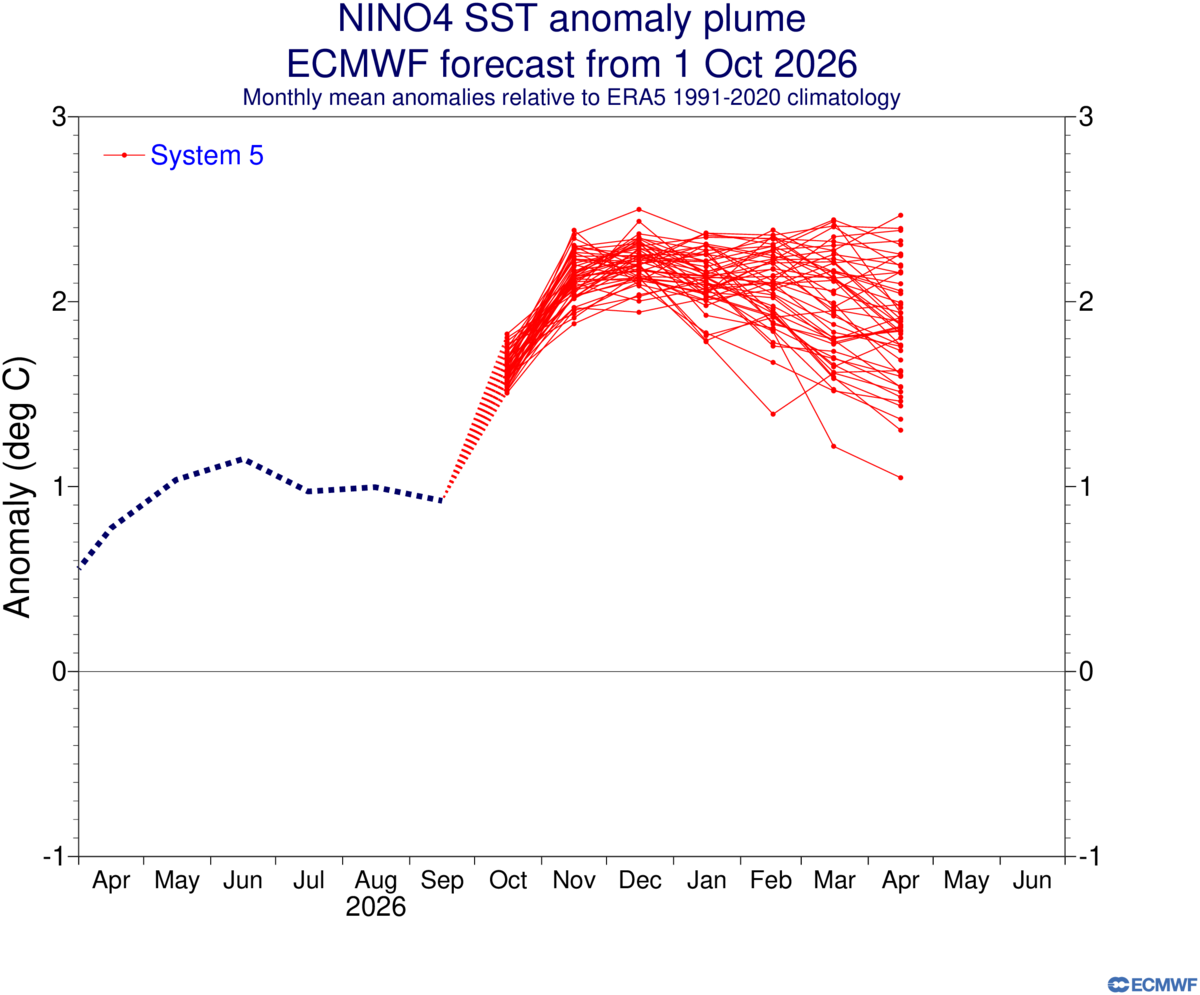
Although my own daily plot for Oct (EC46 onwards after ERA5) shows an increasing trend (an increase of +1C) starting from mid Oct. towards mid Nov., the mean for Oct. looks to be lower than the low end of the distribution above, and the fact that the validation for EC46 has been poor itself against ERA5 suggests a lower NINO4 anomaly then forecast if recent validation trends continue.
Own daily plots:
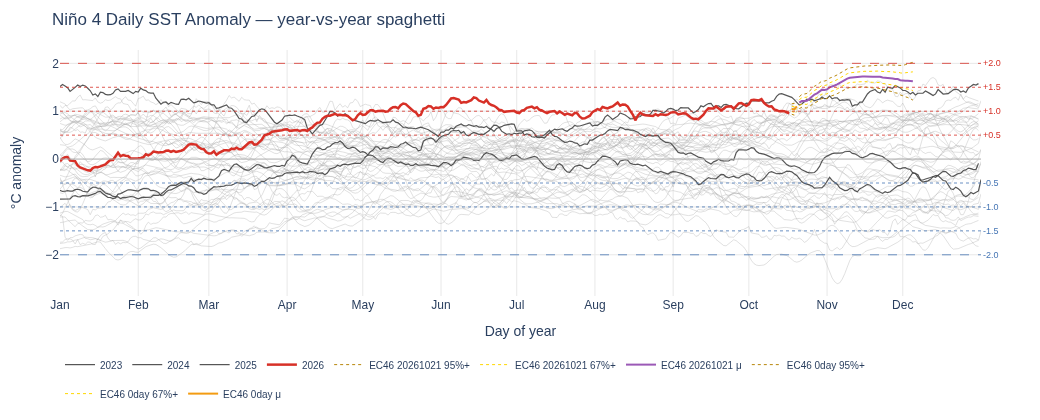
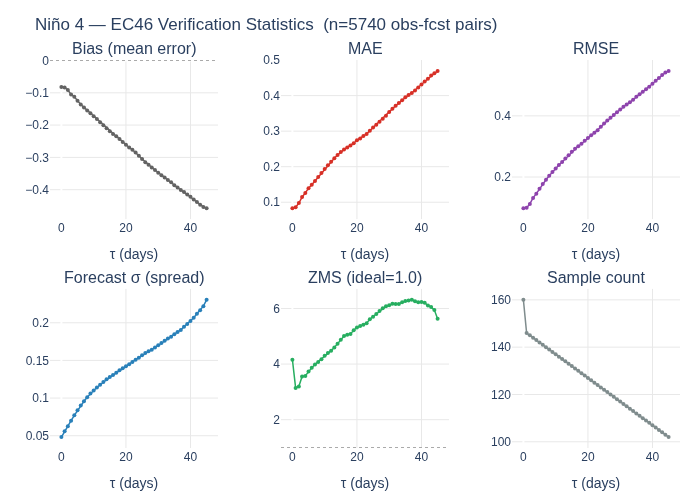
Where red = (EMOS reforecast calibrated) EC46 forecasts were far too warm relative to ERA5:
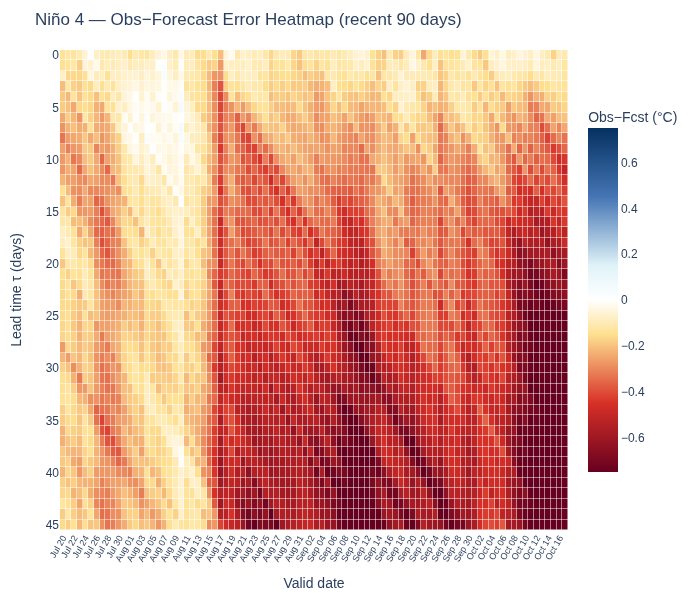
(Last couple months have been especially poor for NINO4 forecasts).