Data is currently at
csv file
or
(or such updated location or updated version for this Gistemp v4 LOTI data see
data.giss.nasa.gov/gistemp/tabledata_v4/GLB.Ts+dSST.txt )
January 2024 might show as 124 in hundredths of a degree C, this is +1.24C above the 1951-1980 base period. If it shows as 1.22 then it is in degrees i.e. 1.22C. Same logic/interpretation as this will be applied.
If the version or base period changes then I will consult with traders over what is best way for any such change to have least effect on betting positions or consider N/A if it is unclear what the sensible least effect resolution should be.
Numbers expected to be displayed to hundredth of a degree. The extra digit used here is to ensure understanding that +1.20C resolves to an exceed 1.195C option.
Resolves per first update seen by me or posted as long, as there is no reason to think data shown is significantly in error. If there is reason to think there may be an error then resolution will be delayed at least 24 hours. Minor later update should not cause a need to re-resolve.
I do other similar markets
Annual 2026 https://manifold.markets/ChristopherRandles/global-average-temperature-2026-per-28LyRdCc55
 1,000
1,000People are also trading
ghcnm.v4.0.1.20261004:
131.6597
~
I haven't been able to update much so I left it too late to update...
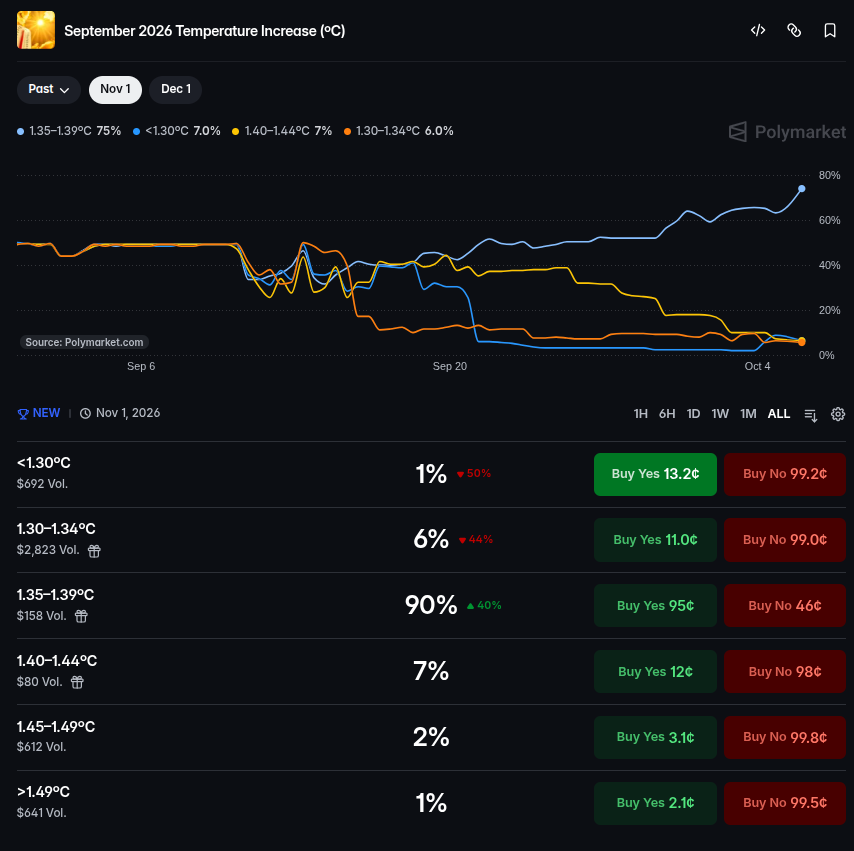
For reference polymarket is more certain than I am at the moment of 1.35-1.39...
too long a thread so I split it into 2 posts
1/2
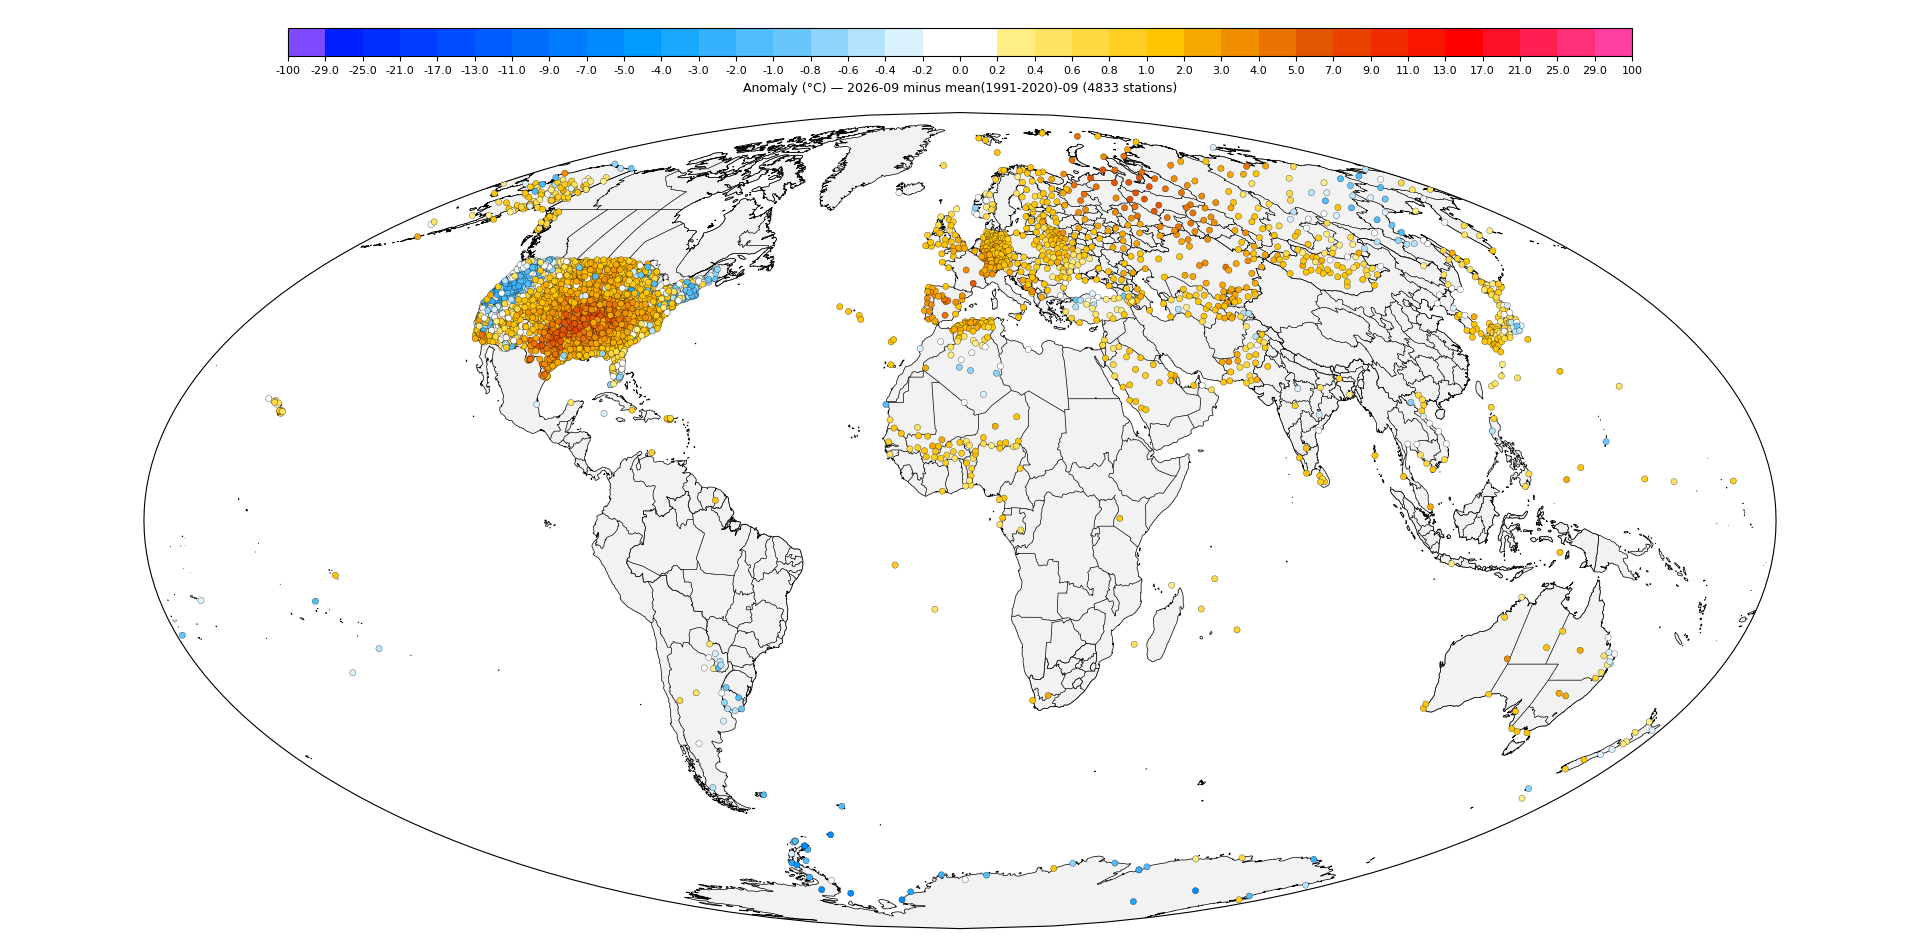
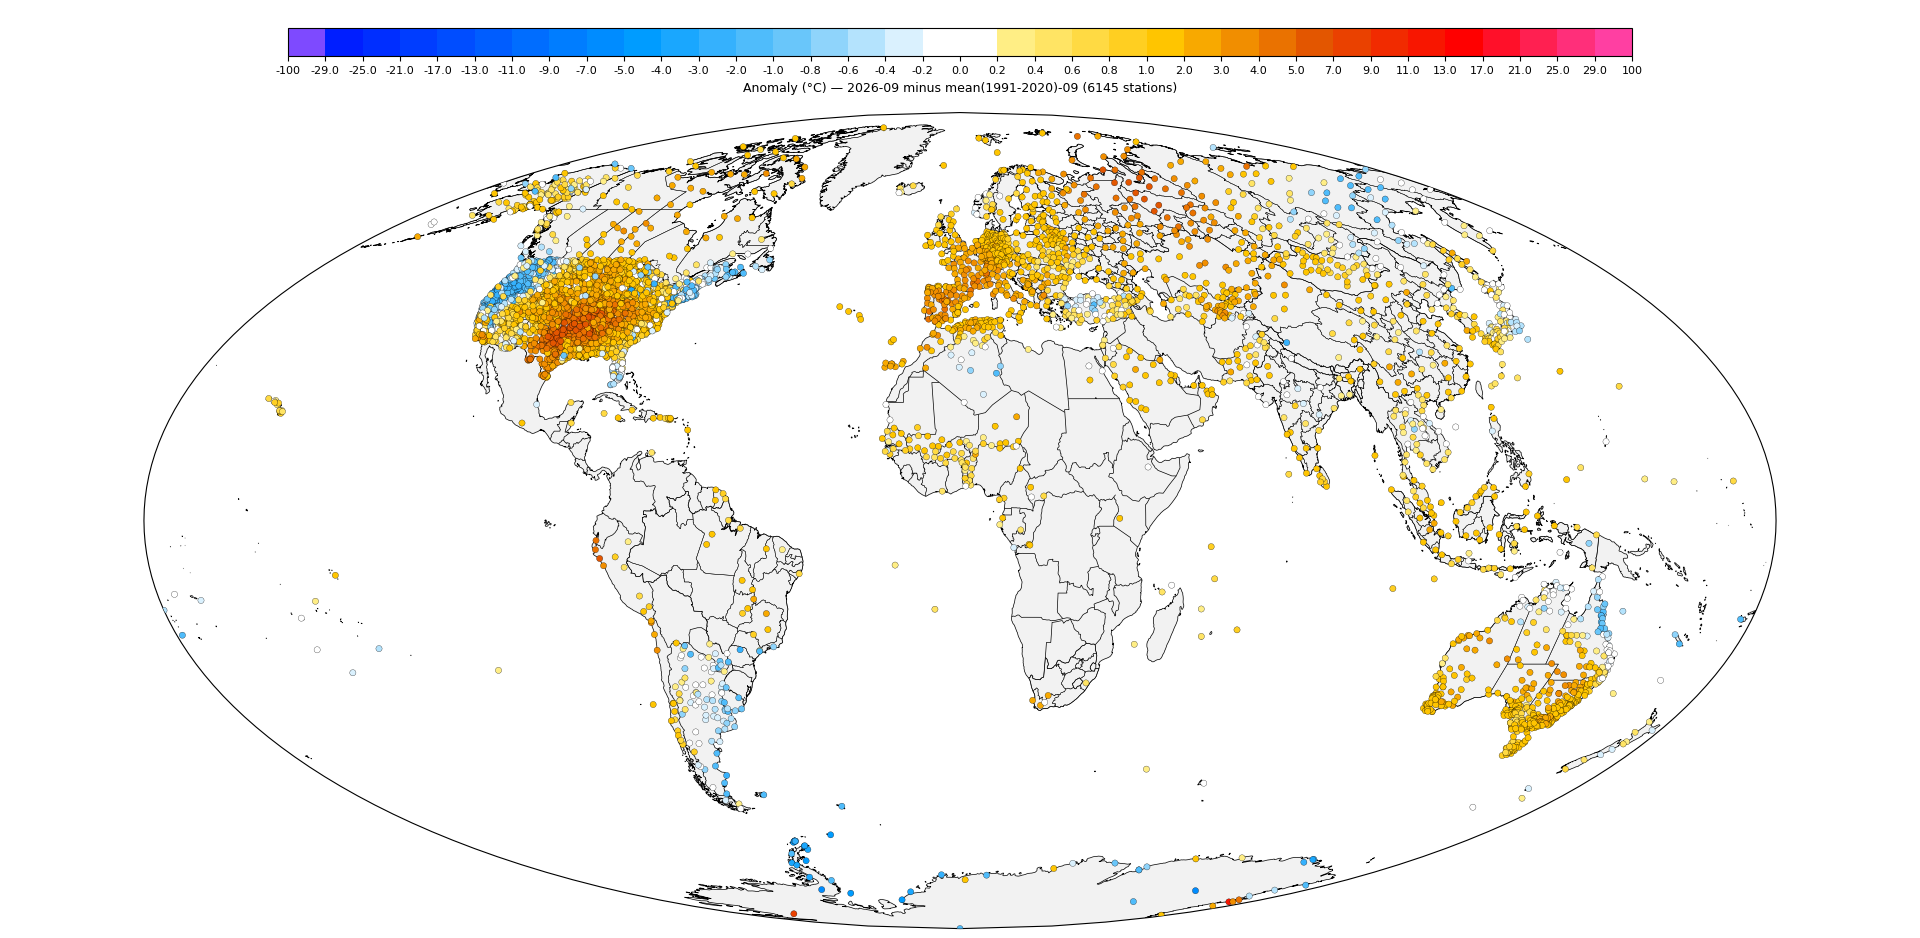
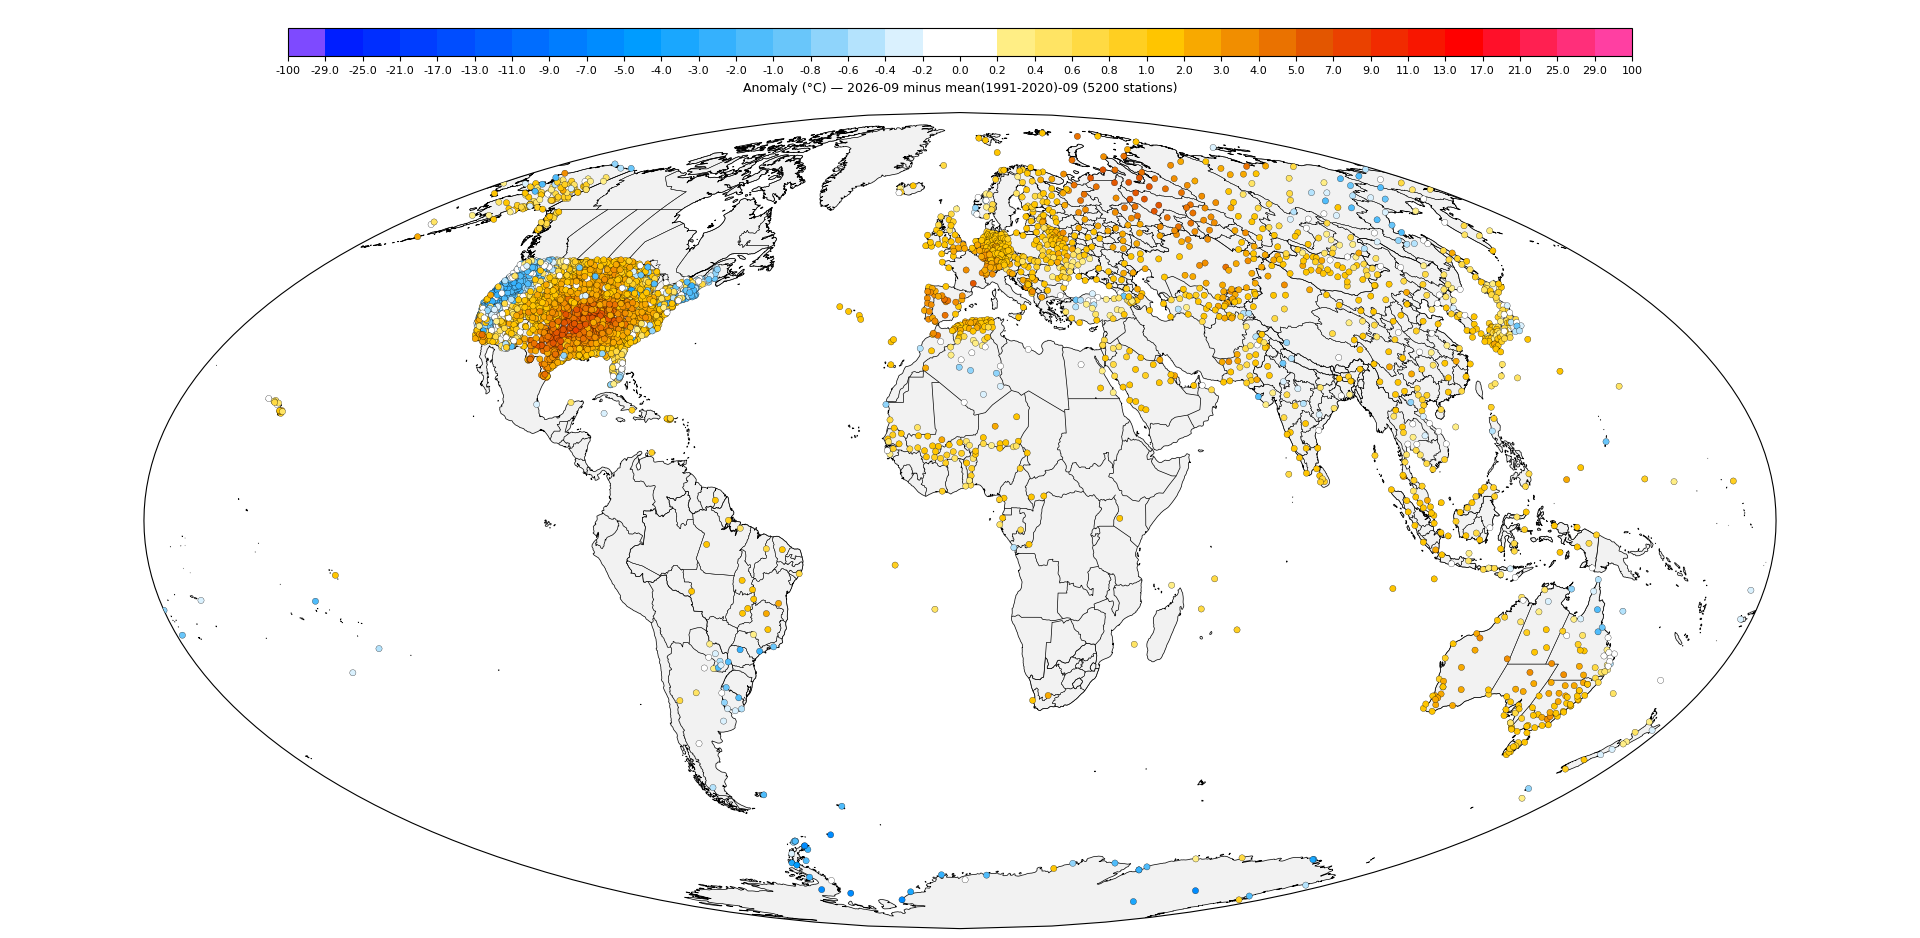
GHCNm Station Plot (stations included in last run):
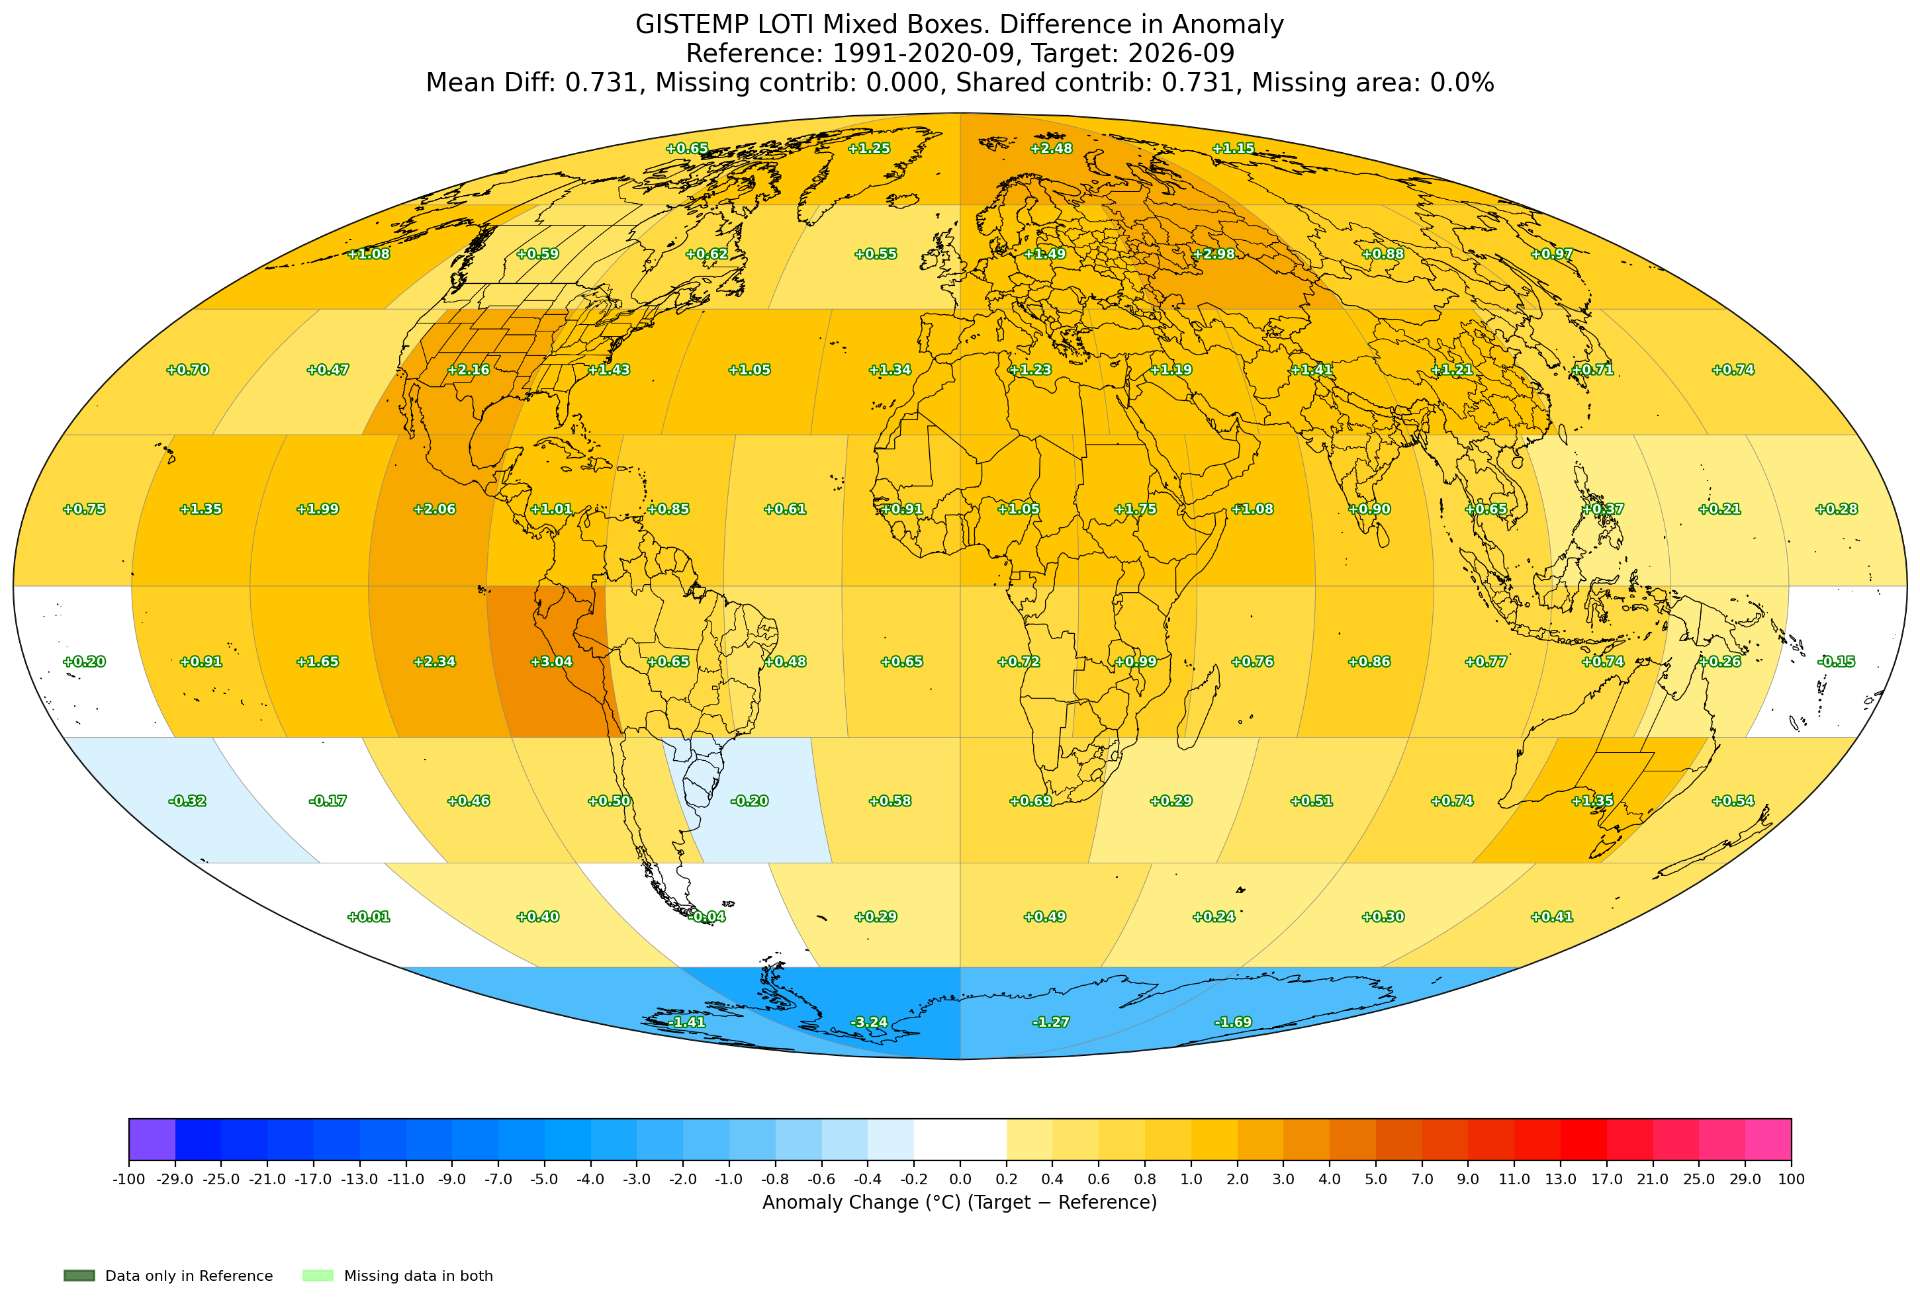
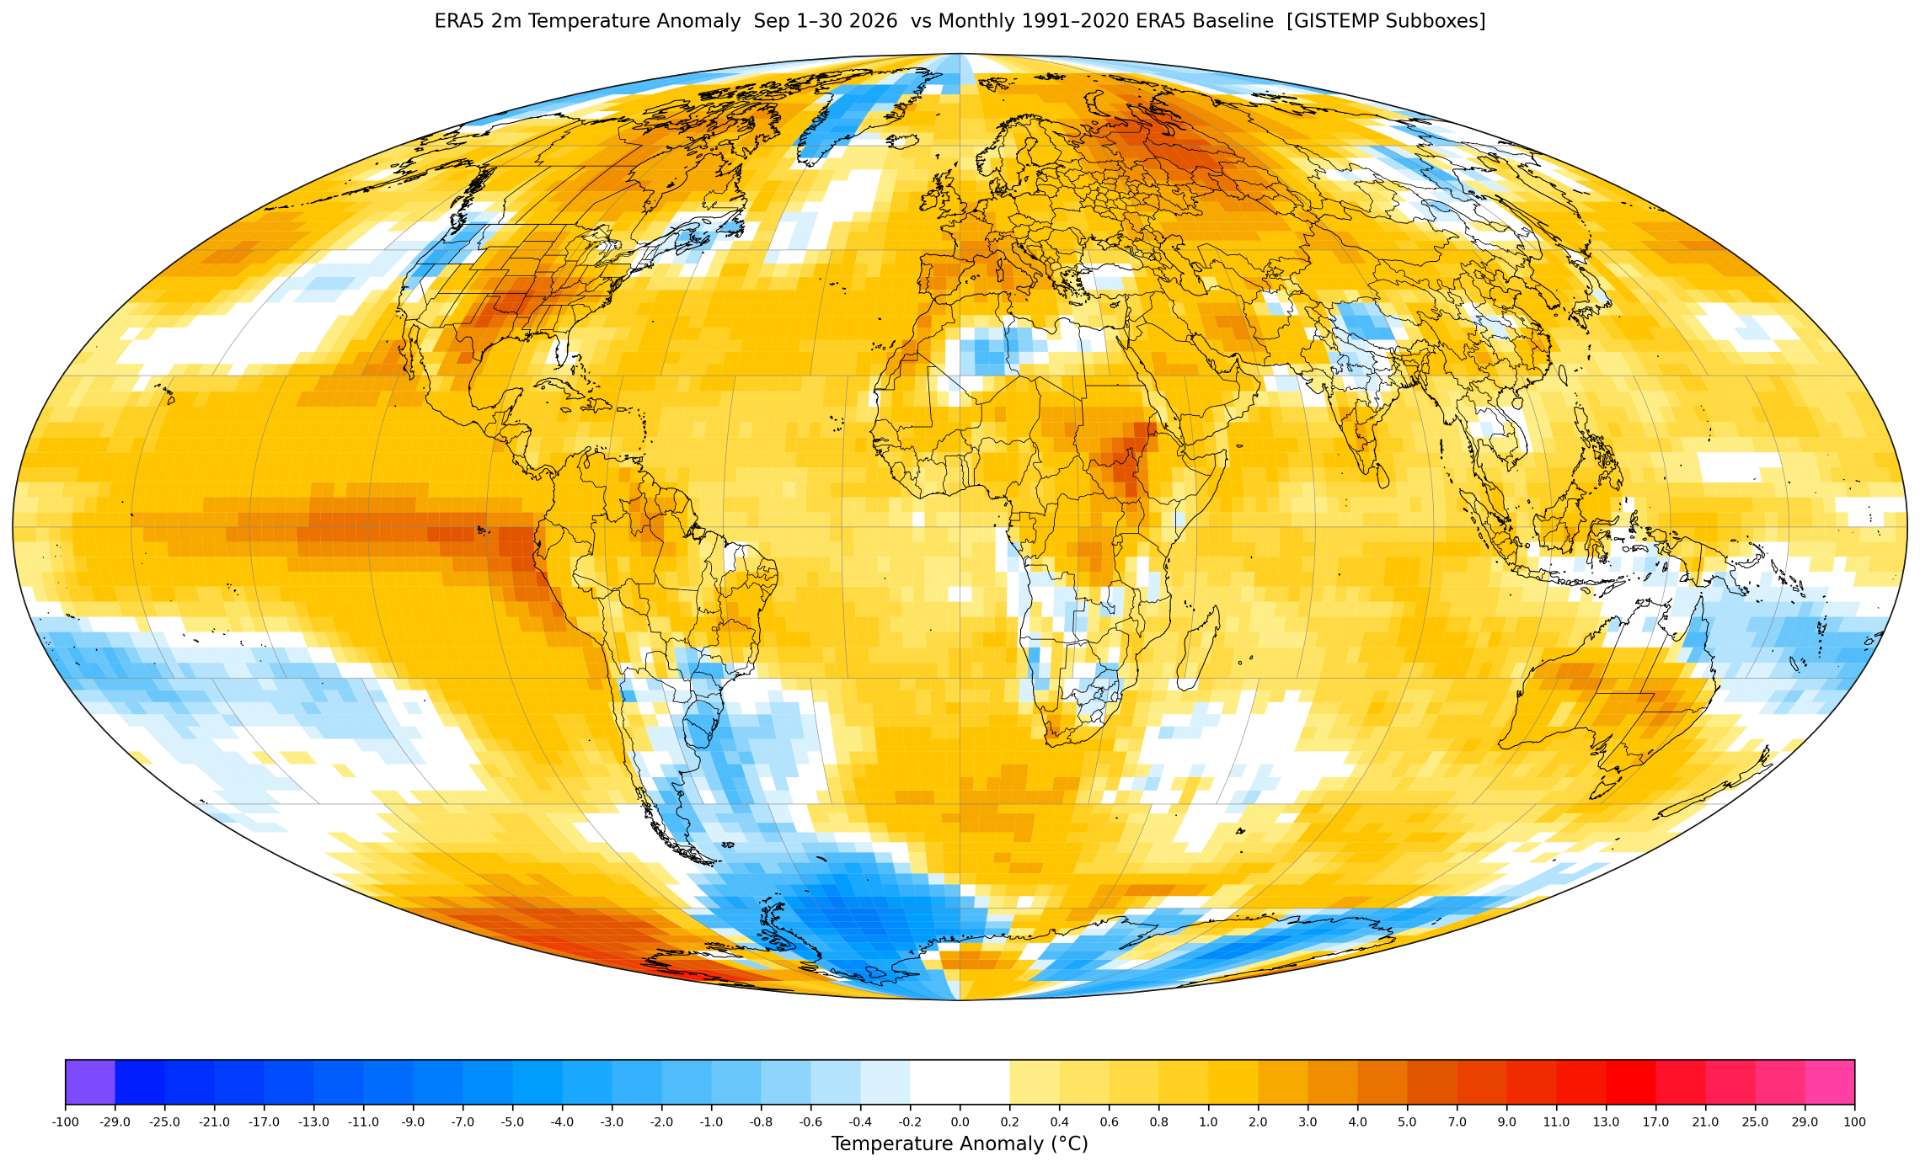
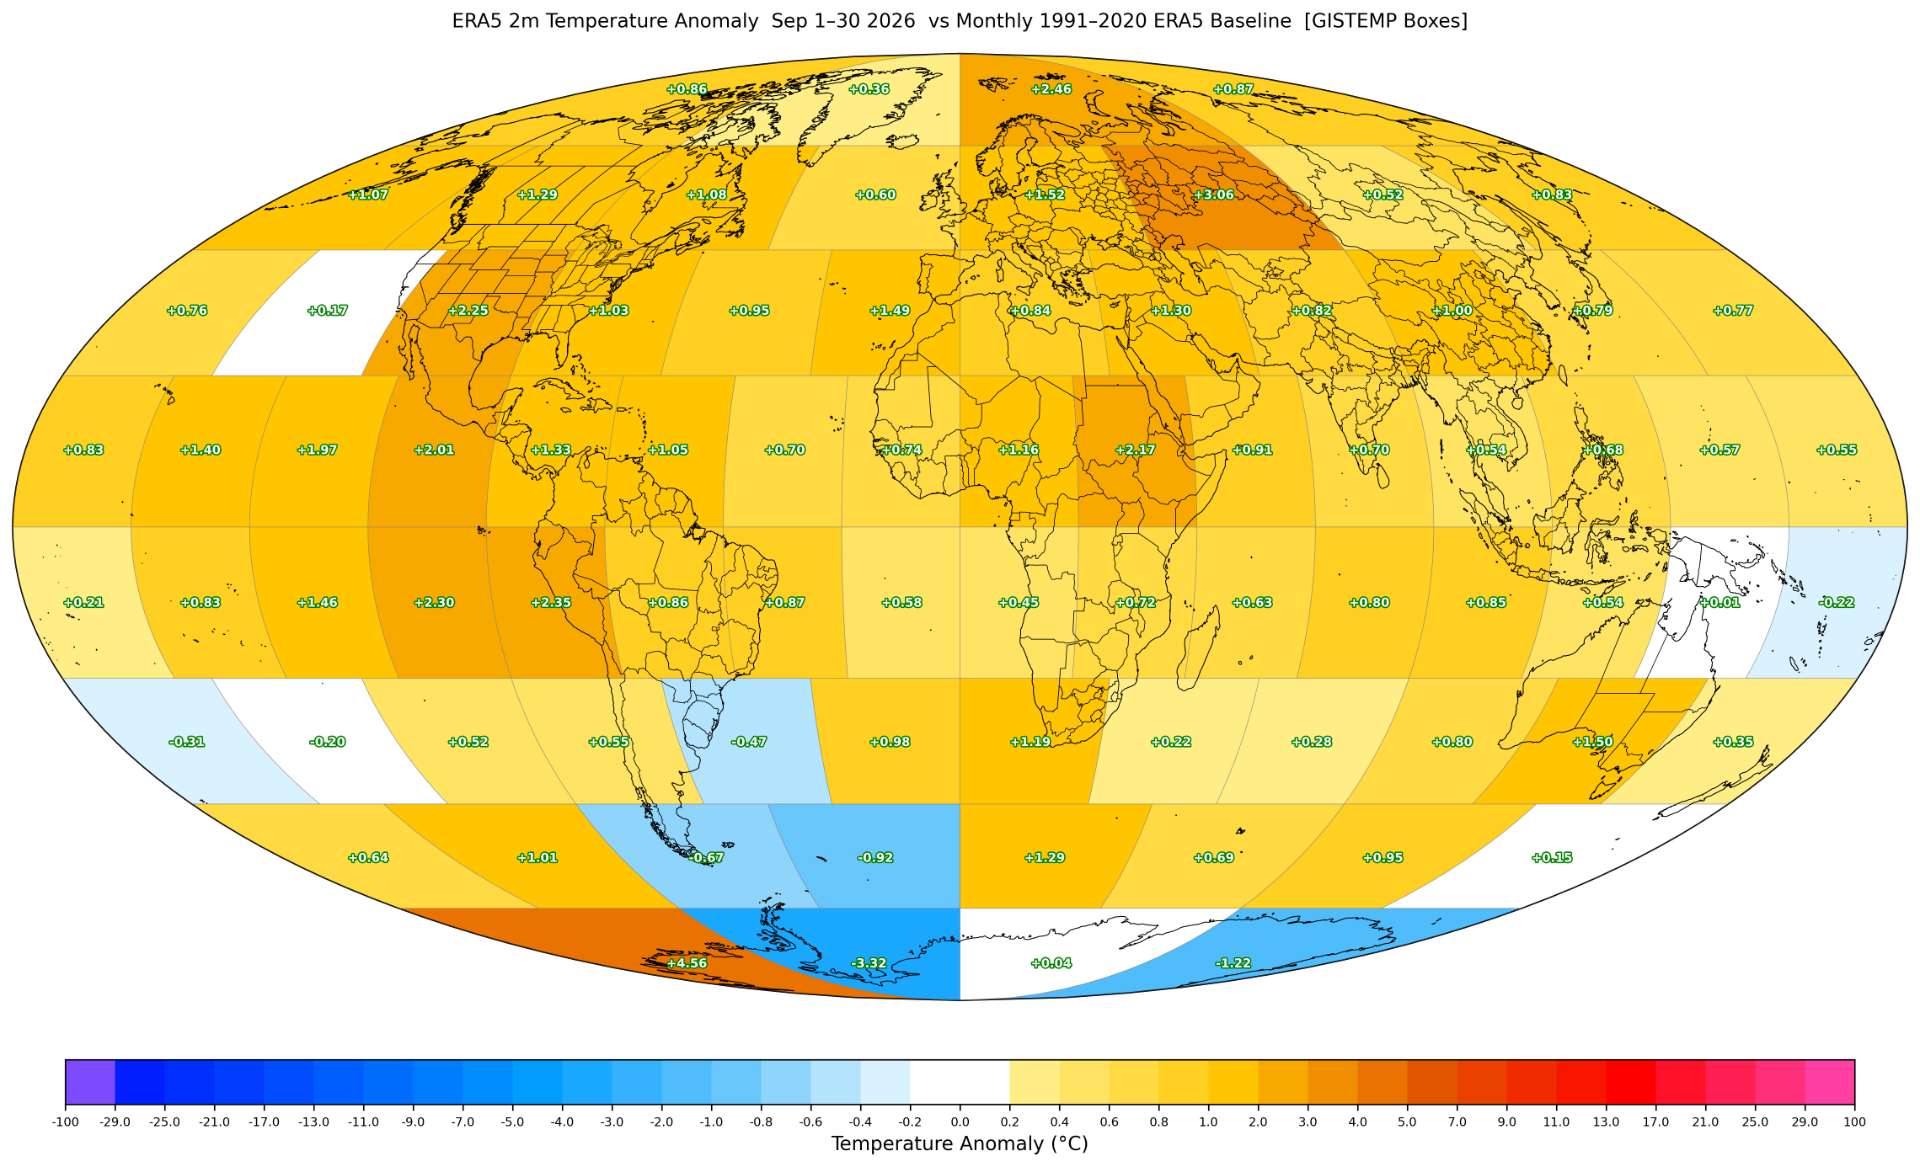
GISTEMP Plots:
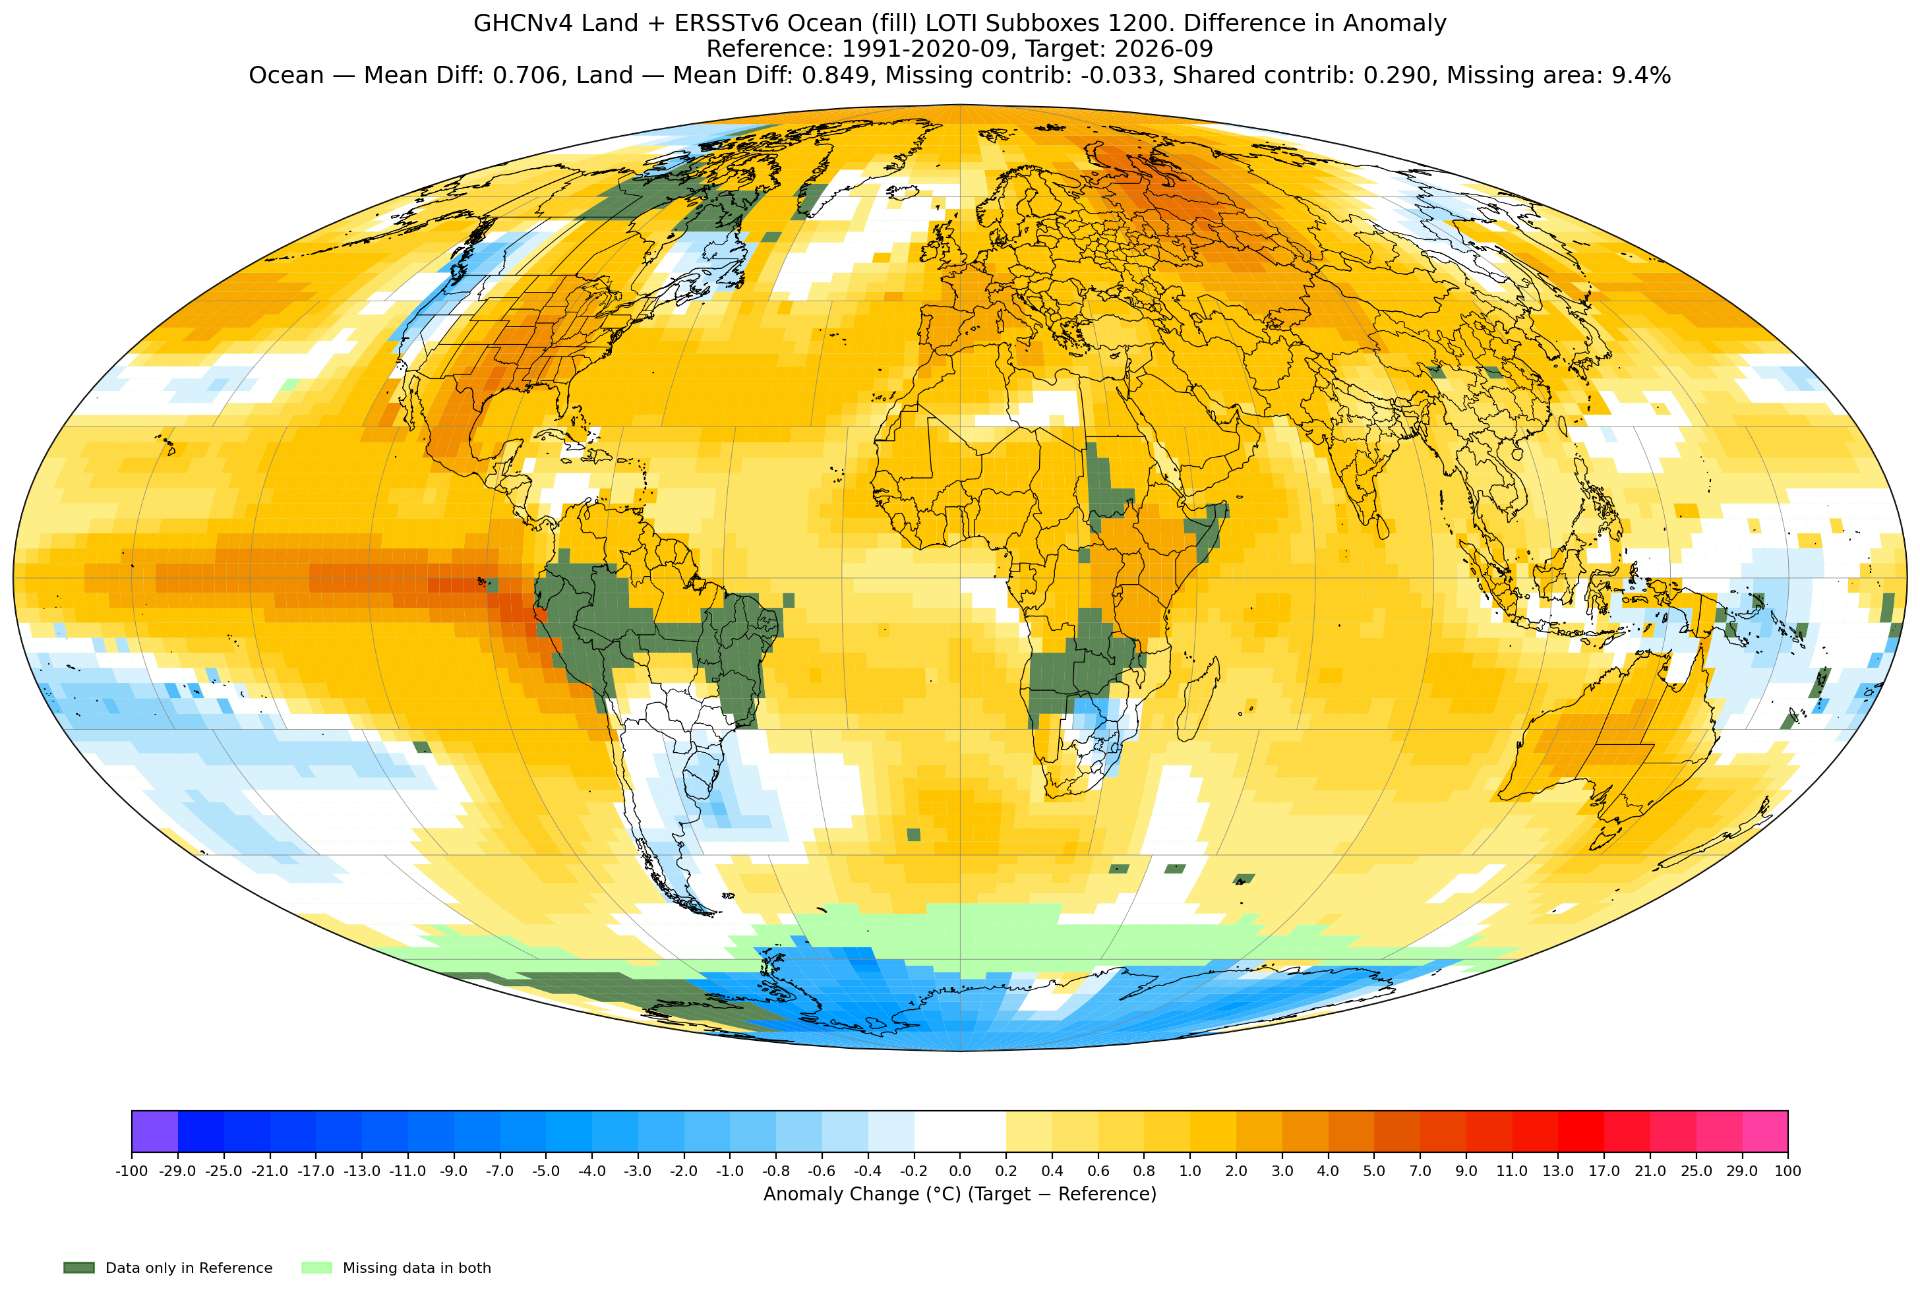
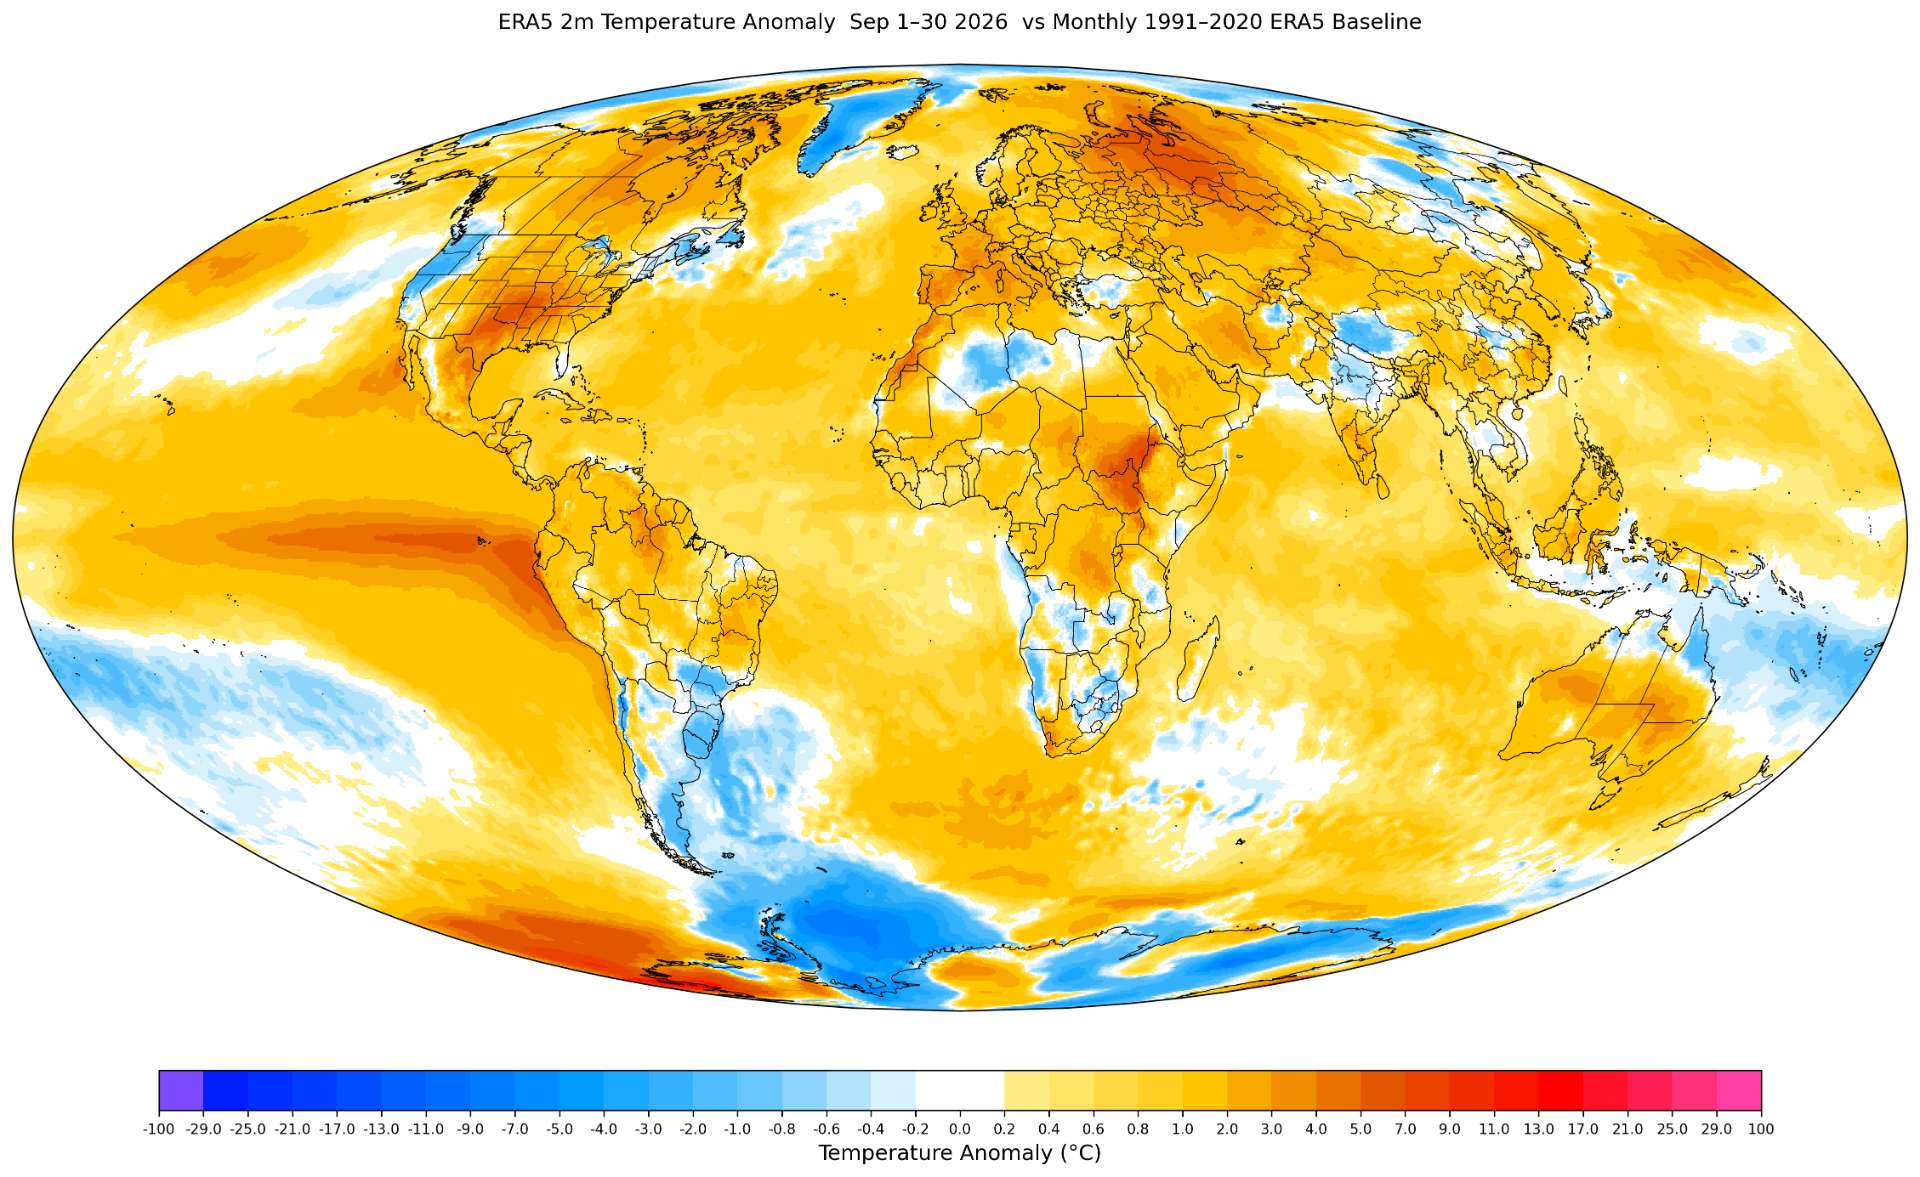
and final ERA5 plots:
~
TLDR; Minna Bluff inclusion is an unknown still, while I am expecting Elizabeth to be included still (although it may be significantly homogenized downards by ghcnm), and still a question of whether the Greenland stations will be included this month as they weren't last month (this would cause some cooling if they are included).
The analysis below means there is much more uncertainty towards temps lower than these last two ghcnm predictions. As such I've increased my bets in the lower bin (1.30-1.35) as there is a chance it will be close -- otherwise I would have assigned ~3% from my normal combination of three weighted ERA5->GISTEMP 2t models. It's difficult to quantify it but I updated anchoring to a subjective prediction of 1.356 C (half way between the two runs).
Given that ghcnm has usually let things slide (given its biweight stddev checking scheme and Minna Bluff's history of being problematic as such means I'm expecting it will be kept in ghcnm even though it should be excluded). I don't know whether NASA will exclude it though (they didn't previous months), so that is a large prior that it will be kept but it looks really bad in terms of station anomaly this month so I'm giving it 50/50 after all of it being added to the strange list if its not included.
The release is on Friday so they will likely do the run Wednesday or Thursday so there is still ample time for ghcnm to process Elizabeth and other CLIMAT data (although it sometimes gets delayed for some reason).
~
First, the regular three models from an earlier run (before ERA5 came all in (so its missing the last day of ERA5 data for the latter two models):
Point estimate (old, delta2 method, loti3 method) adjusted by prediction error mean: 1.3522, 1.3902 1.3943
Point estimate (mix), pre-adjusted by member prediction error mean: 1.3837
And now the station prediction (synthetic ghcnm data) run with GISTEMP:
I had to run the station ghcnm predictions twice (second without MinnaBluff to see what the effect was, and it dropped it -0.007 C)
With MinnaBluff (CLIMAT):
135.983
Without MinnaBluff (CLIMAT):
135.277
This is much closer to the old method's ERA5 2t value and significantly lower than the best prior guess of 1.3837 C from the three models weighted.
~
The plots below and analysis reference the first run (with MinnaBluff from CLIMAT) while waiting for the second run and is based on the first station prediction.
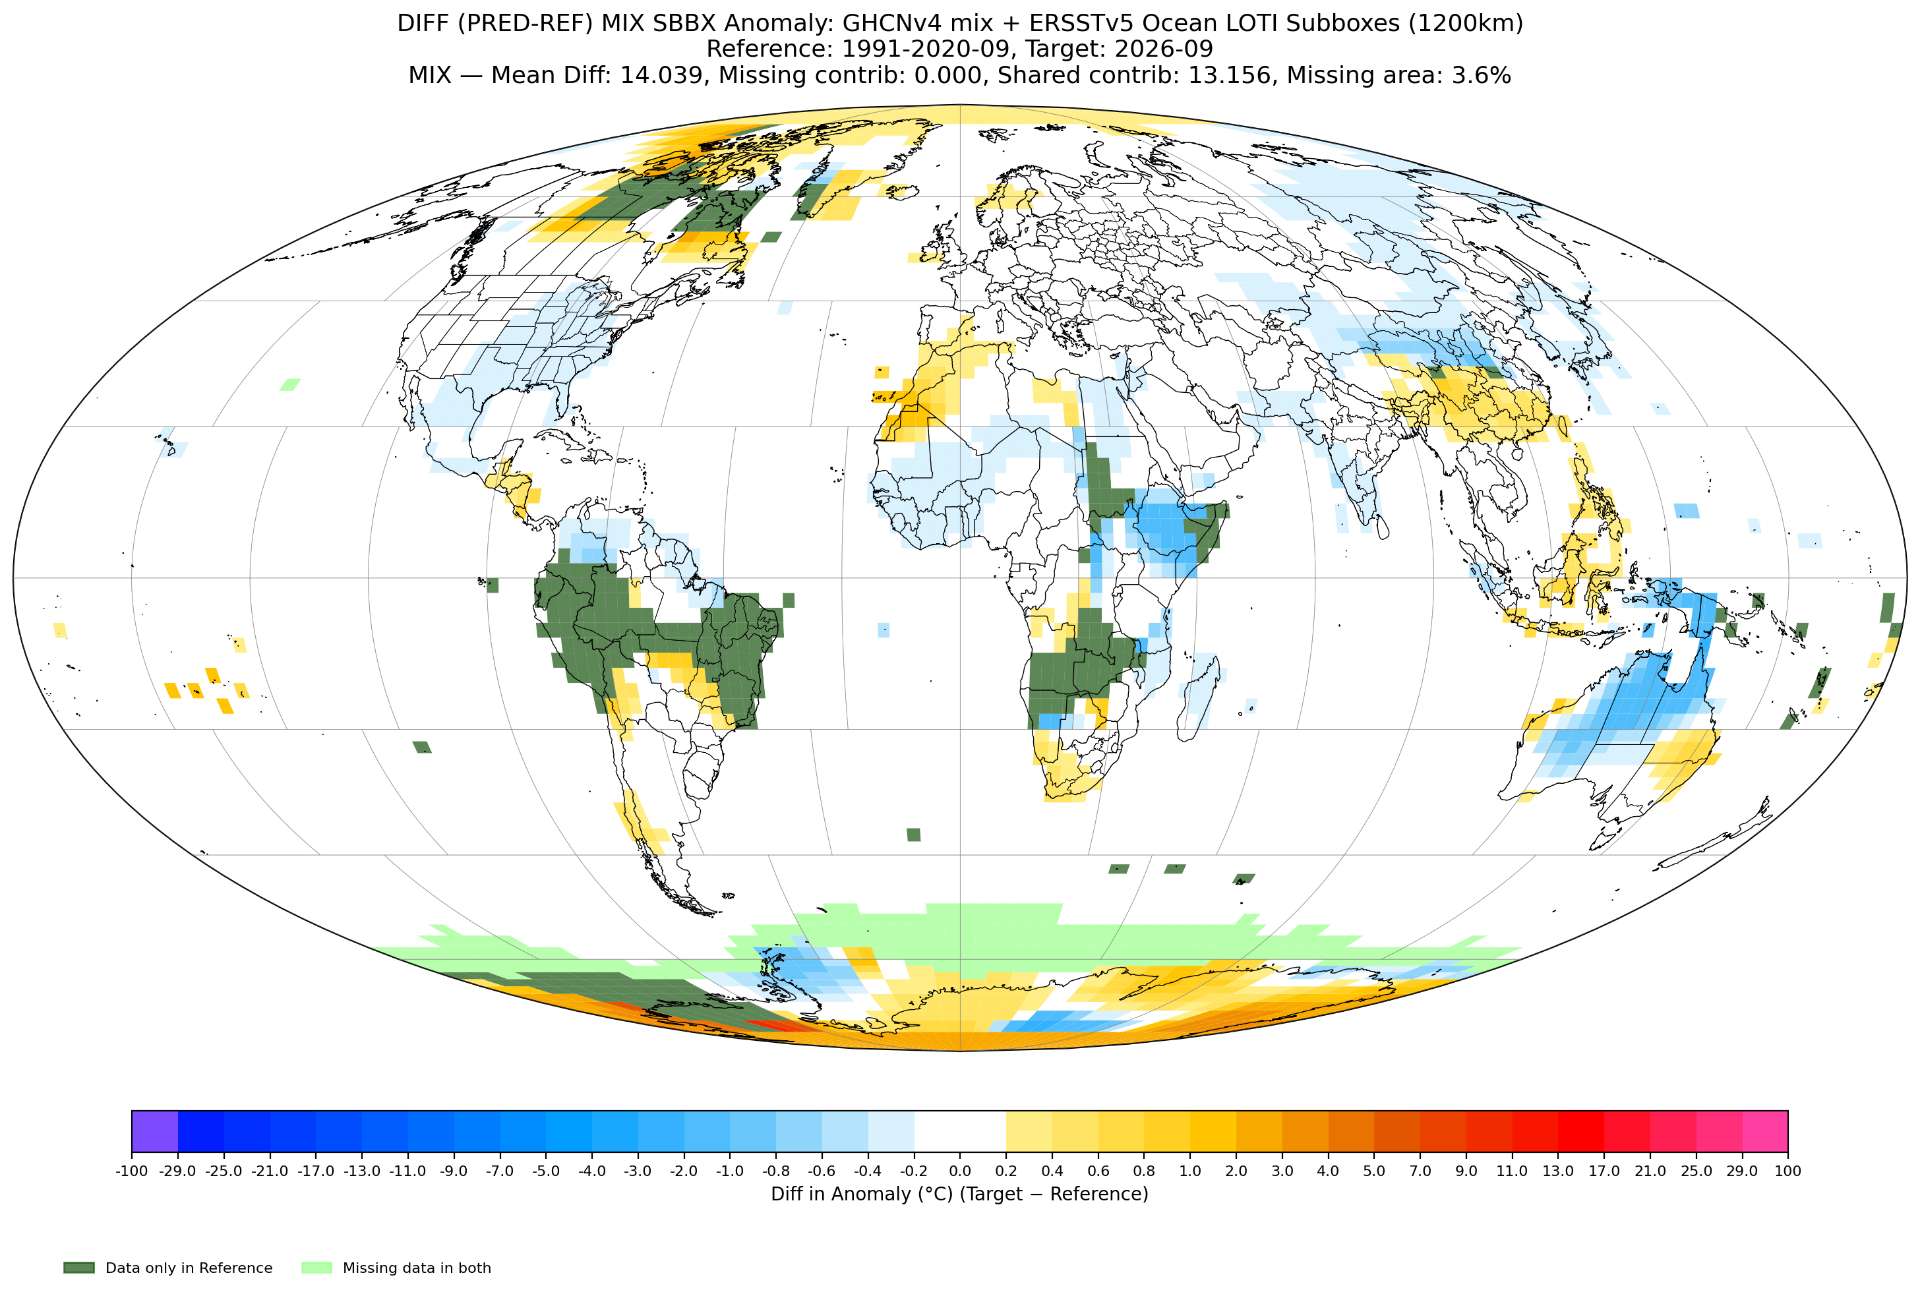
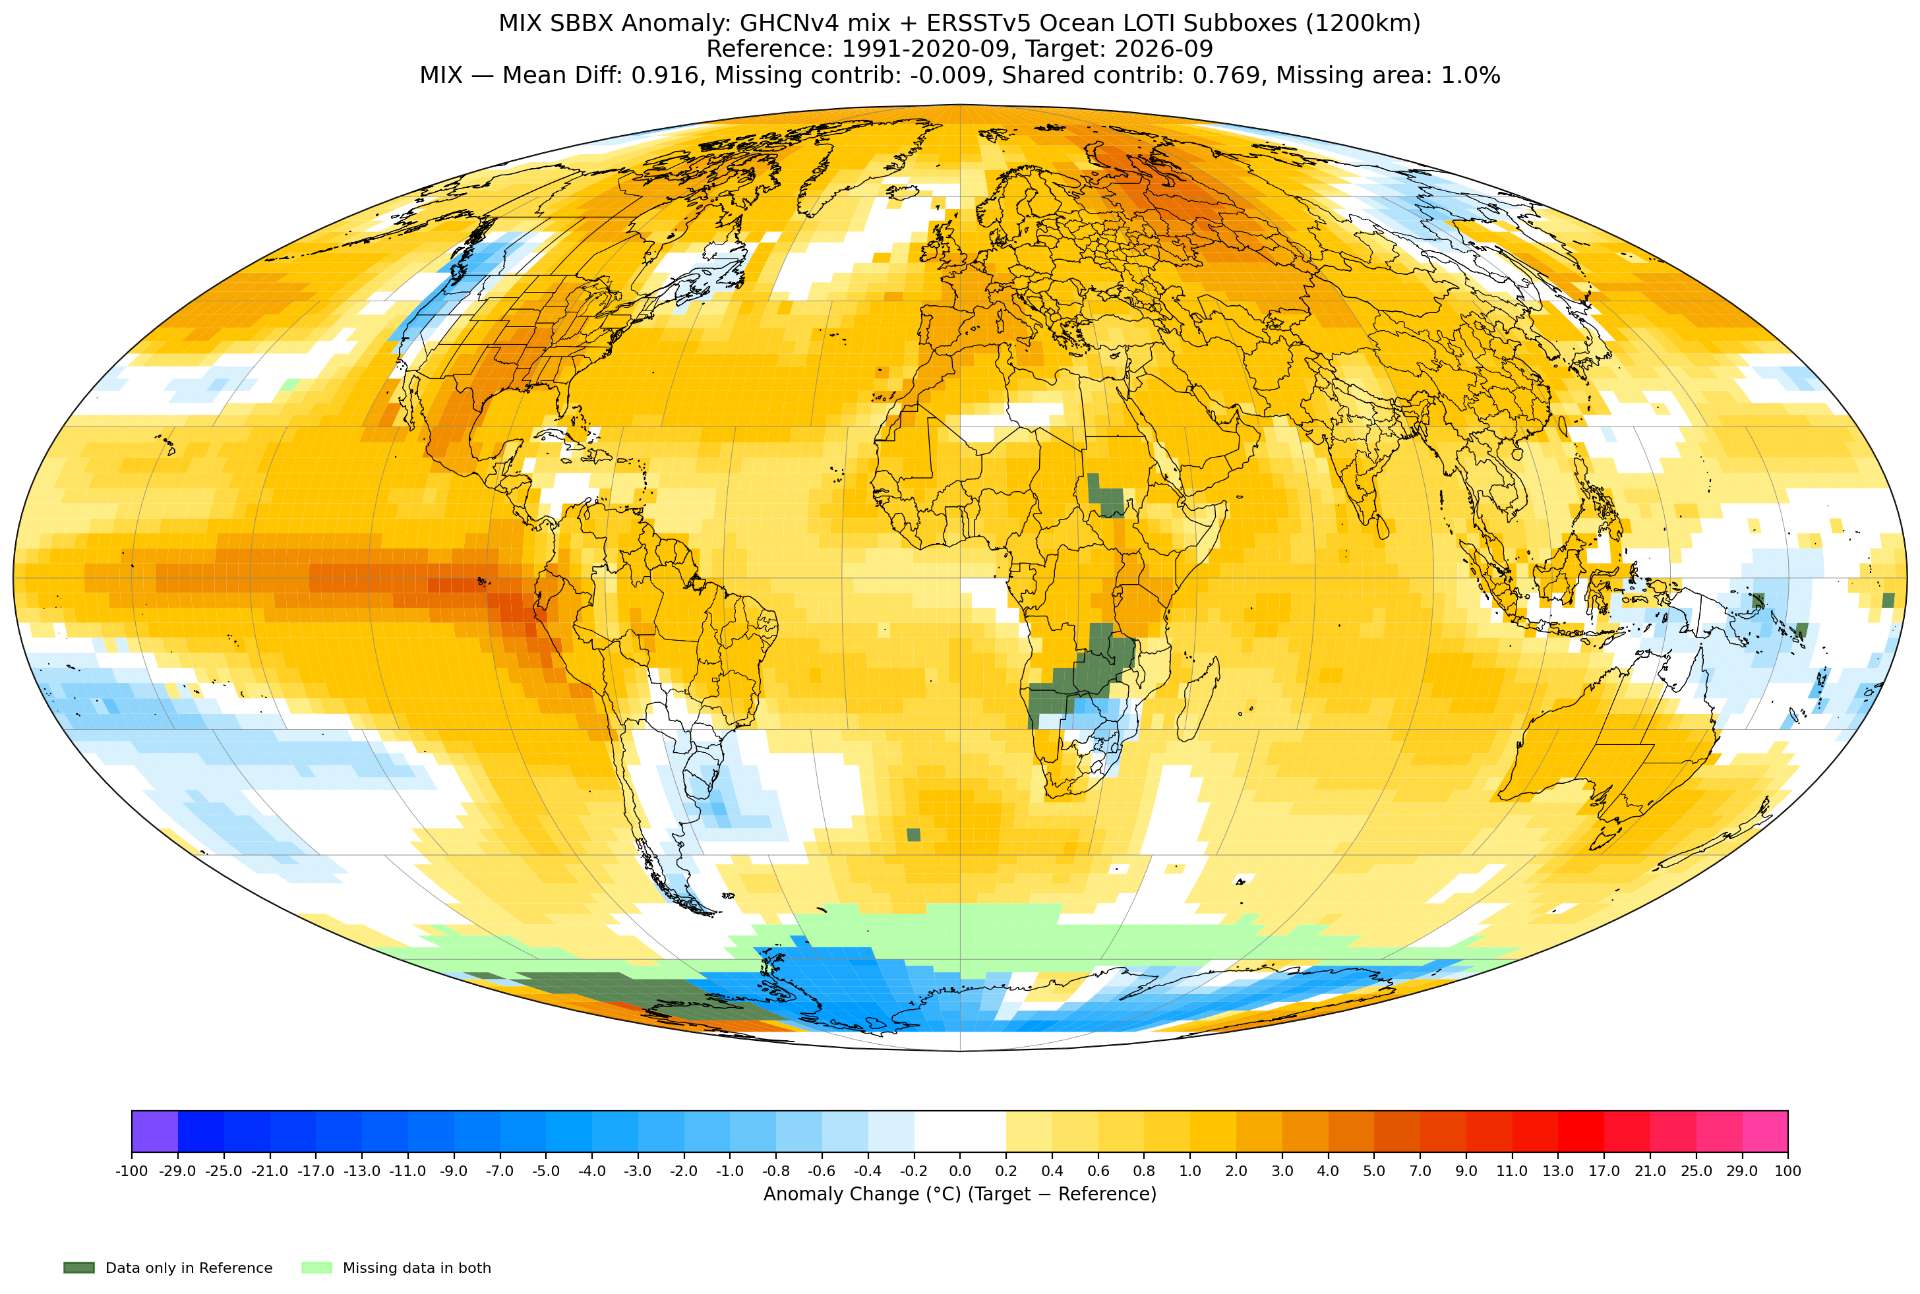
Predicted station plot, diff (from last ghcnm run) and plot of mixed subbox anomalies :
~
I compare the predicted (mix) plot with the ERA5 subbox and full res plots, together with the diff (I've changed the diff plot of ghcnm station predictions to use PRED-REF (predicted GHCNm - last GHCNm)).
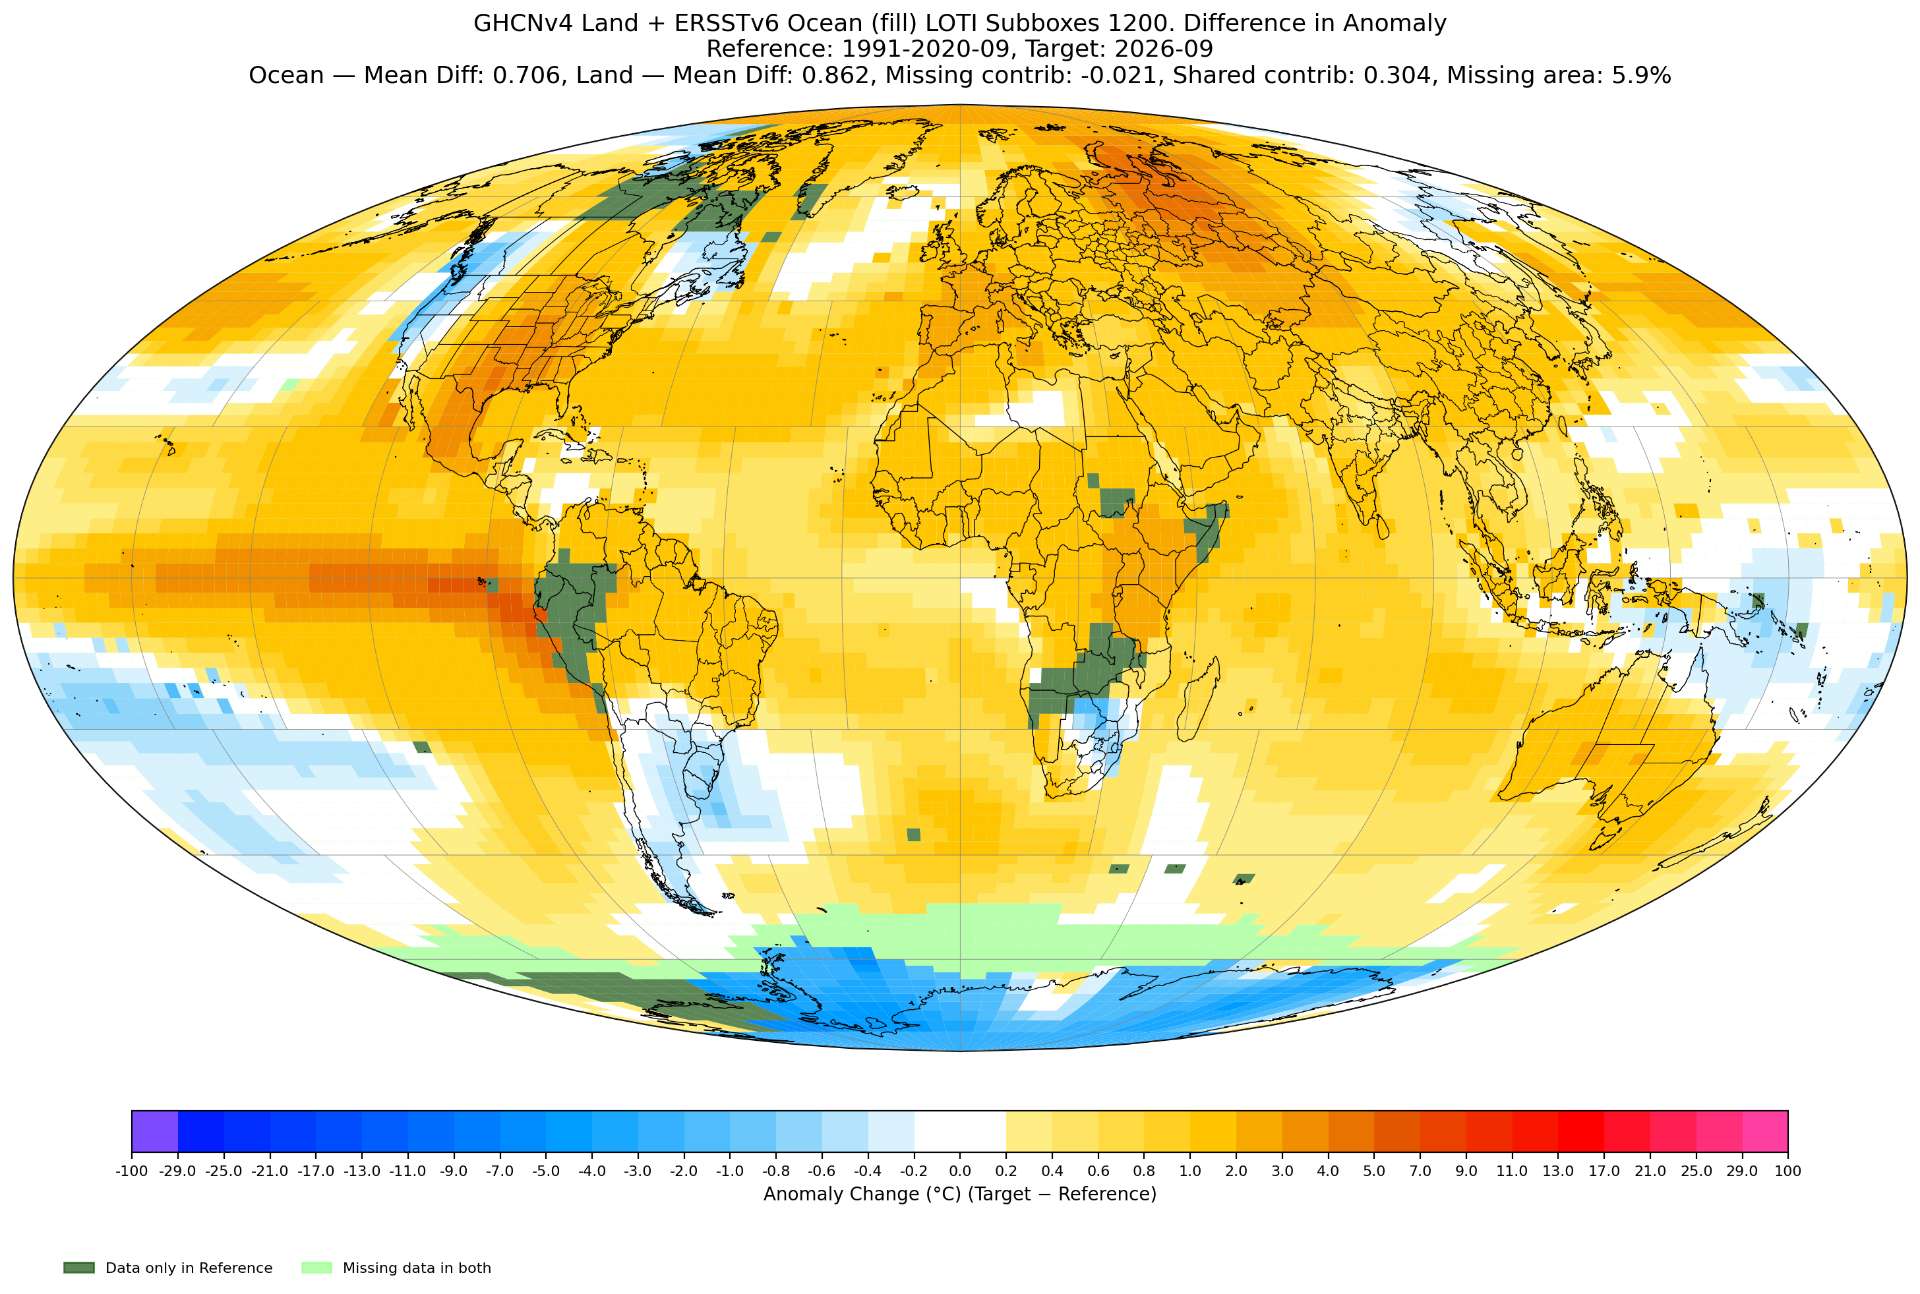
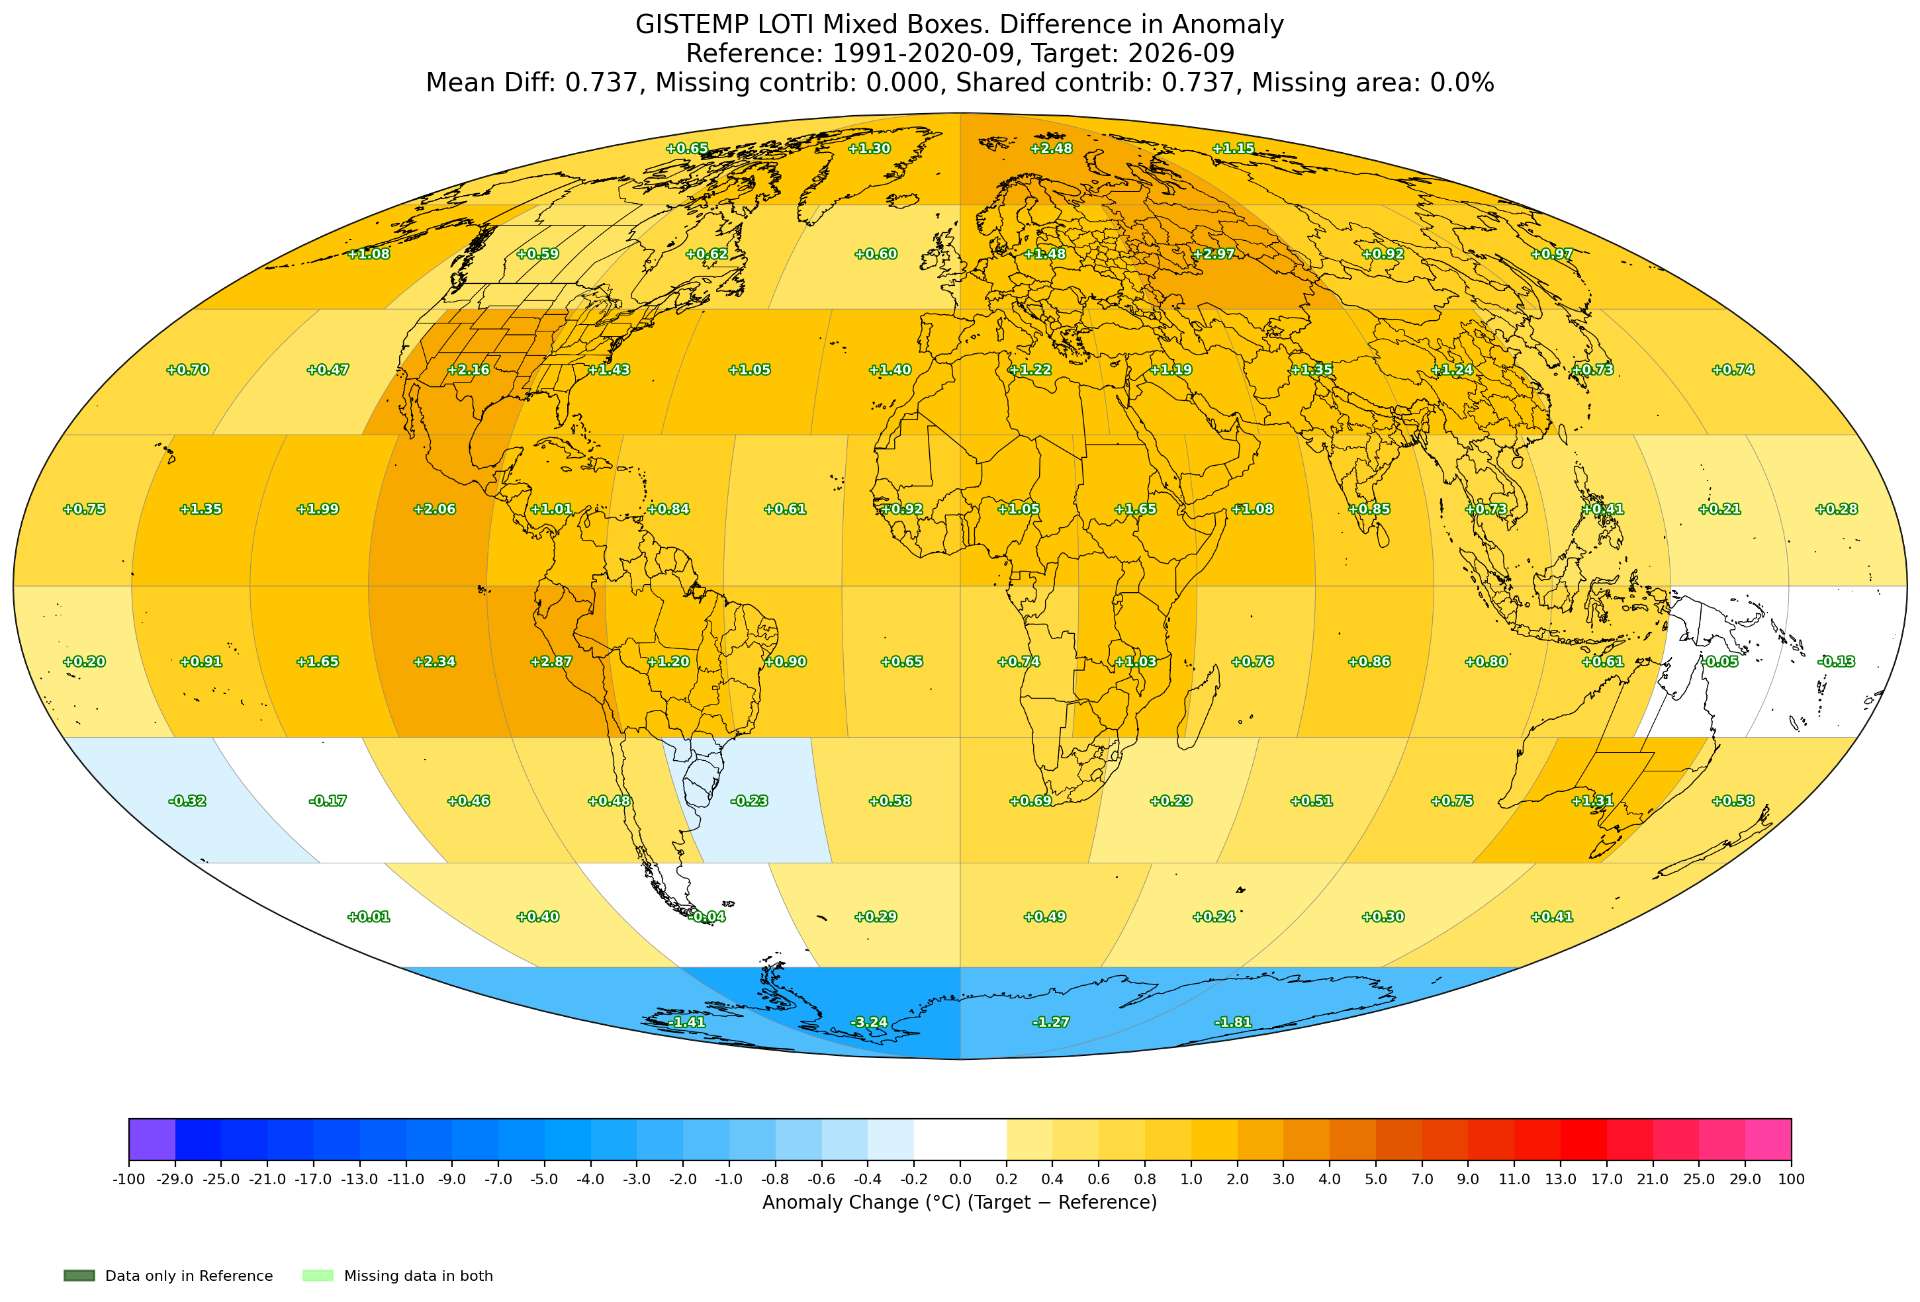
Several places to note:
Greenland is far warmer in predicted than ERA although the stations on the southwest coast might be neutral instead of cool (its hard to tell with the 0.25 deg res); this is a consequence of last month missing Greenland stations since I use that for reference. If we do get the usual stations it should cool significantly.
Canada is missing several stations in NE canada that should be significantly anomalously warm that don't show up in the diff yet (dark green subboxes).
The Russia warm anomaly is as usual cooler in GISTEMP subboxes than in ERA5 despite the station anomalies appearing similar in the station plotter, and similarly warm central US anomaly is far warmer in ERA5 than GISTEMP -- based on experience both of these are likelymostly from GISTEMP's 1200km smoothing radius.
Africa:
Once again this month the region where Sudan, South Sudan and Ethiopa meet show a warm anomaly again in ERA5; given the lack of stations for GHCNm in the region this will be another significant gap that causes forecasts not using station predictions to be on the warm side; for this ghcnm prediction though since there is a single Ethiopian station that is neutral it should actually cool the temps relative to the last ghcnm (cool several subboxes about -1 C -- that should cool globally by a quick count and estimate roughly -0.004 C).
As shown by the diff, there is another significant warm anomaly along Morocco/Western Sahara and the islands offshore that should cause further warming once coming in.
South America: Peru looks warmer in our prediction (coastal stations from El Nino) than ERA5.
Australia and SE Asia: predictions look cooler than in ERA5 (the diff expects about -1C more cooling across NE Australia and SE Asia). The diff expects Australia (and SE Asia) to cool relative to current ghcnm when the rest of station data comes in.
Antarctica in next thread...
2/2
Antarctica:
It looks like it is forecast a bit too warm, especially when including Minna Bluff, although there are a couple more stations on the Ross Ice Shelf that might end up let it sneak by the GHCNm quality control, although whether NASA flags it is a separate issue.
Note that in my predictions I replace all stations with forecasts (using last month's run's stations) and further replacing those Antarctica stations from CLIMAT data that aren't in the last ghcnm (i.e. I replaced MCMURDO_SOUND_NAF from -19.13 with a +3 to +4 C warmer forecast of -22.84 to avoid homogenization effects; while we get the addition of ELIZABETH which isn't yet present but the CLIMAT data has been out). In the future I plan on just doing all the quality control steps myself on the latest qcu version of ghcnm with additions of station data from CLIMAT and station forecasts tuned to qcu to get a better forecast qcf (unfortunately this is held back by some other preliminary QC data for Antarctic stations that I haven't yet finished and will take a while).
(unhomogenized) the Elizabeth station anomaly is roughly +7.4 C (1991-2020) based on the CLIMAT data already available:
Elev. (m): 549.0, Station: AYM00089332, Name: ELIZABETH
LAT/LON: -82.62/-137.08, Value: -25.40, Anomaly: 7.40, Last30yrs -> mean: -32.21, min: -39.00, max: -23.00, std: 4.09
Even homogenized guesswork would say this shouldn't drop it down to less than 5 C or thereabouts given that other stations nearby.
A significant question is whether the CLIMAT for MINNA_BLUFF will be discarded by GHCNm (which has a 11.5 C station anomaly that is almost 5 std, but not quite) (as I explained previously BAS/UKMET (EGRR) doesn't follow published WMO standards for CLIMAT so it is actually missing alot of data, likely from the sensor affected by rime again). If it gets thrown out by ghcnm or by NASA it should drop the global temps a bit but hard to say how much (I'd hazard a guess not more than -0.01 C globally since its not isolated though based on past experience with how many stations next to it should adjust it with the GISTEMP stitching).
Edit: A second run shows it dropping -0.007 without it.
Nearby stations have high anomalies too like McMurdo.
Elev. (m): 24.1, Station: AYM00089664, Name: MCMURDO_SOUND_NAF
LAT/LON: -77.88/ 166.73, Value: -19.13, Anomaly: 4.55, Last30yrs -> mean: -24.18, min: -32.26, max: -16.70, std: 3.22
Elev. (m): 920.0, Station: AYM00089768, Name: MINNA_BLUFF
LAT/LON: -78.55/ 166.65, Value: -18.80, Anomaly: 11.48, Last30yrs -> mean: -30.04, min: -40.00, max: -20.90, std: 4.96 EXCEEDS 30-yr RANGE BY +2.10°C
Elev. (m): 50.0, Station: AYM00089769, Name: LINDA
LAT/LON: -78.47/ 168.38, Value: -26.70, Anomaly: 3.31, Last30yrs -> mean: -29.65, min: -35.42, max: -23.45, std: 3.13
For reference these are the CLIMAT data for the (expected but) missing AA stations (not yet in GHCNm) that I've replaced my forecasts with (otherwise they are forecast from ERA5 to GHCNm using standard techniques as mentioned previously)
station_id YEAR MONTH COUNTRY LAT LON NAME ELEV obs_datetime mean_temperature_c missing_days file_datetime
ID
AYM00089050 89050 2026 9 AY -62.183 -58.883 BELLINGSHAUSEN_AWS 14.0 2026-09-01 00:00:00+00:00 -5.5 0.0 2026-10-01 08:32:29+00:00
AYM00089108 89108 2026 9 AY -89.000 -1.017 HENRY 2755.0 2026-09-01 00:00:00+00:00 -60.7 0.0 2026-10-05 02:13:59+00:00
AYM00089332 89332 2026 9 AY -82.617 -137.083 ELIZABETH 549.0 2026-09-01 00:00:00+00:00 -25.4 0.0 2026-10-05 02:15:16+00:00
AYM00089768 89768 2026 9 AY -78.550 166.650 MINNA_BLUFF 920.0 2026-09-01 00:00:00+00:00 -18.8 19.0 2026-10-05 02:15:23+00:00
AYM00089769 89769 2026 9 AY -78.467 168.383 LINDA 50.0 2026-09-01 00:00:00+00:00 -26.7 0.0 2026-10-05 02:15:17+00:00
AYM00089832 89832 2026 9 AY -66.717 139.833 D_10 243.0 2026-09-01 00:00:00+00:00 -20.9 0.0 2026-10-05 02:16:00+00:00
AYM00089834 89834 2026 9 AY -67.400 138.733 D_47 1560.0 2026-09-01 00:00:00+00:00 -31.6 0.0 2026-10-05 02:14:06+00:00
AYM00089864 89864 2026 9 AY -74.950 163.683 MANUELA 80.0 2026-09-01 00:00:00+00:00 -25.2 0.0 2026-10-05 02:15:23+00:00
AYM00089868 89868 2026 9 AY -79.900 169.983 SCHWERDTFEGER 60.0 2026-09-01 00:00:00+00:00 -31.3 0.0 2026-10-05 02:15:23+00:00
AYM00089873 89873 2026 9 AY -83.133 174.167 ELAINE 60.0 2026-09-01 00:00:00+00:00 -29.3 0.0 2026-10-05 02:14:06+00:00
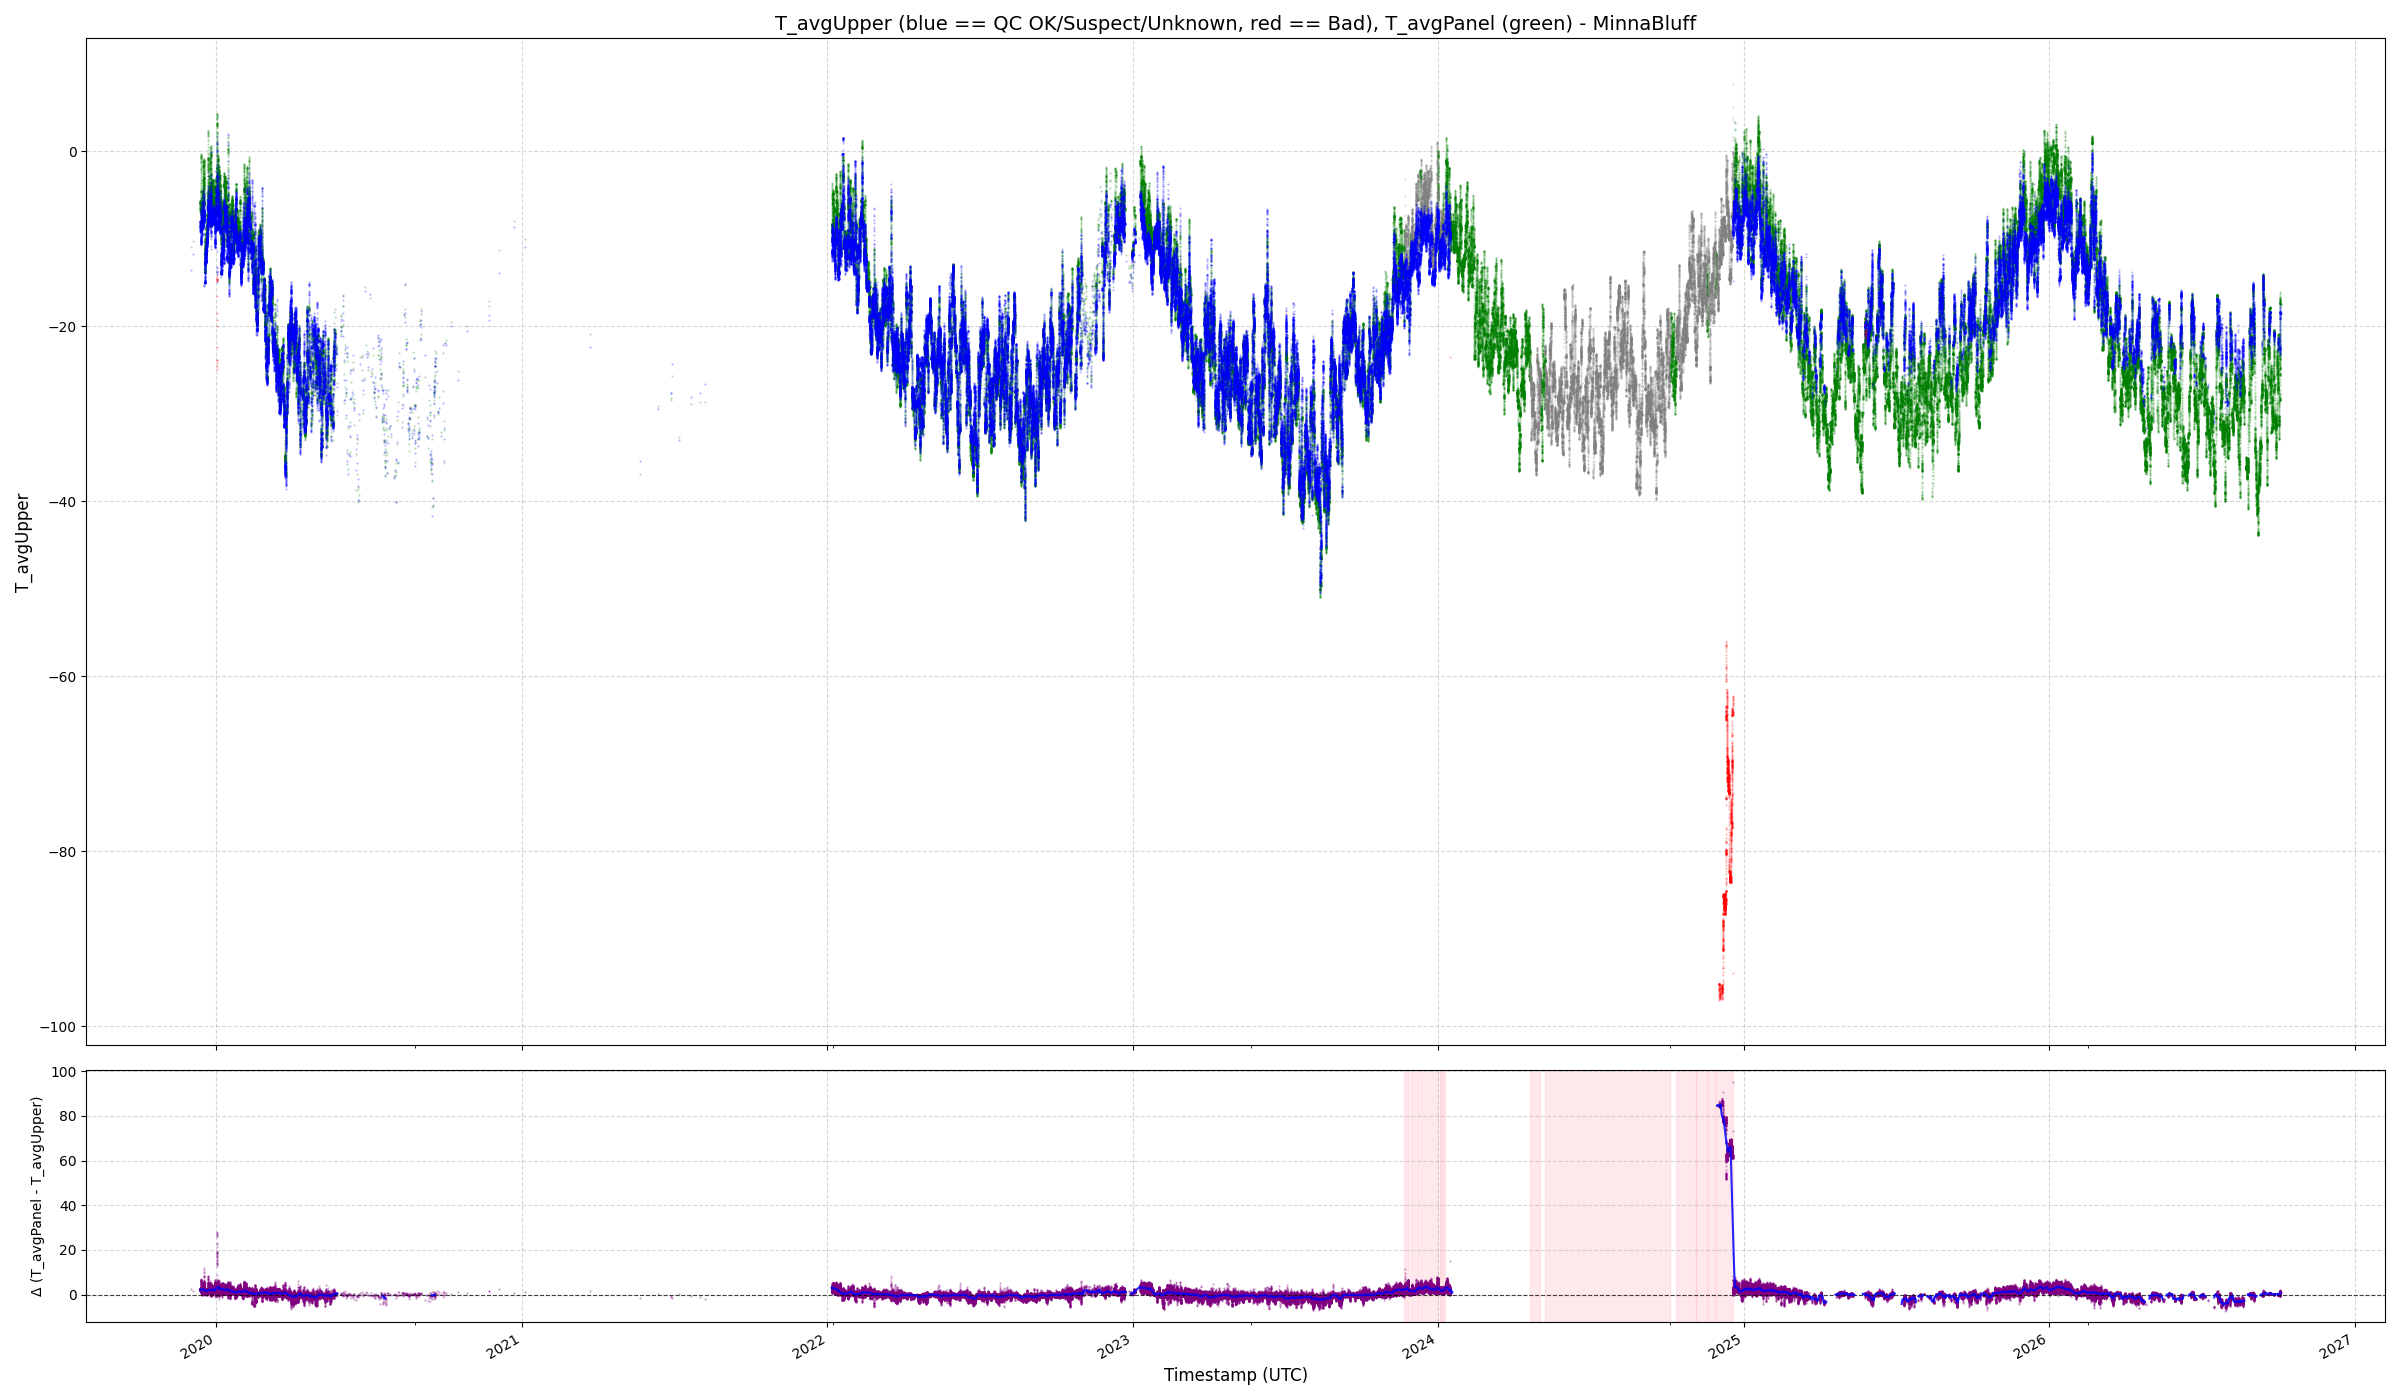
I can say processing the raw 10min data myself the 19 missing days for Minna Bluff is actually too generous per WMO spec, which should be 27/30 missing days for September:

Example historical output (from when it switched to iridium antenna); you can infer from the below and see its only been reporting temperatures during the day time the last couple winter seasons as the panel temperature sensor (green; grey is panel QC bad) and having a rough time the last 3 years in winter:
==
ghcnm.v4.0.1.20261005:
132.596
~
updated diff plot (from same predictions including MinnaBluff as last night) below:
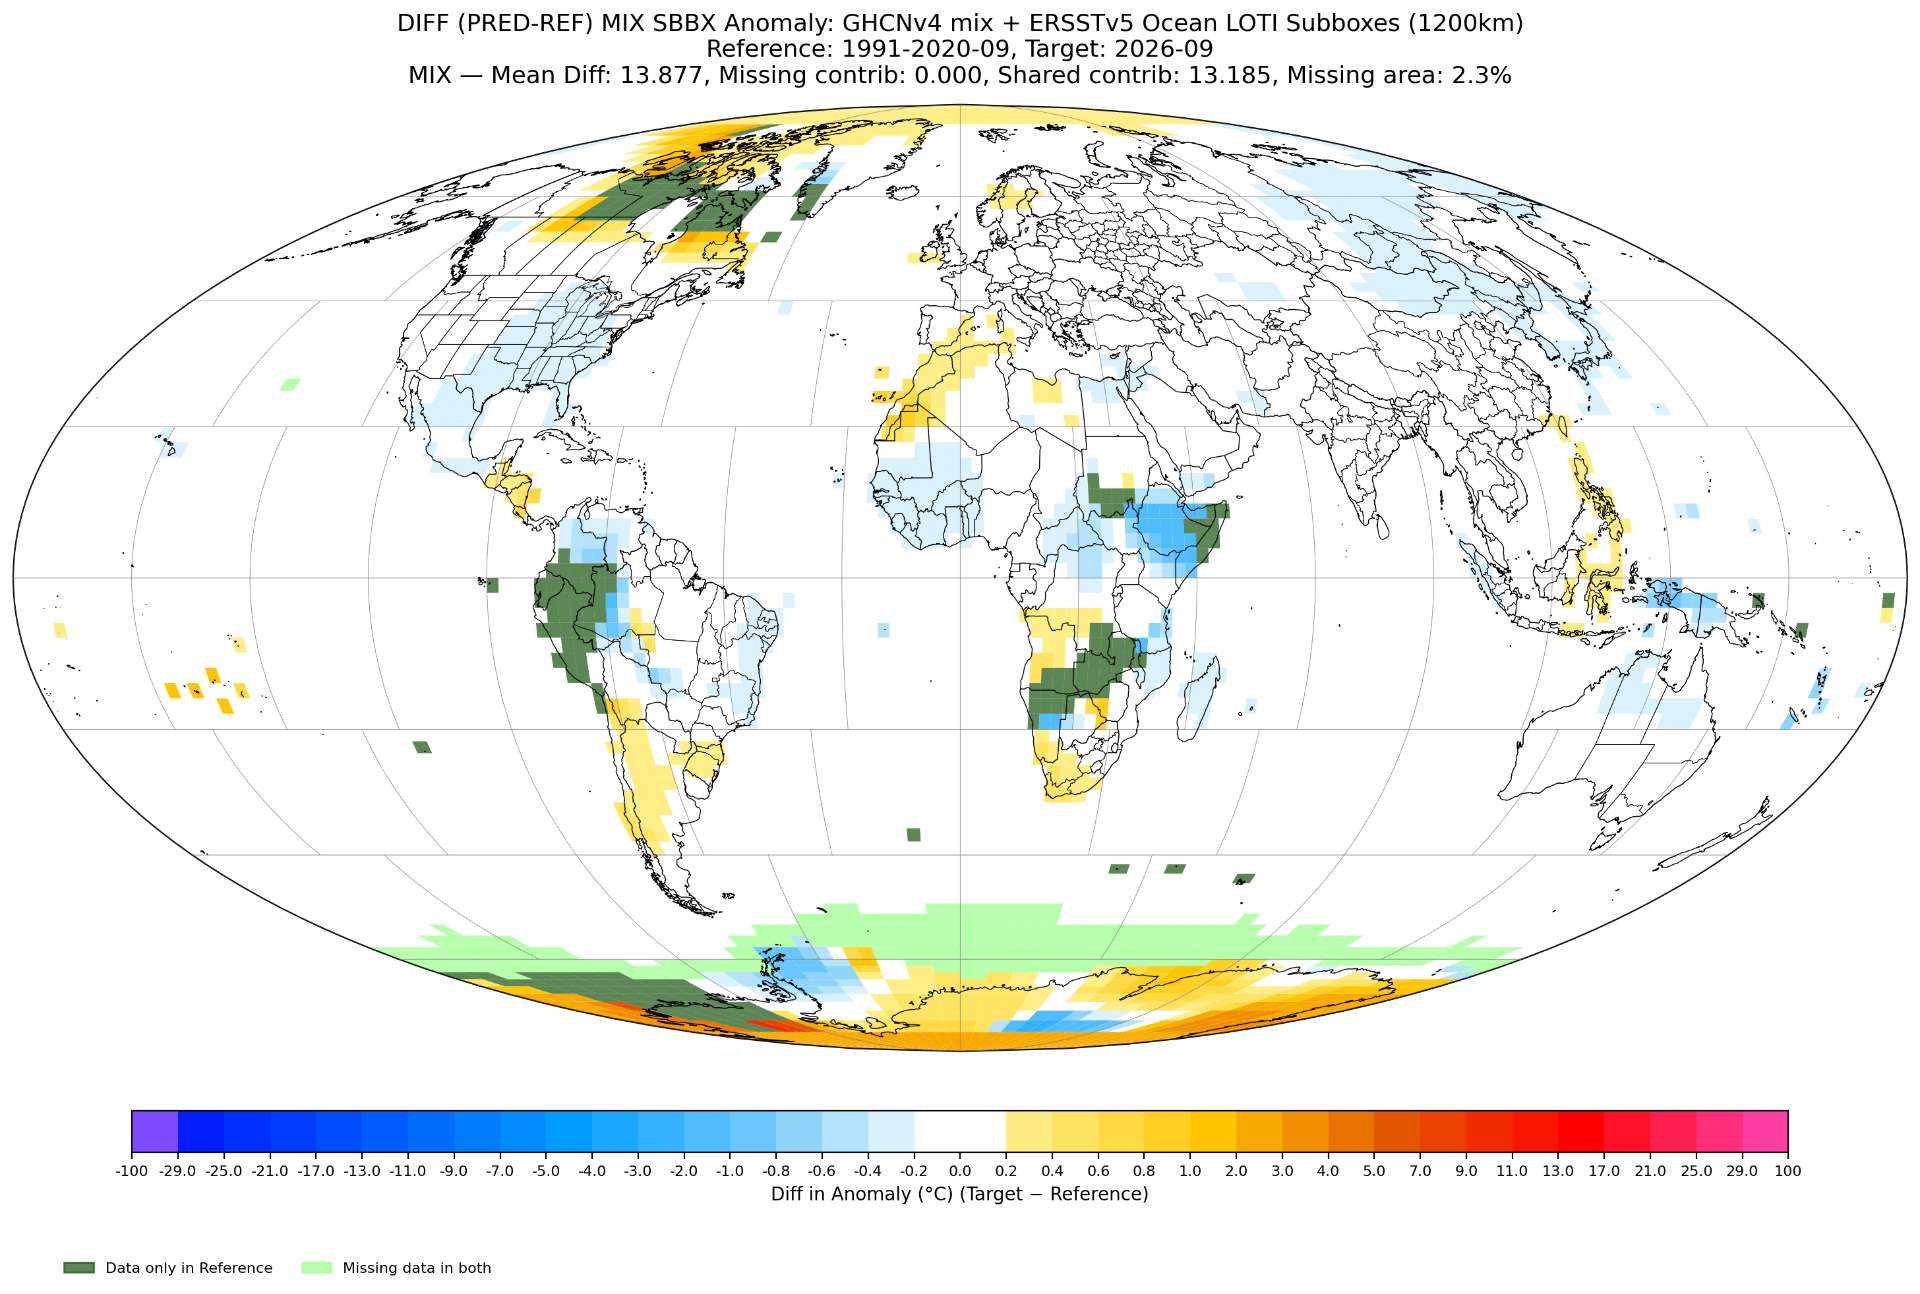
Nothing unexpected so far with last update and so no changes to predictions:
Australia and SE Asia differences have mostly gone away with the new stations added (although not all of those stations are in, especially Australia).
Some of those hot Morocco stations came in but not the coastal islands yet so the difference has only been slightly reduced since those island stations should be hot.
Central Africa is also roughly as expected with new stations added although there should be one or two more still coming based on last month's stations (slightly cooler in some parts in predictions which should only be marginal in the global changes).
Brazil stations also came in (most of it anyway) and they are mostly what was predicted (one of the stations in the southwest was missing from the prediction as it was missing last month, so there are a few subboxes a bit on the cold side in my prediction).
Only one more Antarctica station added that caused marginal changes there.
ghcnm.v4.0.1.20261006:
136.267
GISTEMP plots:
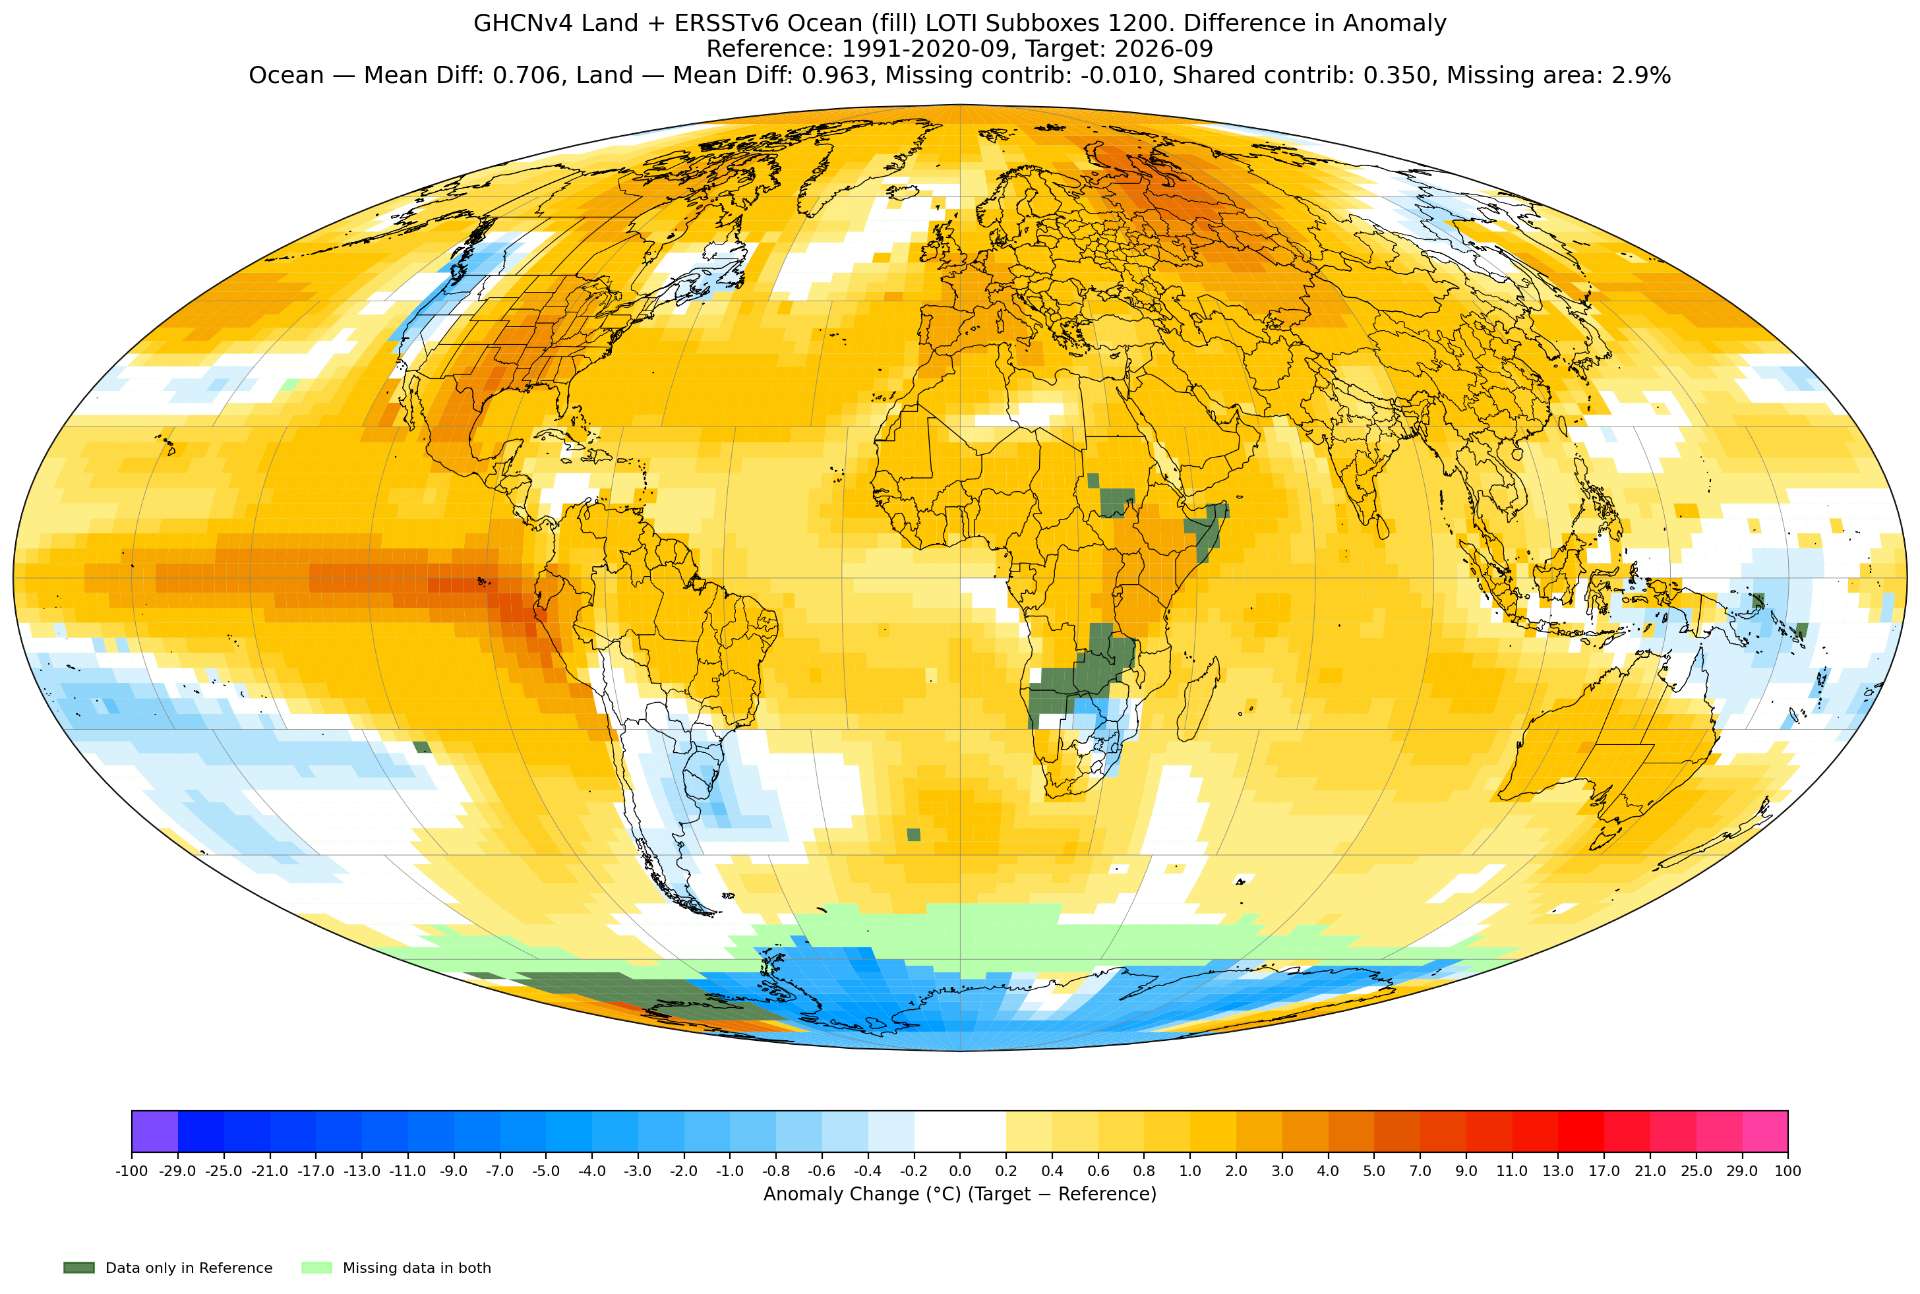
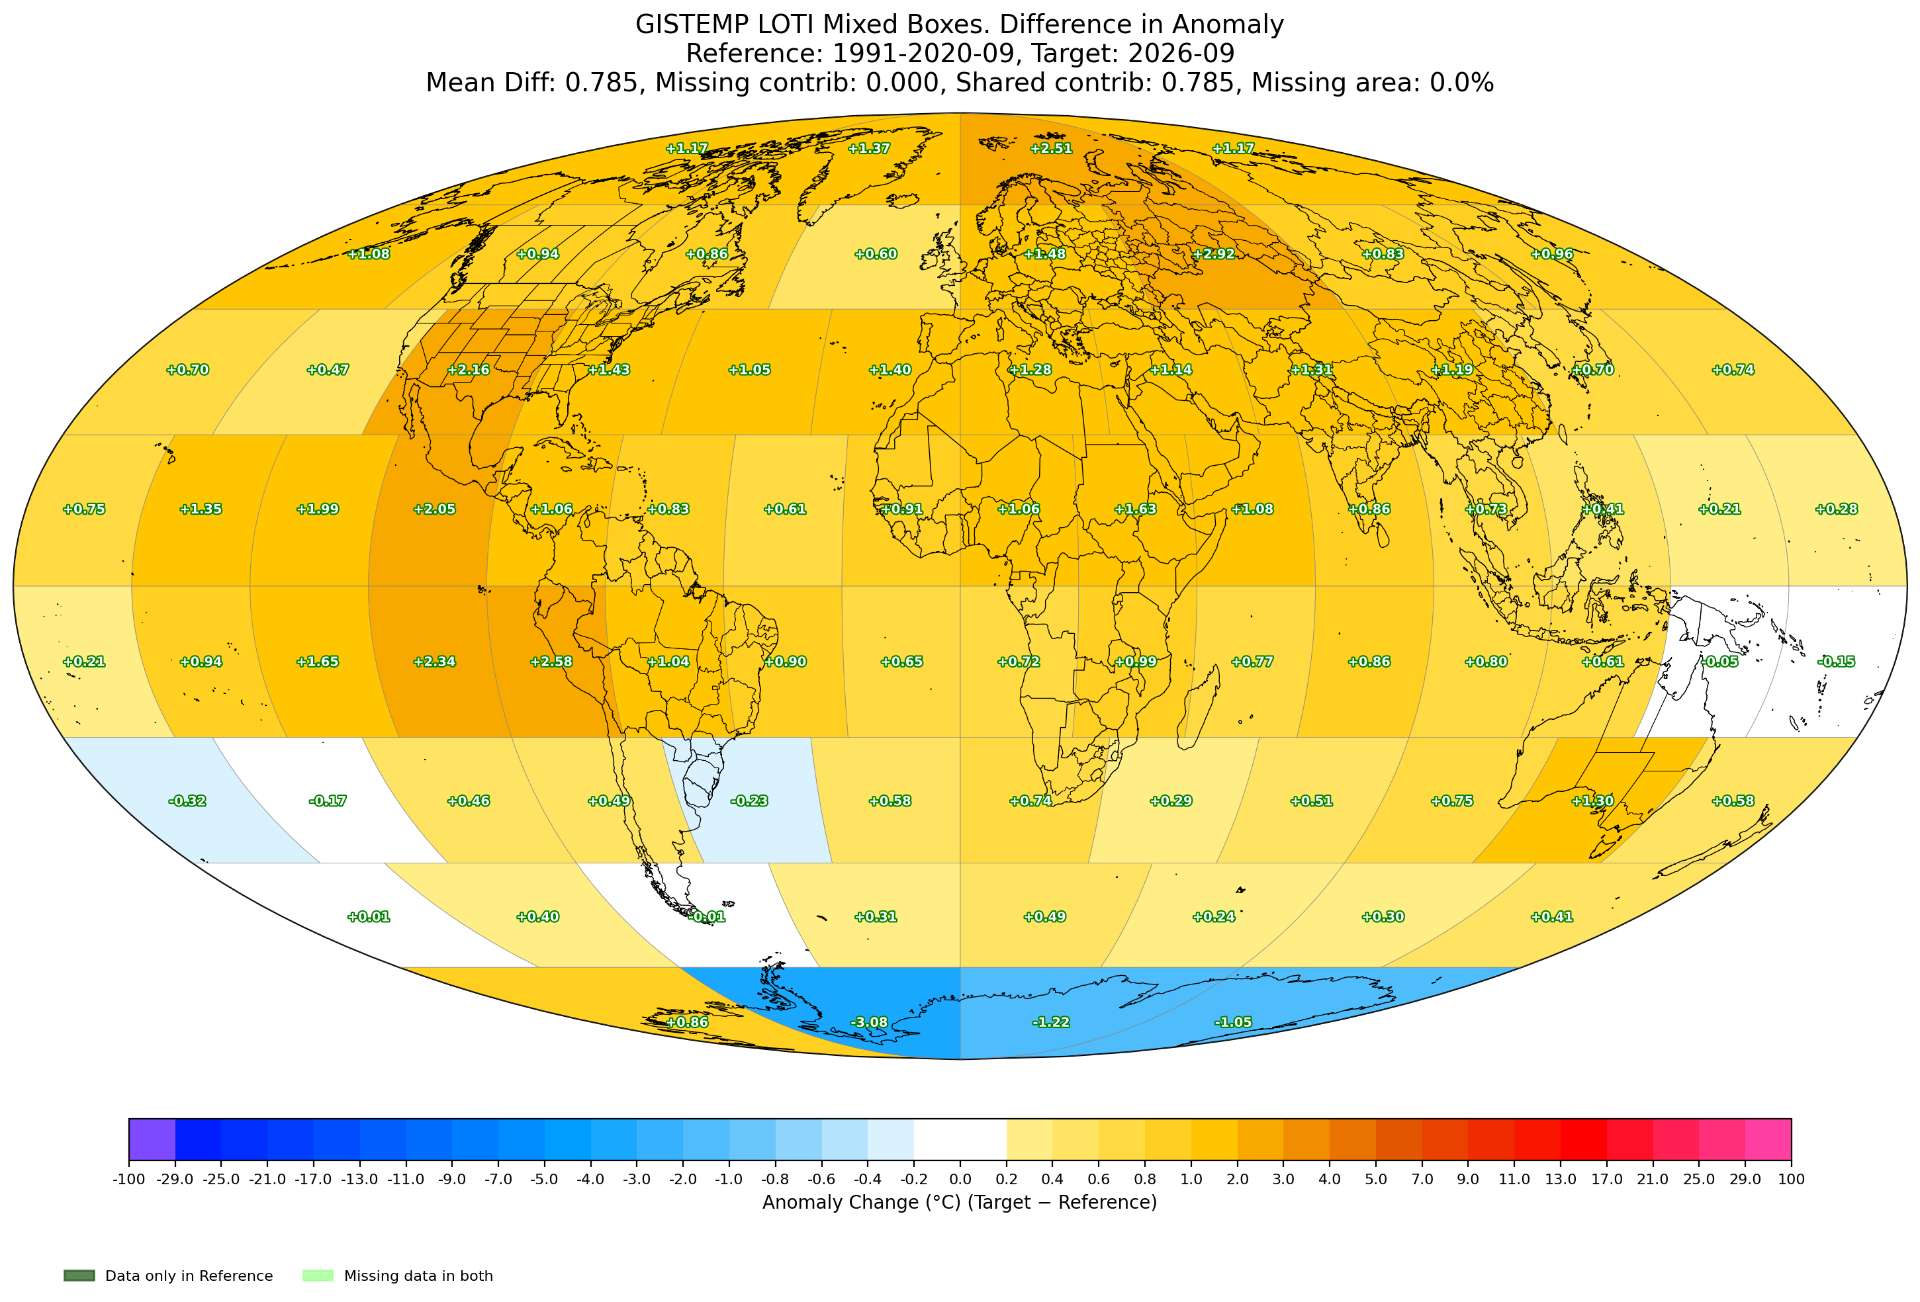
~
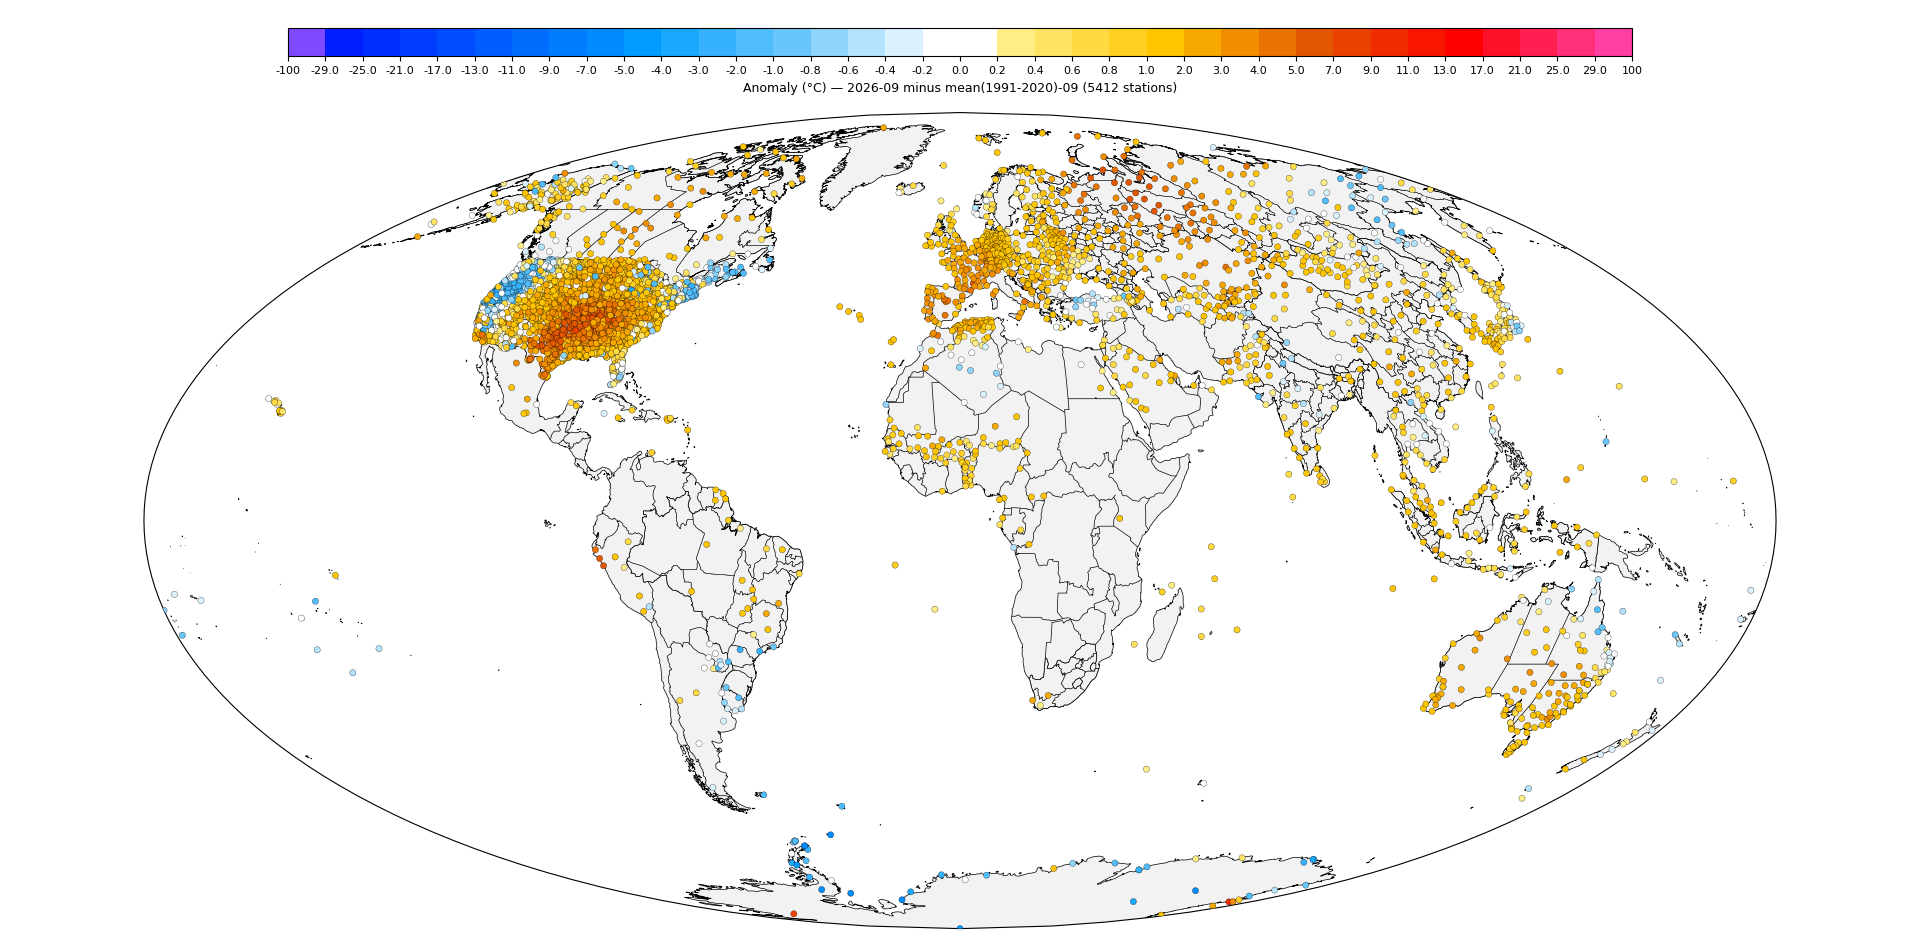
We are warmer than expected in today's run based on the stations that came in and the previous predictions and diff plots. This is largely due to Antarctica being a bit colder (from the South pole, the peninsula, and a few other stations not shown on the station plotter west of VOSTOK) as well as to a lesser degree a station in southern Peru being a bit colder.
The coastal Greenland stations still haven't come in and I no longer expect them to at this point so there is still some downside uncertainty from them.
MINNA_BLUFF was included by ghcnm which reduces a substantial portion of the uncertainty on the low side, although it's still a question of whether it is excluded by NASA. Based on the experiments the other day if its excluded it should drop by roughly -0.007 C to 1.356 C or so, although since they haven't done so in the past its not likely they'll get around to doing so this month.
updated DIFF plot using latest GISTEMP run and that previous prediction-ghcnm gistemp run a couple days ago... I'm fairly satisfied with it this month despite the misses detailed below (since it only resulted in the prediction off by about 1.36267 - 1.35983 = +0.00284 C from the one I made a couple days ago under the assumption that MINNA BLUFF is kept.
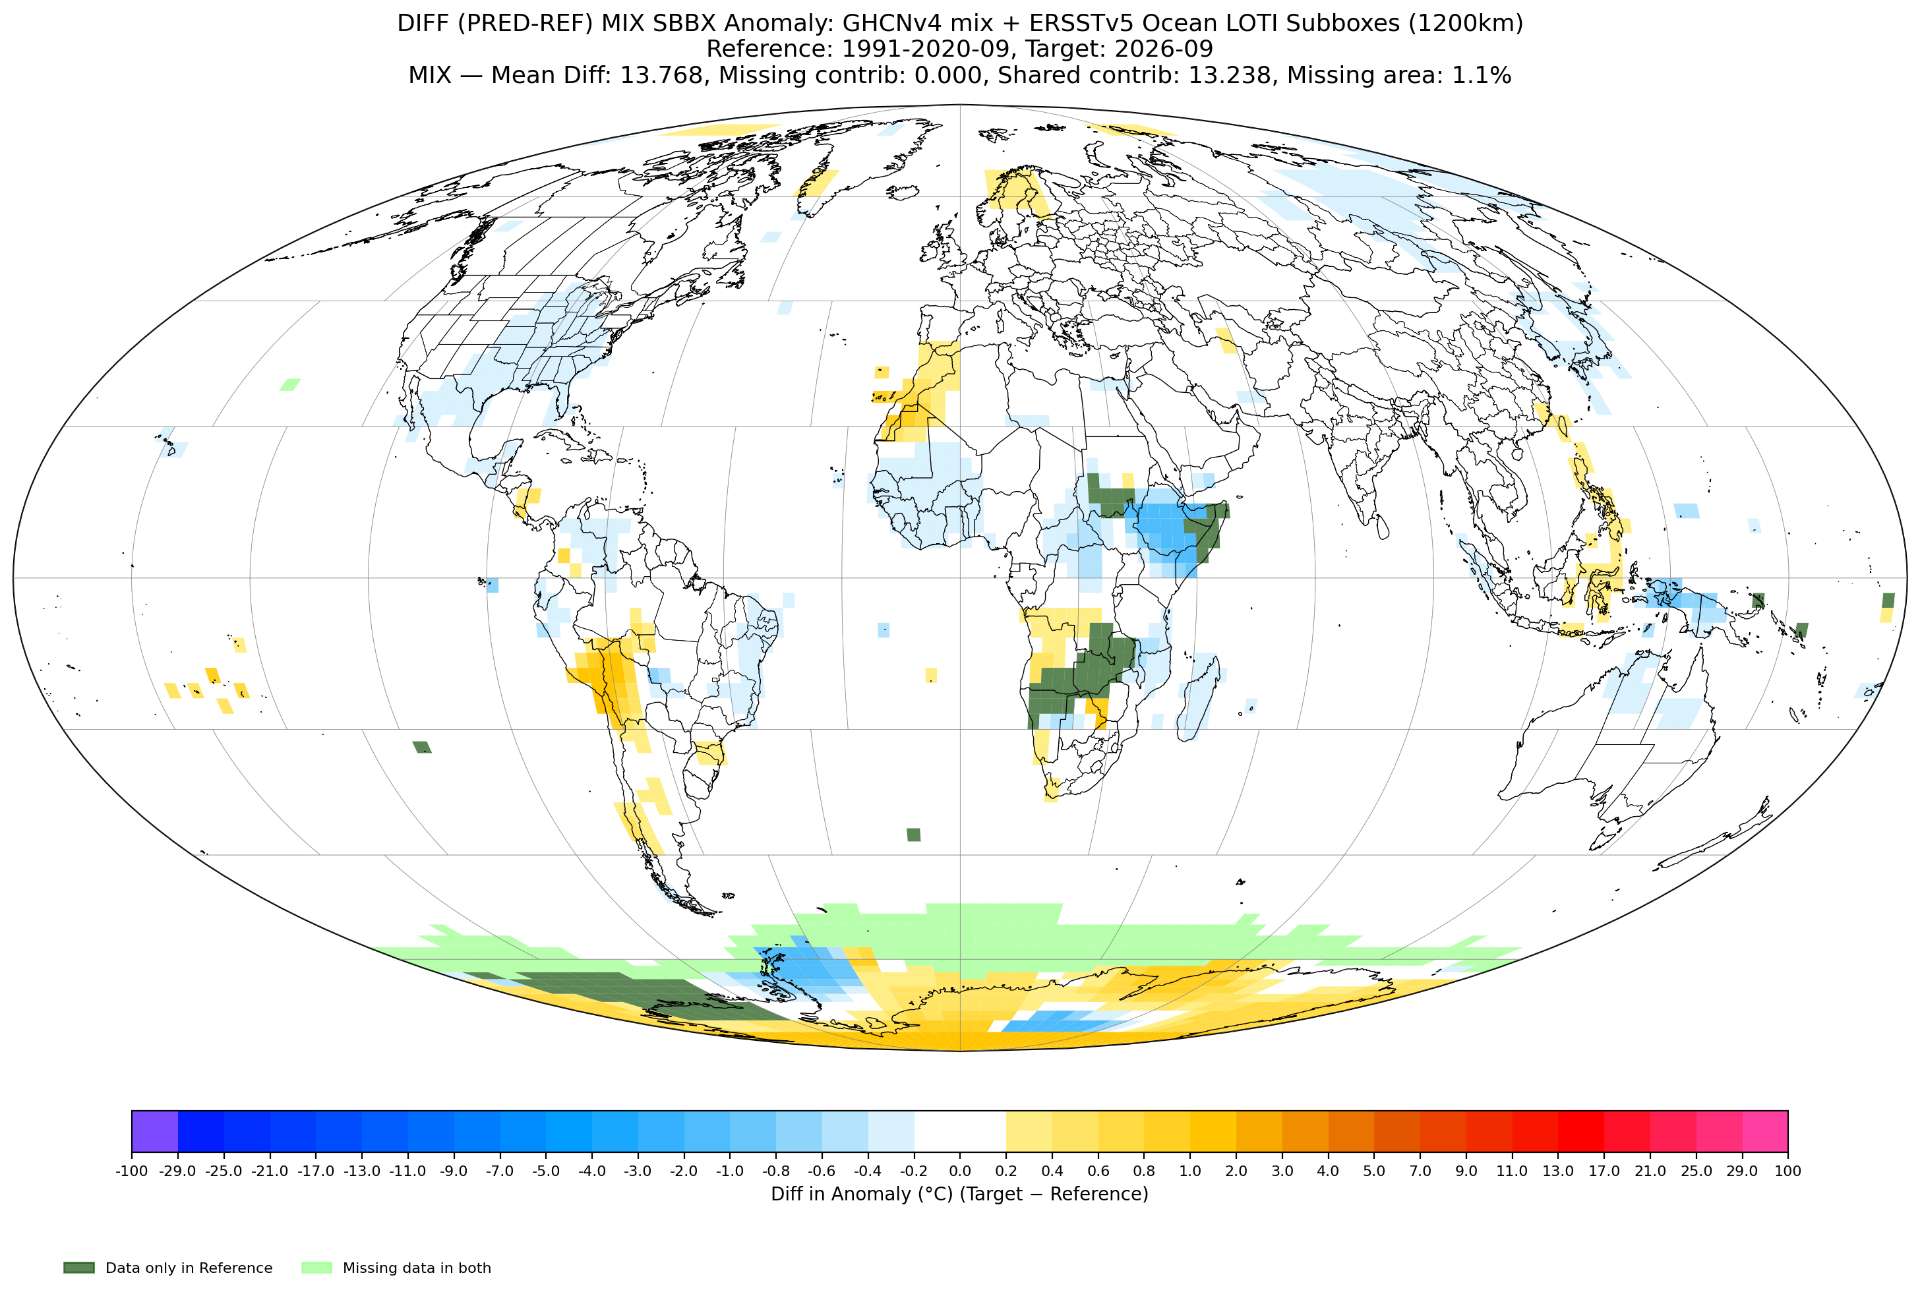
Coastal island stations off of Morroco still not in yet, and NASA will either do the run today (using the above value most likely) or tomorrow morning. Chile is missing (including a couple of its island stations far west into Pacific) as well as several stations from Argentina and Australia. Individually the only station of note that might be included by tomorrow is HENRY (AYM00089108). Given the updates and the below analysis this leaves largely upside now uncertainty (the downside being whether MINNA_BLUFF is excluded by NASA, and if Greenland comes in which I doubt it will at this point since it still has not) it is no longer sufficient IMO to warrant 1.30-1.35 or being nearly as plausible any more. I've updated my bets in aligned with this subjective prediction (roughly 70-80% confident). How I could be wrong: some missing stations come in much cooler than expected like Ethiopia, HENRY, etc and possibly MINNA_BLUFF gets excluded by NASA but not JULIACA.
~
AMUNDSEN_SCOTT prediction was -3 C colder than I predicted (-60.66) which is a significant miss (AA still needs some work); if HENRY comes in and it is different it will likely slightly raise the region based on the prediction I did previously:
Elev. (m): 9999.0, Station: AYW00090001, Name: AMUNDSEN_SCOTT
LAT/LON: -90.00/ 0.00, Value: -63.70, Anomaly: -4.89, Last30yrs -> mean: -58.94, min: -63.60, max: -51.20, std: 2.87 EXCEEDS 30-yr RANGE BY -0.10°C
Also in Antarctica I can only infer it also appears the same group of recent stations (UW stations if I recall) again whose predictions were a miss on the cold side by about -1 to -2 C (west of VOSTOK) and not shown on the station plotter since they have no 1991-2020 data).
JUILIACA (Peru) was also off (about 1.4 C colder than the predicted 10.56 C):
Elev. (m): 3825.8, Station: PEM00084735, Name: JULIACA
LAT/LON: -15.47/ -70.16, Value: 9.15, Anomaly: -0.52, Last30yrs -> mean: 9.99, min: 8.42, max: 13.70, std: 1.33
I spent most of my time investigating JULIACA this morning (below).
~
I don't know what's going on with JULIACA but given its difference from ERA5 it seems possibly problematic.
For reference this 9.15 C is the same temperature as the qcu version.
This station is likely SPJL (Inca Manco Cápac International Airport - Wikipedia )
I cannot discern why the GHCNm data (the qcu unhomogenized data) doesn't match source data for the last few years that I examined.
The current month's source is climat-ncdc while recent years includes climat-uk (CLIMAT messages from the QC'd UKMET's CRUTEM4 dataset). The data in ghcnm.qcu from more the last few years doesn't match climat-uk's data (which is a match for CLIMAT messages retrieved from ogimet). Even the more recent ones one would expect to match the CLIMAT messages transmitted in TAC format over GTS and they don't. I am aware that in the ghcnm station matching algorithm it will try to switch to nearby/overlapping stations over time if there are interruptions to the data and it thinks they are the same station so that is one possibility but I am doubtful of such a circumstance.
The September 2026 CLIMAT message from GTS for Juliaca (https://web.archive.org/web/20261007094333/https://tgftp.nws.noaa.gov/data/raw/cs/cspr01.spim..txt) shows what olgimet shows, 13.8 C, quite a bit away from the 9.15 C in GHCNm.
The two possibilities I can think of are GHCNm is 1) using completely different sources for climat-ncdc and climat-uk (not CLIMAT messages) (this would be very confusing) and 2) a bug in ghcnm pipeline effecting this particular station's source data (I did check the older qcu from last year before NCEI started their upgrade and they also are problematic for this station).
For reference the nearby station AREQUIPA (PE000084752) my prediction was 15.83 (off by -0.3C):
Elev. (m): 2520.0, Station: PE000084752, Name: AREQUIPA
LAT/LON: -16.33/ -71.57, Value: 16.15, Anomaly: 1.35, Last30yrs -> mean: 14.50, min: 11.86, max: 17.50, std: 1.28
~
Some of the referenced data for Juliaca:
OGIMET CLIMAT for JULIACA (https://ogimet.com/cgi-bin/gclimat?lang=en&mode=0&ind=84735&ord=DIR&year=2026&mes=12&months=12)
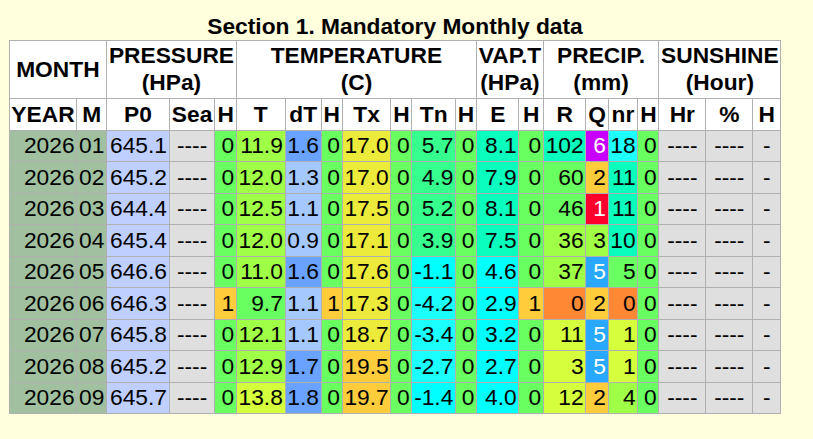
the "climatuk" source data parsed from CRUTEM4:

mcdw source data (parsed) that references both climatuk CLIMAT messages source data ('U') and the recent GTS TAC data ('T')
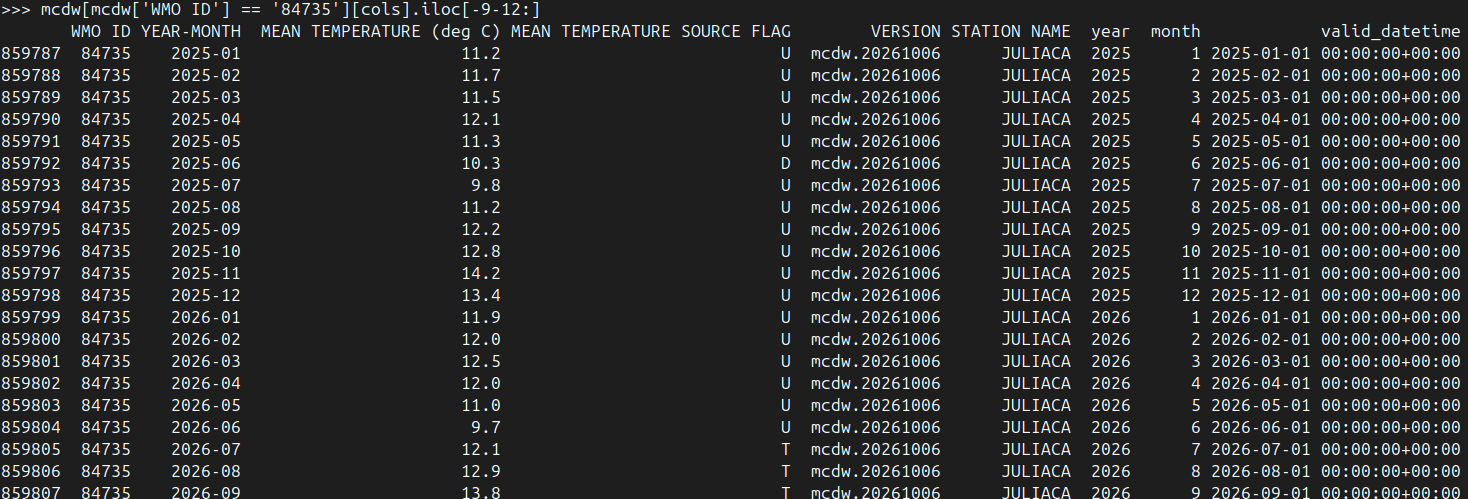
and the ghcnm qcu (unhomogenized); 'P' == the climat-ncdc and '|' == climat-uk wherein you can see the discrepancies from above:

At the moment September looks to definitely be below 2023 based on the medium range, but it probably will end up being ranked 2nd by anomaly (not far from August's anomaly).

MTD Anomaly from medium range super ensemble up until Sept 16 has some familiar hot spots like August did (El Nino and central US):

Looking at EC46 SST forecasts for El Nino, the absolute values for NINO1+2 and NINO4, do increase in September (especially the latter half of the month) while NINO3 is mostly flat with a very small increase. Consequentially the daily RONI only shows a very modest increase in September, with it being mostly flat for the first half
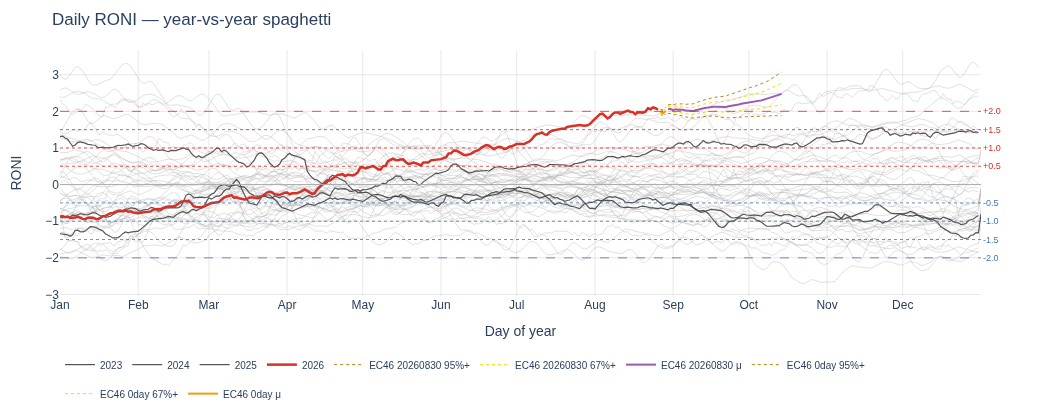
These last two weeks were also the first time the models validated as too warm relative to observations (blue == model predicted too cold):

So based on all this we probably should expect the latter half of September to be slightly warmer than climo (beyond what EC46 suggests).