Data is currently at
https://data.giss.nasa.gov/gistemp/tabledata_v4/GLB.Ts+dSST.csv
or
https://data.giss.nasa.gov/gistemp/tabledata_v4/GLB.Ts+dSST.txt
(or such updated location for this Gistemp v4 LOTI data)
January 2024 might show as 124 in hundredths of a degree C, this is +1.24C above the 1951-1980 base period. If it shows as 1.22 then it is in degrees i.e. 1.22C. Same logic/interpretation as this will be applied.
If the version or base period changes then I will consult with traders over what is best way for any such change to have least effect on betting positions or consider N/A if it is unclear what the sensible least effect resolution should be.
Numbers expected to be displayed to hundredth of a degree. The extra digit used here is to ensure understanding that +1.20C resolves to an exceed 1.195C option.
Resolves per first update seen by me or posted as long, as there is no reason to think data shown is in error. If there is reason to think there may be an error then resolution will be delayed at least 24 hours. Minor later update should not cause a need to re-resolve.
 1,000
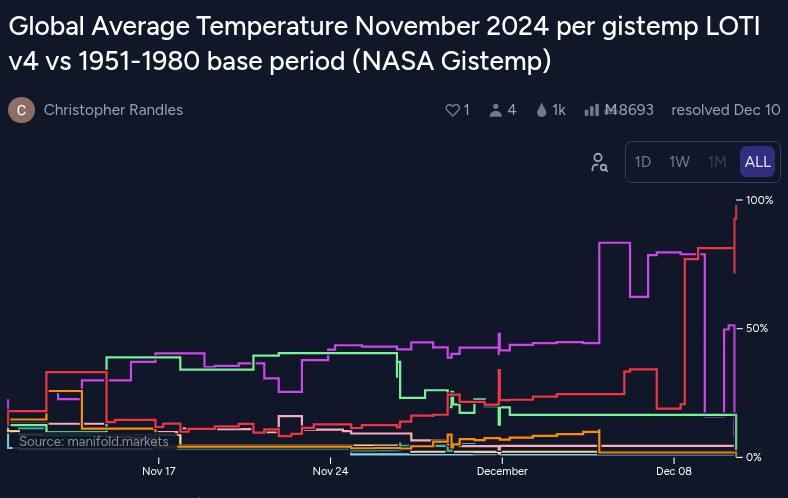
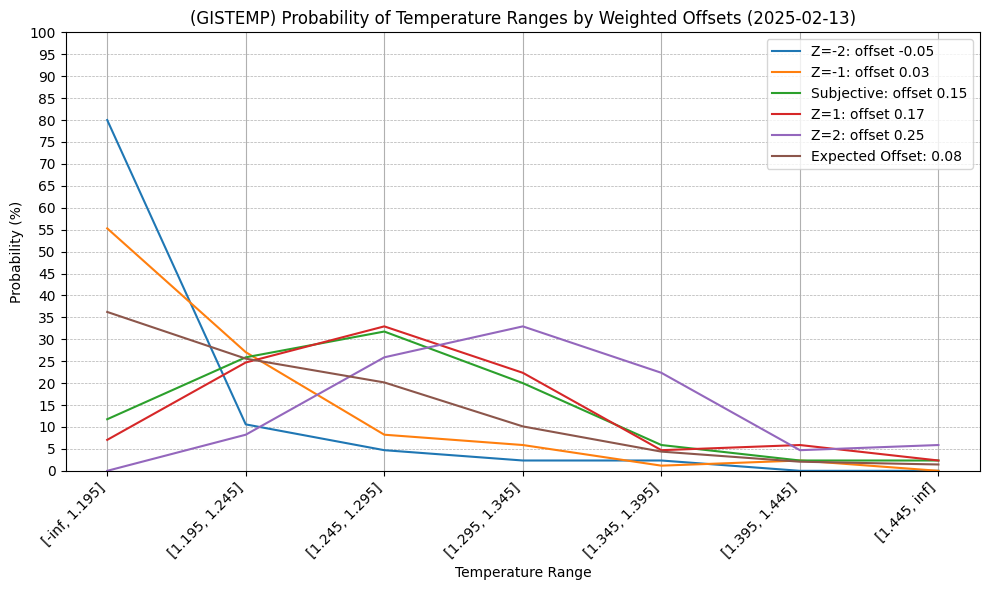
1,000I put up some decent sized bets early this time. Only expecting really at this point the anomaly to be less than the January 2025 anomaly, so the first four bins I weight roughly equally (fourth slightly less) and the last 3 much less roughly the same as well; I'll see if this rougher and more aggressive prediction pays out this time.
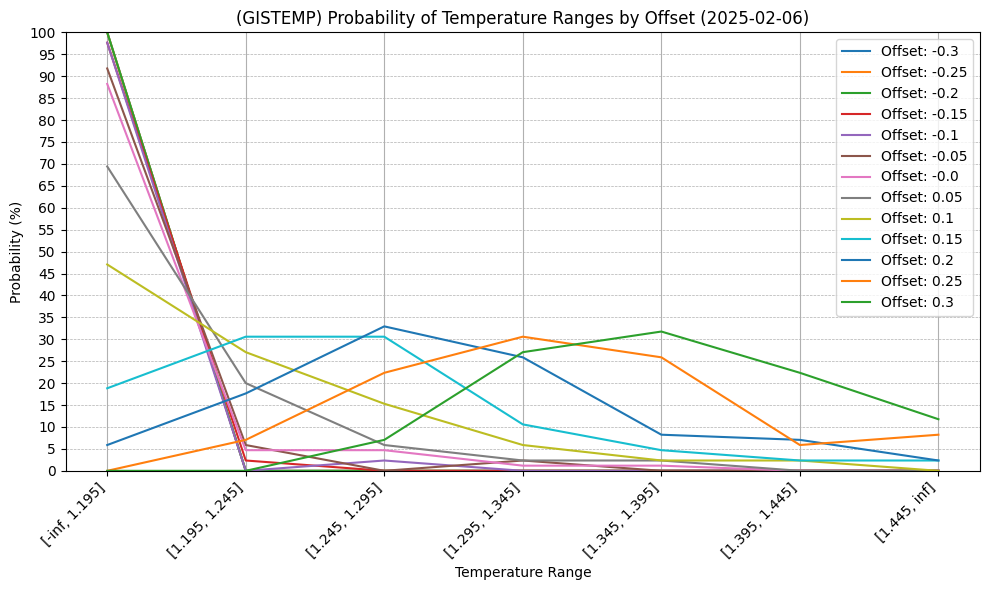
Included a wide range of offsets this time (for reference for confidence) and placed bets considered assuming meta-prediction that the rest of the month will need to be offset on the order of +0.1 to 0.2 (predicting GEFS-BC temps will continue under-predicting ERA5 temps in my model); this is a bit of a gamble but I do recall last month I was predicting on order of ~1.2C early in January and it ended up being ~1.36C, as the error for last 15 days has been under a bit with quite a few 0.1 to 0.15 points).
[Notes for self]:
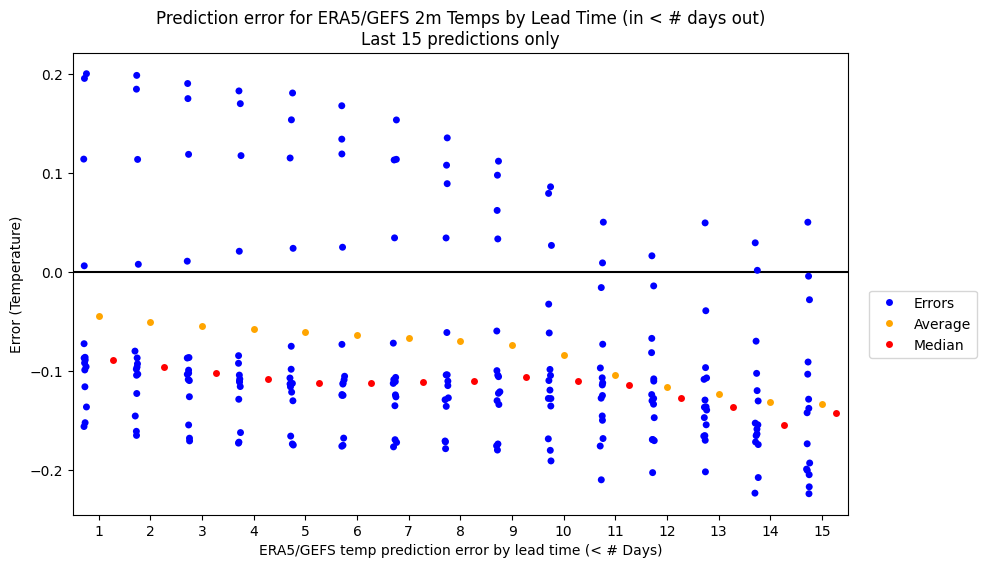
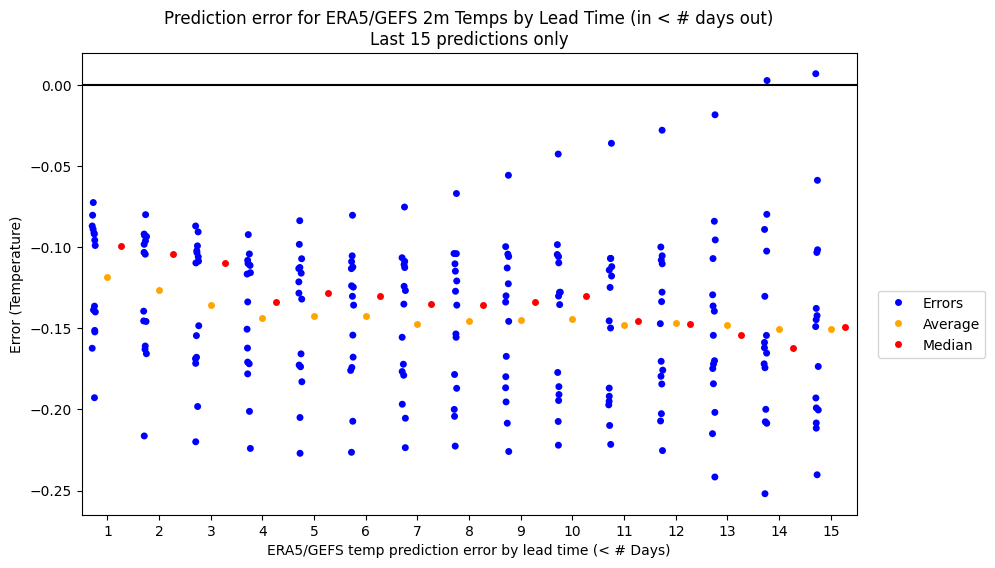
In order to make my meta-prediction estimates for what offset to use slightly more objective I now am experimenting with using an Ornstein-Uhlenbeck process with drift on the historical (1 day) lead time prediction errors (adjusted GEFS-BC - ERA5) I've collected since last June, since runs where the error drifts are common in my predictions.
As of 2025-02-11, theta, mu, sigma are [ 0.06768922 -0.00105138 0.04794998]
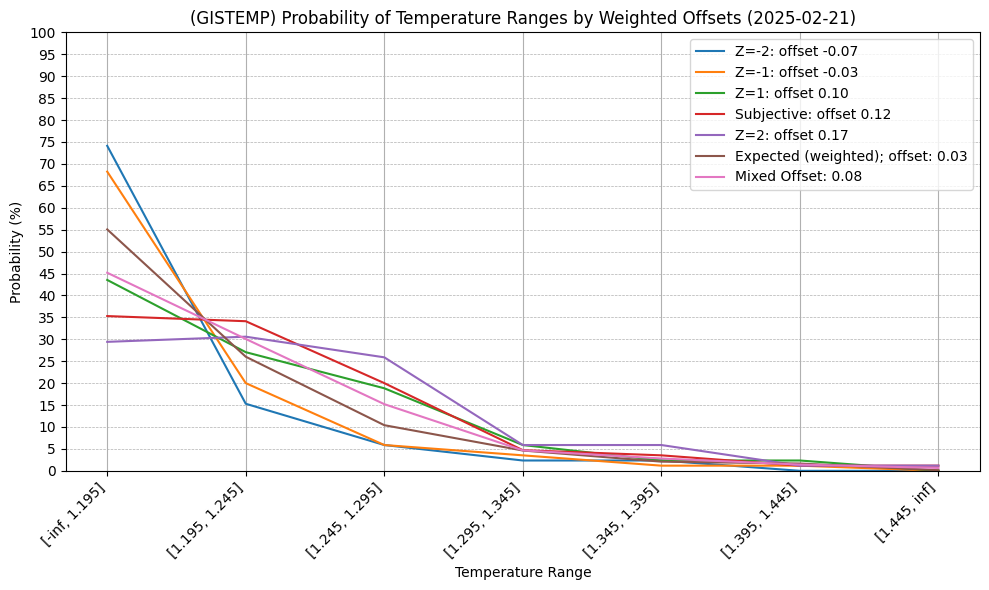
In order not to use a recent noisy, 1-day error as the input I take the maximum resulting average from a variable window size from the last 3-10 days of 1-day errors (this is all very ad-hoc) as a proxy. For instance, it gives an expected error of ~-0.08 in the latest run. I use that as an objective estimate for the offset (for the nearest 0.025 bin) of remaining days in February combined with a subjective offset (chosen +0.15) and take the average of the two probabilities.
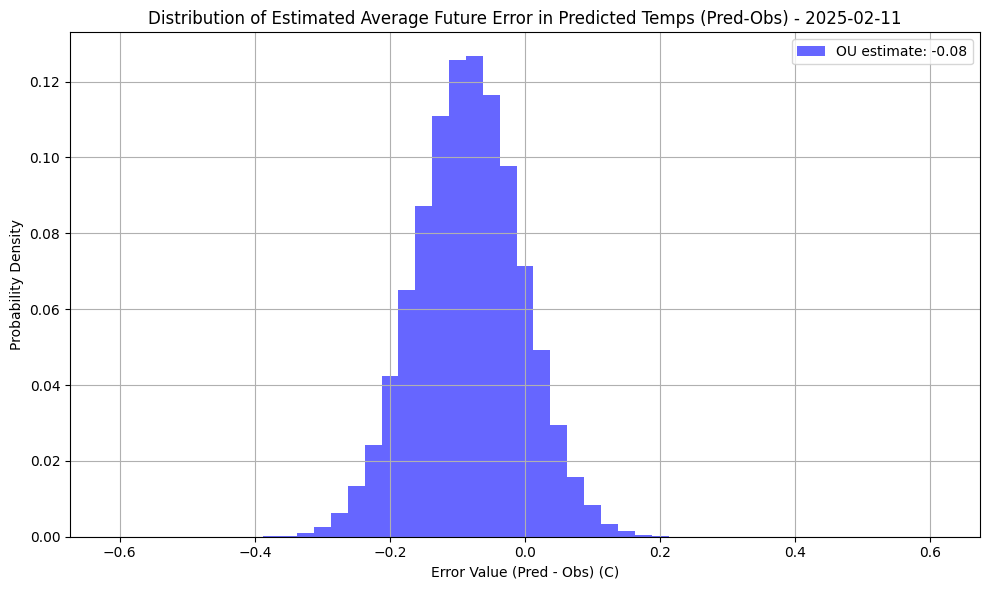
It's fairly wide since there are nearly 3 weeks left of ERA5 data to fill in.
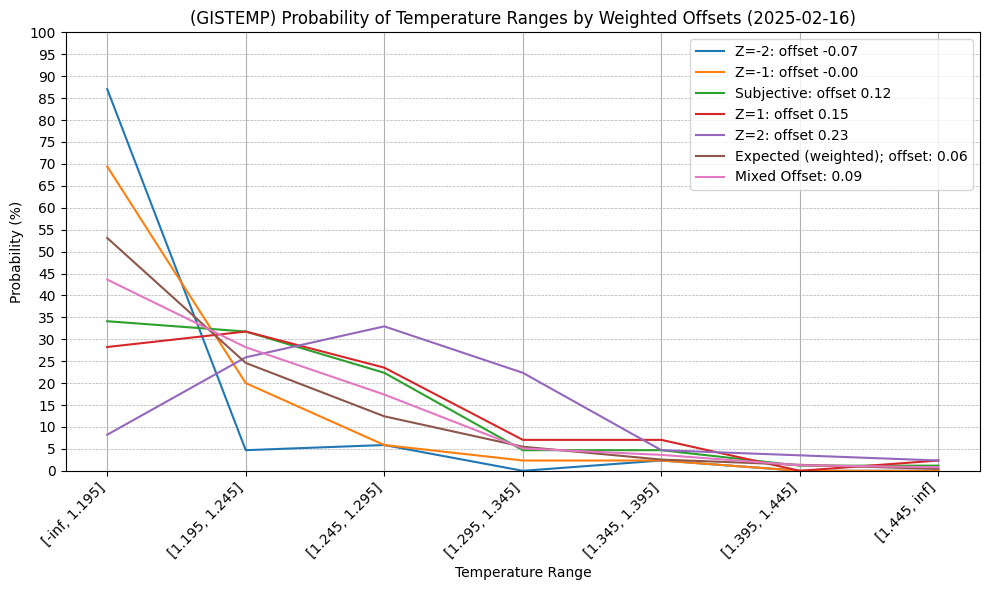
As such I also have added a modified chart that provides (indirect) estimates based on these simulations (using the nearest 0.025 estimates for the offsets). The Z-score probabilities are the Z=+-1, 2 for the offset distribution, not the actual distribution (which would be different from all these different ad-hoc methods I am combining) but I am taking them as an experimental proxy.
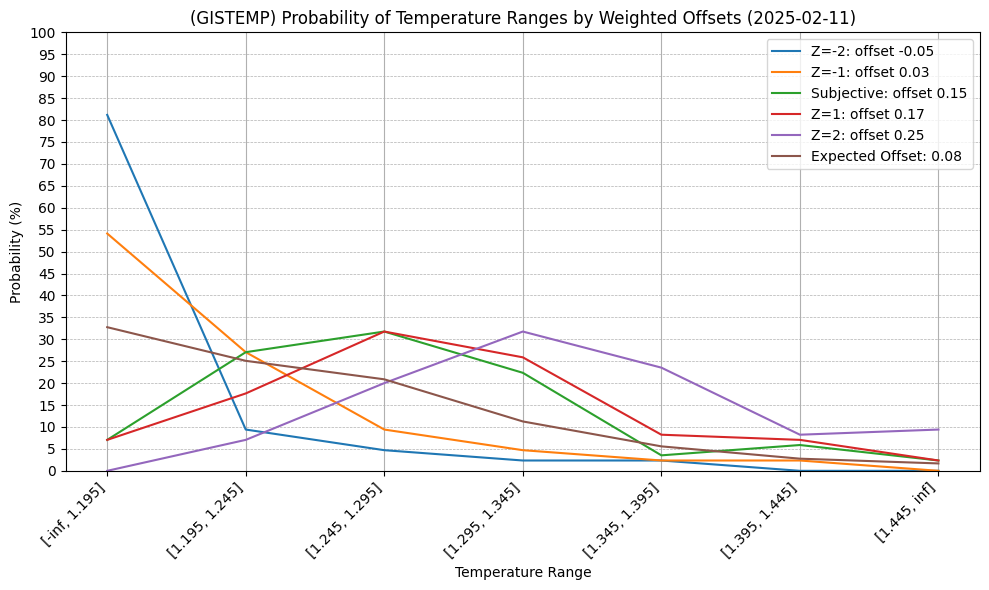
It predicts at least that mean reversion won't bring down the average error for the rest of the month all the way to 0 which makes intuitive sense given the recent error trend (which does seem to show a slight reversion), but this means there is still alot of uncertainty in the remainder of the month.
Unfortunately, it now makes much messier my earlier chart that just includes (some of the) offsets:
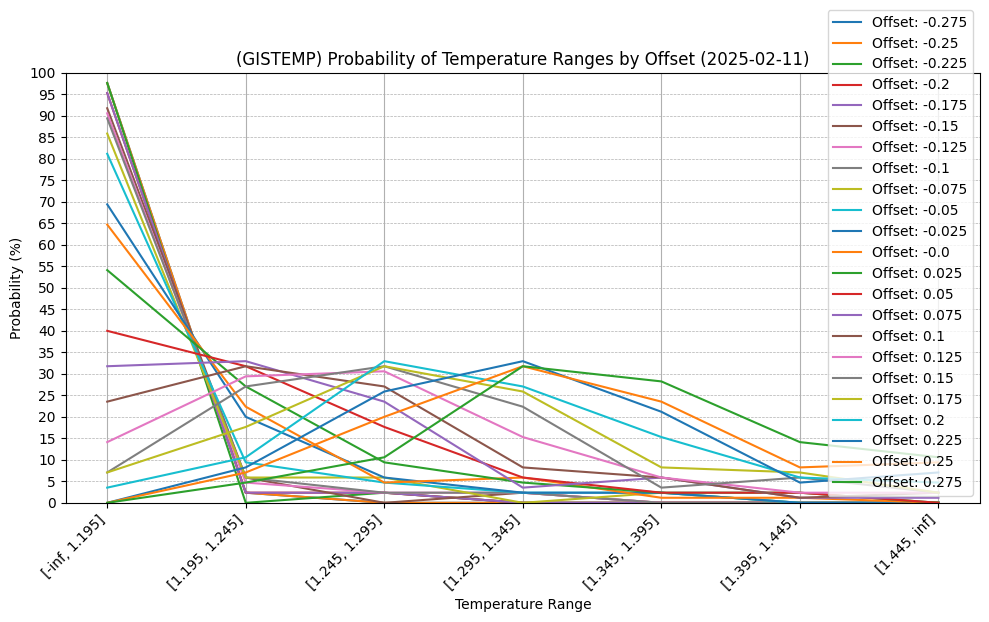
First day not requiring any extrapolation of GEFS data to fill in remainder month and now the first three bins look fairly even again after taking the average between objective/subjective estimates:
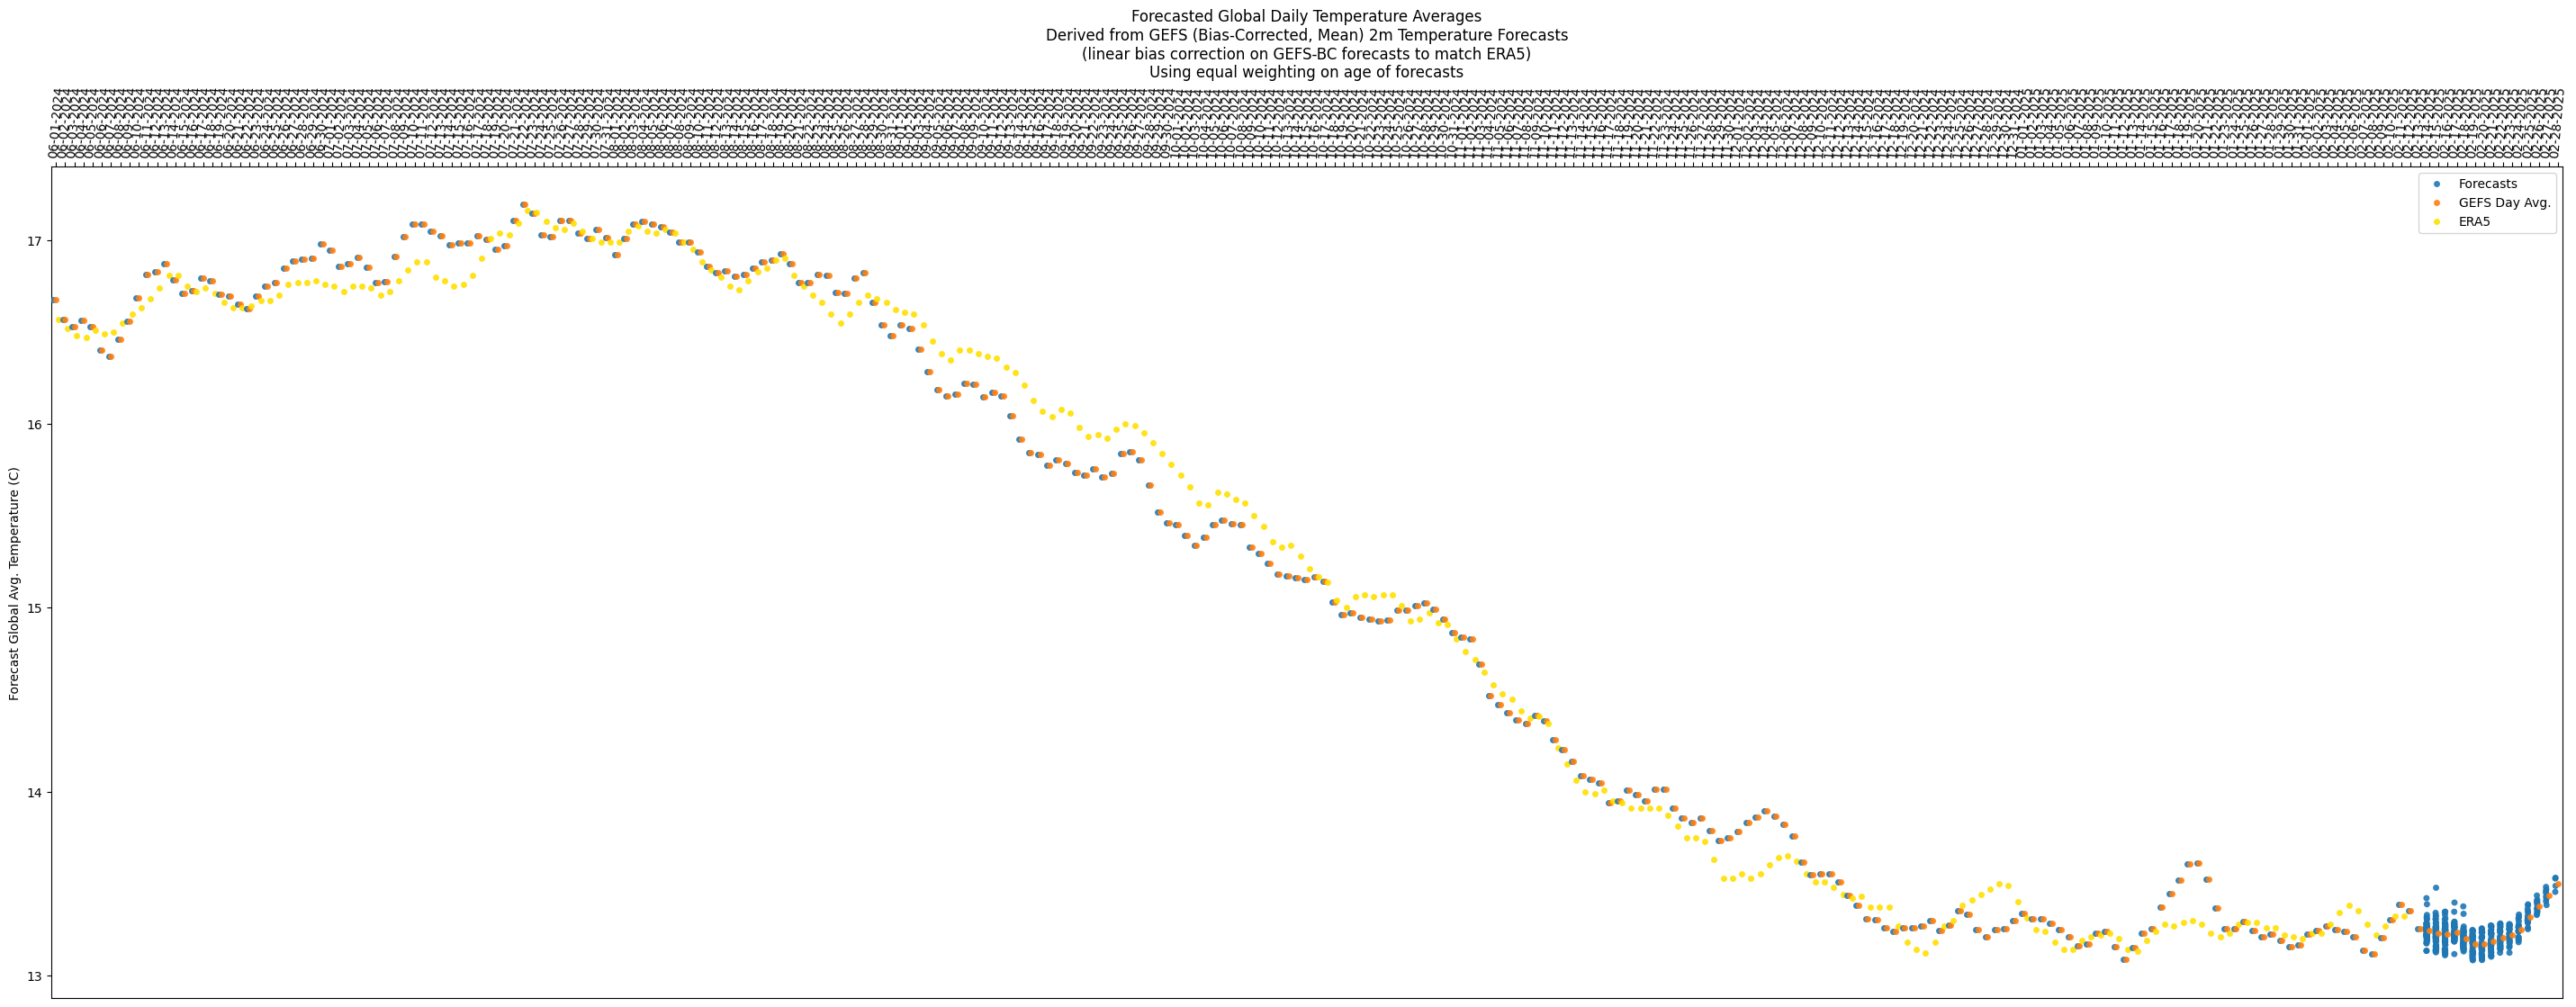
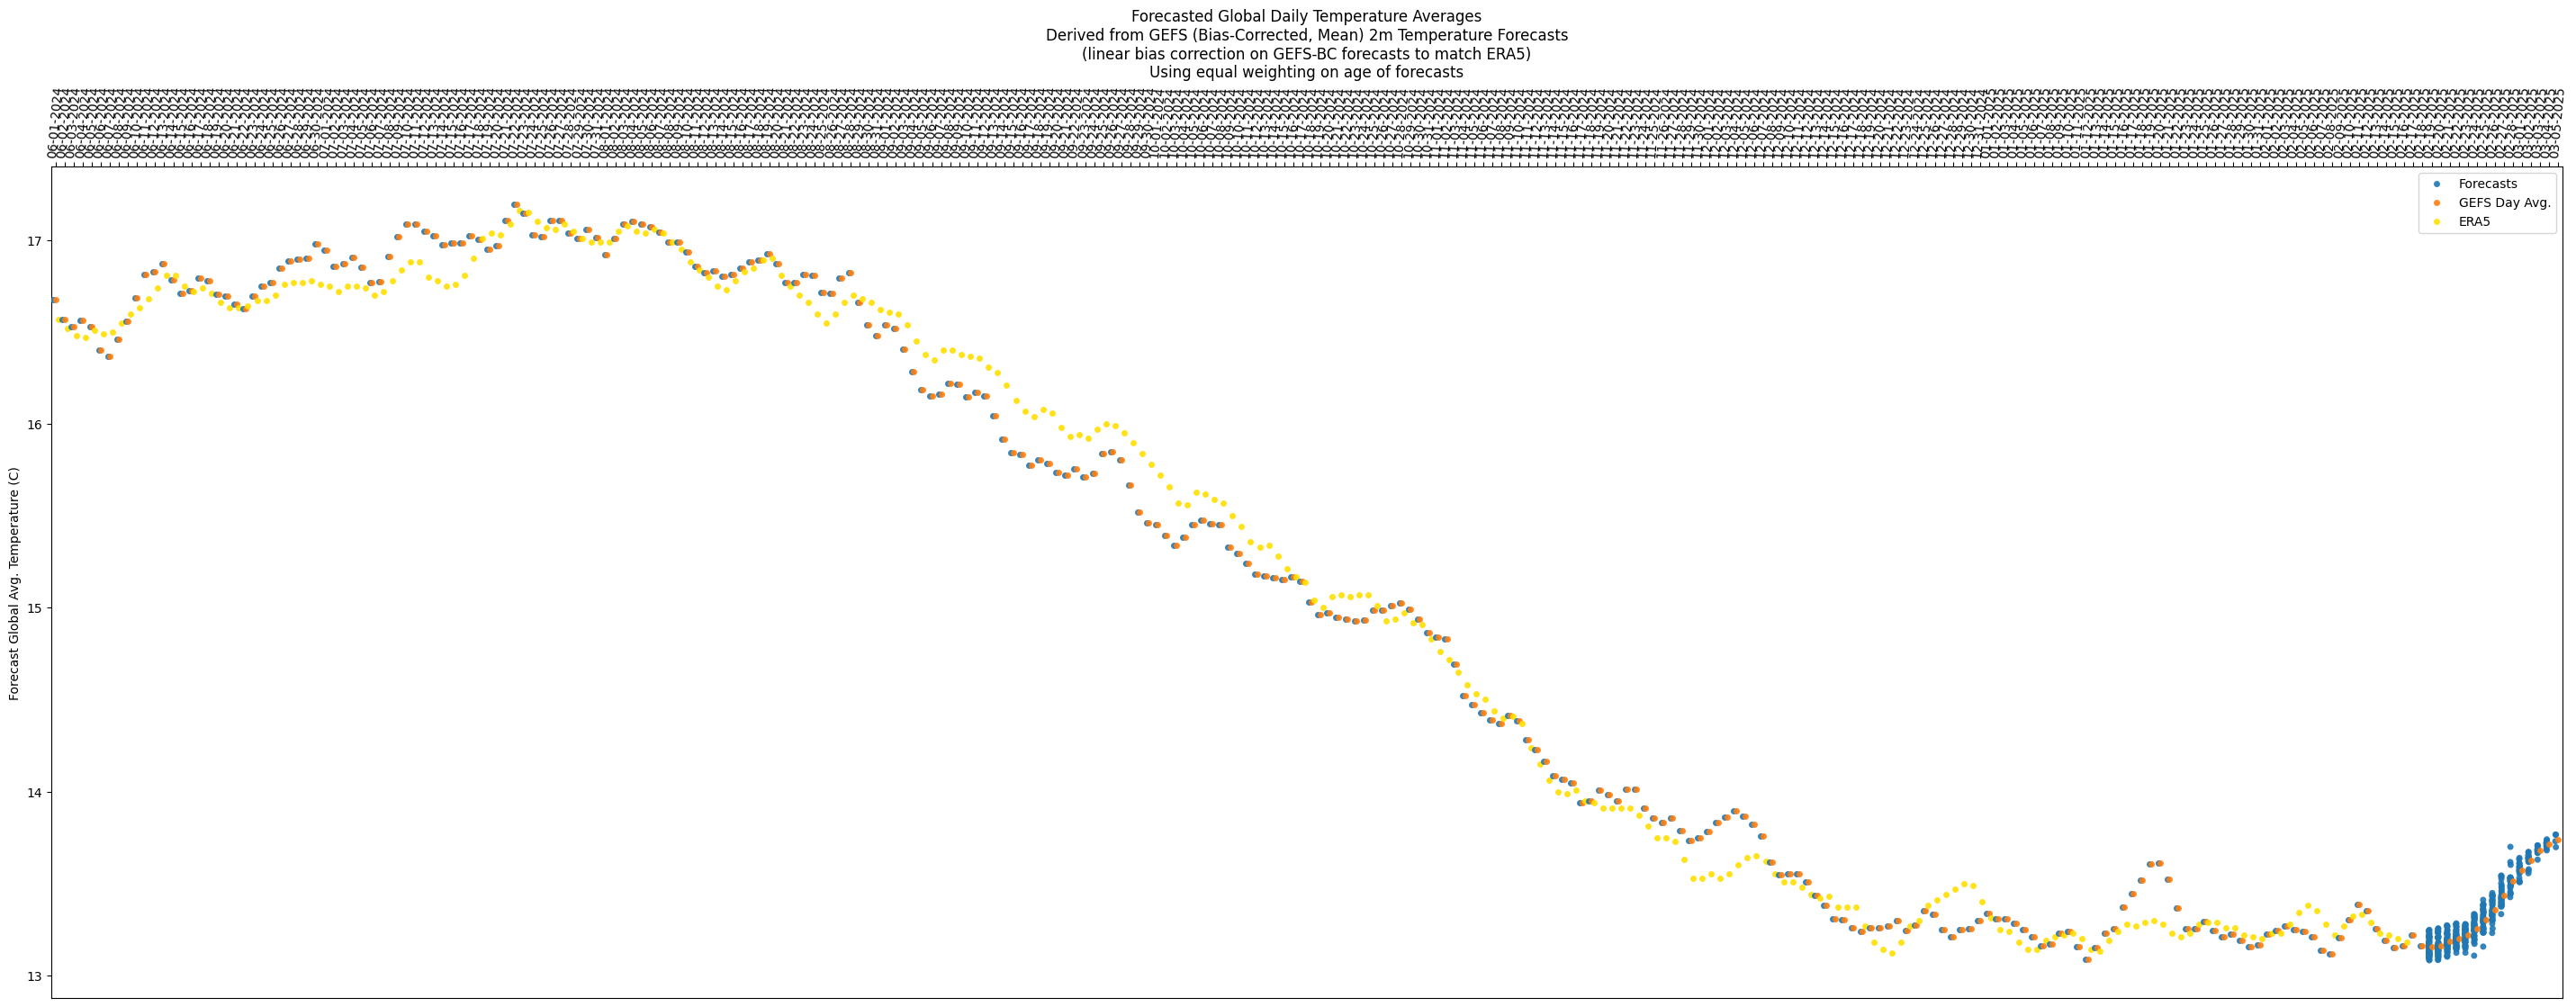
Temps look like it might jump up/down around unpredictably a bit for next week (looks like might not go up too much and stay relatively flat), and for the last week it looks like there is a steady rising trend:
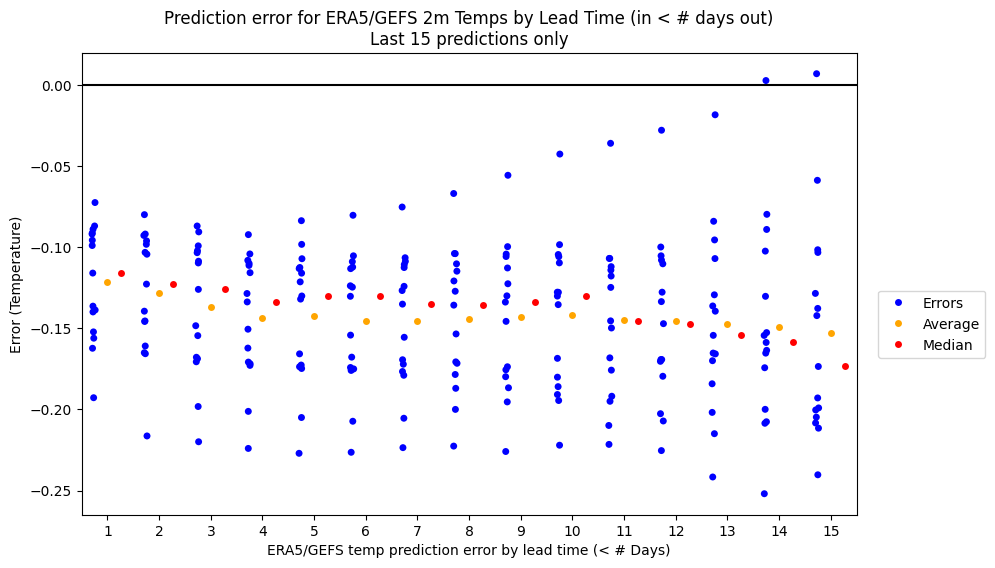
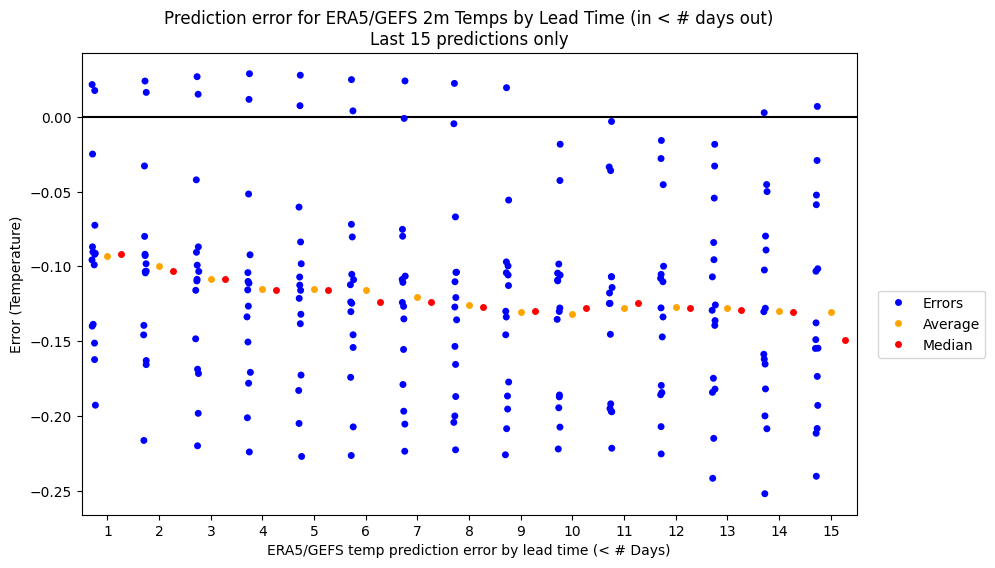
Looks like the slow trend towards mean reversion of the (average) error is continuing:
If the first bin ends up being correct prediction, I'm going to have to start weighting the objective higher than the subjective next month, and vice-versa.
Last couple days of temps from ERA5 have caused the error in the GEFS-ERA5 predictions to revert to near the mean (on the opposite sign too) and I've adjusted my subjective estimate slightly downwards accordingly for the rest of the month as this is a tiny bit suprising:
Now, roughly the first two bins look most likely at the moment, but with the size of the other bins being narrower, it means the second bin gets significantly less probability individually. Still plenty of days left for this to shift significantly.
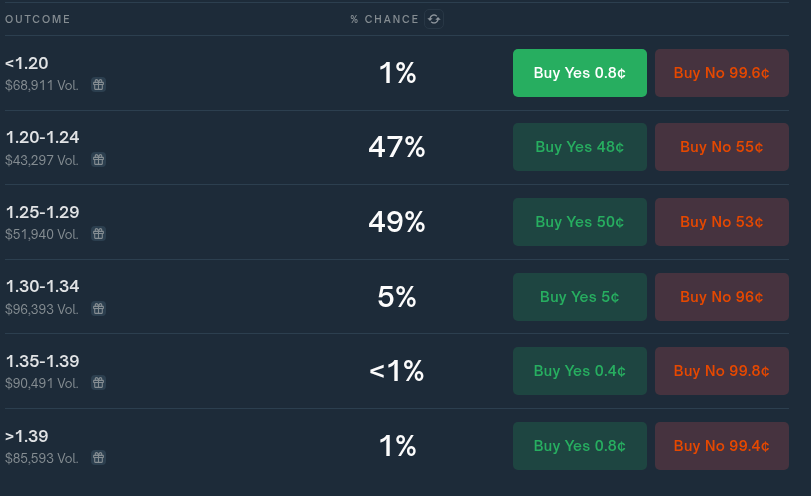
Comparing with polymarket, this time the bins do mostly match, at least the relevant ones do (the last two bins in this question are squashed into the last bin for polymarket):
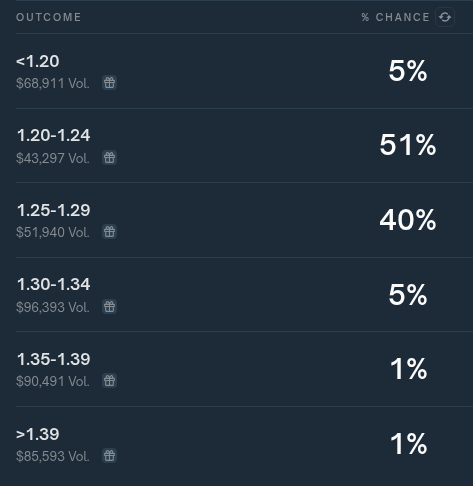
Per polymarket, not sure what is with the high percents in only two bins (90% of the probability allocated with more than 10+ days left), and further still perplexed why the first bin (<1.20) has such a low % compared to the third bin (1.25-1.29).
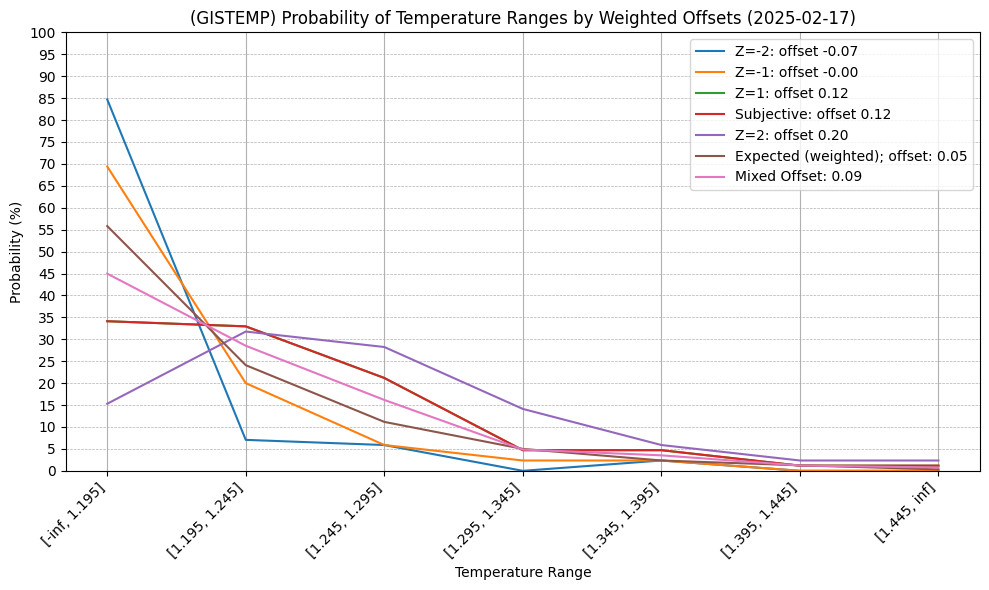
Switched to using my own (unrounded) output from gistemp for the gistemp data as the input to the model rather than using the official rounded data for slightly better accuracy (in comparing yesterday's and today's run with the different datasets it only seems to shift the bins 2-3% -- might be marginally worth it).
Comparison of run today with different gistemp data sets:
(official rounded)
(unofficial unrounded)
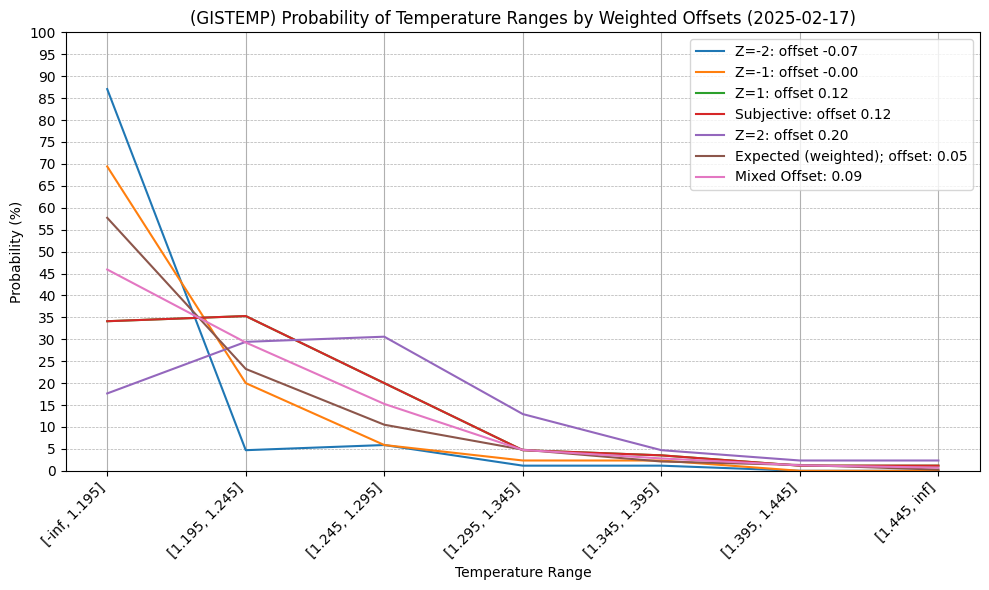
Polymarket continues to be way overconfident IMO. First bin looks extremely cheap, and third bin likely overpriced:
@LeonardoParaiso I wish i knew. Speculatively, maybe because the first half of the month was relatively warm or January was warmer than expected so February might be as well (this is a prior I started off with as well), or maybe they are using different forecast data (I'm using GEFS-BC as a starting point); I don't know what a ECMWF forecast looks like for the rest of the month. If they are using entirely observations and no forecasts this might explain it but I doubt that it is so simple a story...
The latest error for my model right now though has been reverting towards 0 (and if anything the predictions slightly warmer than observations for the last few days) which implies that prior looks wrong at the moment.
Forecast does show this plataeu ending before the end of the month though with not too much spread in the rise:
Without the major holders posting their methodology I can only speculate wildly on their methodologies. Right now to me from my objective estimates (OU) though it looks nearer to 1.18 or 1.19, rather than 1.26 or 1.27 which is what Polymarket's probabilities seem to imply.
In reality this is only a bit more than ~ 1 std. dev from my own guesses, but is also not too far from the data uncertainty itself so it's difficult to find any fault in the underlying meaning behind these probabilities only with the methodologies themselves.
@parhizj Yes observations look like 2nd warmest Feb so far which puts it in 1.36 to 1.43 range but it will have to warm a lot quickly to avoid dropping below 2nd warmest. 3rd warmest Feb was +1.24C; could easily end up below that.
Often warms from Jan to Feb and Jan at 1.36. La Nina makes drop more likely and 2021 did drop 0.17C so if there was 0.17C drop this year that would be 1.19. Maybe they think beating that drop is unlikely due to stronger La Nina developing late 2020.
Not sure I would want to rely on above to say temperature anomaly won't drop much. Particularly if unusual unexpected warmth is due to prolonged El Nino effects that might disappear after a couple of months with Nino 3.4 below -0.6.
Polymarket traders may have better methods or could be wrong/worse and overconfident. Takes some time to gather data to tell.
@LeonardoParaiso First or second bin is still my guess.First bin is marginally likely now though (assumes prediction error on remainder of month temps is on average is fairly close to zero (OU producing errors of -0.02 to -0.03 for last few days)).
@parhizj While polymarket has increased odds for 1.25 to 1.29 to 70%. How is your performance when going against polymarket consensus?
SST getting surprisingly high again despite La Nina?
https://climatereanalyzer.org/clim/sst_daily/?dm_id=world2
@ChristopherRandles No idea. There are at least three distinct methodologies applied to this market based on timing. (Before end of month, 2-7 days after end of month when we have ghcnm but not ersst, and after we have both ersst and multiple ghcnm).
Part of the problem is the major bettors might change in poly markets over time that have better methods or their incentives might change depending on market probs. It would be good to check 7 days prior to each month and compare to see what’s going on. I’ll try to do it later tonight.
Prior to end of month I think I might be better if I had to guess.
But aenews and some others might be better after month is over sometimes (latter two cases), and I have noteworthy recollections of failing sometimes at guessing which “run” (which ghcnm set) they end up using for the official data .
Looked at Last 7 markets on poly.
For your specific question about "consensus" in none of the polymarkets is a question at 70%, 7 days before the end of the month.
Highest is roughly 55% (maybe peaking at 60% around then) a few times. Thus I think my point about it being overconfident in a single bin I think is still warranted despite the below analysis, especially since the bin isn't a wide lower/upper bin (at the very least I can say it is abnormally high even for its own markets).
The below chart is kind of unique, but from the positive slope you can identify when the correct bin is dominant in the market. For instance for Oct'24, on the 6th last day of Oct (Oct 26) was the only day where the dominant bin wasn't correct (all other days 1.29-1.34 was dominant).
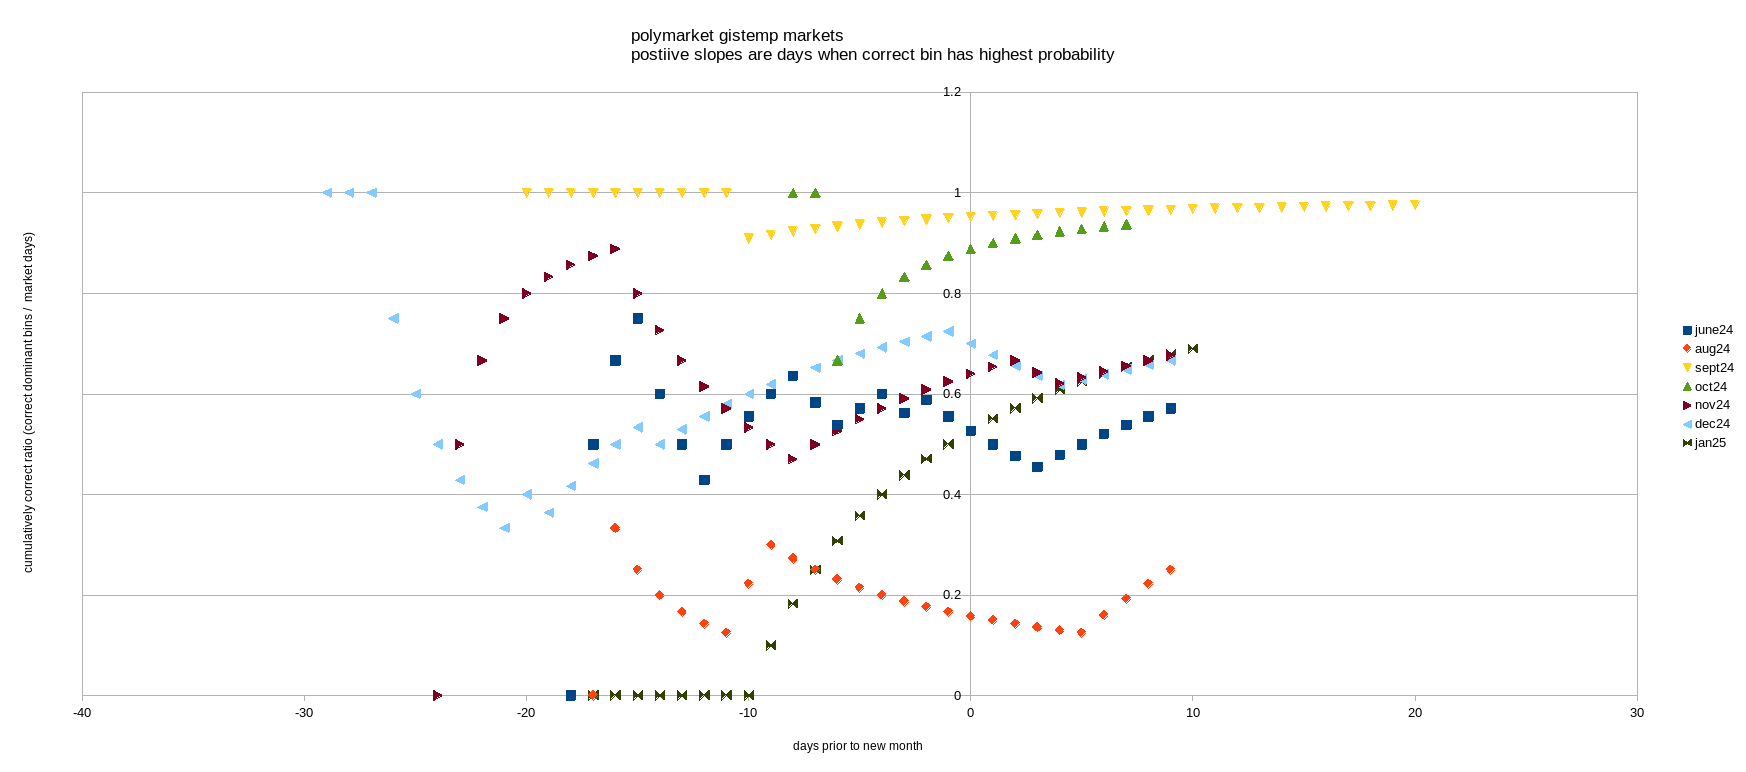
5/7 polymarkets had the correct bin for most of the week before the month concluded (a couple flip the other way afterwards temporarily). (No July Poly)
Keep in mind many of these markets are very much apples and oranges in terms of direct comparisons between polymarkets to manifold markets as the bins are almost always different, but the record overall for manifold isn't good for the week prior. For instance three of polymarket's bins just have widths > 0.5 (June has 0.7 wide bins. Sept, Oct has 0.6 wide bins).
Subjective judgment last week of month:
Polymarket: 5/7 Pass
Manifold: 2/8 Pass (Eep! 😭 )
Polymarket markets with bins consistently correct dominant bin ~week prior:
2024
June Fail
July MISSING
Aug Fail
Sept Pass
Oct Pass
Nov Pass
Dec Pass
2025
Jan Pass
Manifold markets with bins consistently correct dominant bin ~week prior:
2024
June Fail
July Fail
Aug Pass
Sept Fail
Oct Fail
Nov Fail
Dec Fail
2025
Jan Pass
Before you conclude wow Polymarket is so much better, you should also pay attention to the few days AFTER the month is finished where a couple of those 5/7 "Passes" have the wrong bin dominant for a couple days.
Then I just looked at the last predictions I posted in the comments by date that weren't based off of GISTEMP calculations (modeling from mostly ERA5 data):
My temp predictions with all or almost all of month data in:
Month (Pred - Obs) (data from approx +X days relative to next month's 1st day)
June24 +0.05 (+1) (i.e. July 2)
July -0.02 (+1) (From July+ I modify the model: ERA5 debiasing by month when possible using a linear model, year otherwise)
Aug +0.01 (+0)
Sept -0.03 (-1)
Aug -0.01 (+3)
Nov -0.02 (-1)
Dec +0.03 (+1)
Jan25 0.0 (-3)
For July onwards my error is very low in absolute terms once the final ERA5 data is in:
Average error July+ is: -0.006
std dev is ~ 0.021).
You can see that even for a prediction at the end of the month with the std dev almost half the width of the manifold bins (0.05 wide bins) it is only when I am exceedingly lucky the middle or point prediction ends up in the center of the bin that I should be extremely confident of which bin it will end up in (I have probably not bet as well as I could have with regards to this in the past); slightly away from that center and it becomes more difficult.
As for predicting the temps ~7 days out which is even further challenging, this month I'm using an OU model to hopefully make my metapredictions better for the remainder of the month but the std. dev is still large for the remaining temps (~0.05 C), but at least now I hope its slightly better quantified rather than just guessing purely subjectively based on a recent run.
@parhizj Lmao the manifold stats 😂
Seeing the mess that happened after the months of december and november ended, i'm less inclined to believe poly traders.
@LeonardoParaiso To be self serving I don't think it's like giving an F grade in school so it may look a lot worse than it actually is. As they are probabilities it just means you can't clamp to CORRECT/INCORRECT based on the dominant probabilities; I just did this as a rough measure.
I think it more accurately reflects that 0.5 bins are actually too narrow for that type of correct/incorrect assertion for that phase of prediction (meaning prior to actual GISTEMP runs days before the data is released 0.05 wide bins are too narrow to reach very high probabilities like 70%+; doing so I think is overconfidence -- the exceptions in these markets are when the bins are the one-sided bins that are much wider than 0.05 and the data supports it.
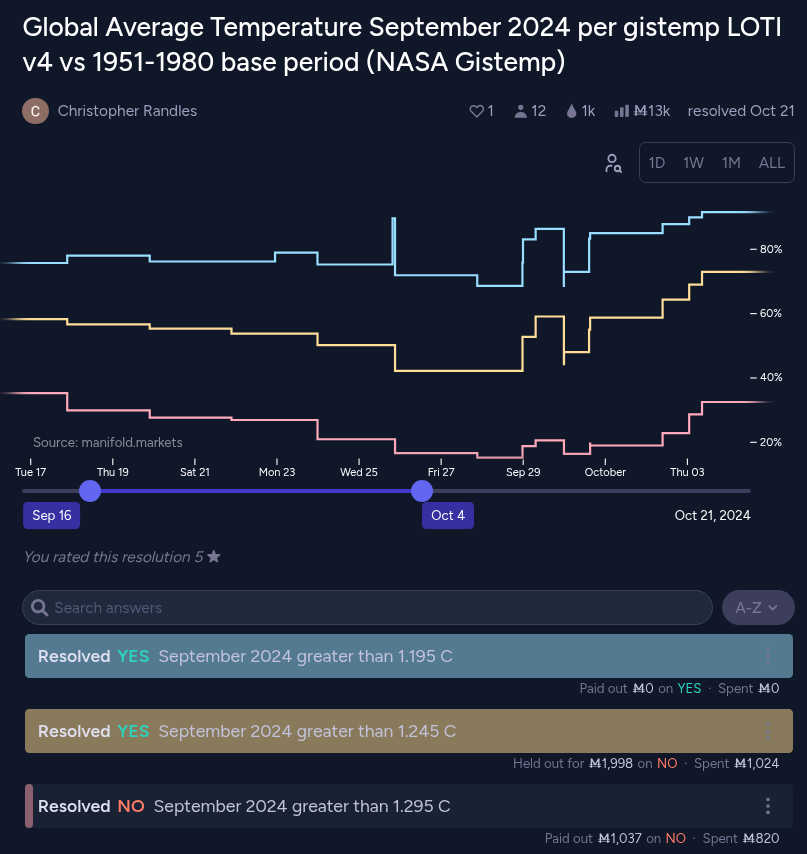
https://manifold.markets/ChristopherRandles/global-average-temperature-septembe
I.e. here is a market where the probabilties I demonstrate the issue.
For instance aenews did post one of his predictions (https://manifold.markets/ChristopherRandles/global-average-temperature-septembe#eas6xyjqevw) shortly after the month ends as 1.27 +- 0.06 (this was very close to the actual result 1.26, an error of +0.01). I posted a prediction of 1.23 +- 0.075 (an error of -0.03 ).
Converting to closed sided 'bins', for the end of the month the dominant bin flips between 1.25-1.29 and 1.20-1.24 (the dominant being the thickest space between the two lines) but not by a huge amount as you can see the thickness between the blue-yellow and yellow-red lines are not too disparate (this reflects the narrowness of the bin); a big caveat though is only 2 of the 3 relevant bins are double sided (so the < 1.20 bin reached 31% at one point but not dominant; this bin being one-sided explains the large value).
Based on my own estimates I might have have disagreed with about >1.245 being bet up to 73% as a one sided bin based on my own prediction, but as a double sided bin (1.25-1.29) it only gets as high as ~40% despite nearly being in the middle of the 1.25-1.29 range. I made a much larger prediction mistake a few weeks after the month finished, unrelated to this actual model (betting on what dataset/run the people at NASA would use after the hurricane and worse, being overconfident as such).
In this respect I think the double-sided bin questions that are exclusive (that @ChristopherRandles made later on starting in November) that matches polymarket type better reveals any overfidence (compared to the single sided multi) and the uncertainty that should be in these narrow bins. I.e. in November none of the bins exceeds 50% prior to the GISTEMP runs (after the gistemp data became available is a different matter).