
resolves YES if more than 100 days this Atlantic hurricane season June 1 - November 30 there is an active named storm.
For base rates see here.
 1,000
1,000🏅 Top traders
| # | Trader | Total profit |
|---|---|---|
| 1 | Ṁ113 | |
| 2 | Ṁ63 | |
| 3 | Ṁ18 | |
| 4 | Ṁ17 | |
| 5 | Ṁ17 |
People are also trading
It’s impossible for this to resolve Yes anymore as there is only 36 hours left and the current number of NSD for the season is 99-1.25=97.75 ( since the unnamed storm falls out of the date range included in storms in the description):
https://tropical.atmos.colostate.edu/Realtime/index.php?loc=northatlantic
Edit: Removed
Edit: removed
Edit: three models, GFS,CMC,ECM (12Z) show genesis in the Carribean (NHC has upgraded to 70% in 7 days)
==============================================================================
AL BASIN
==============================================================================
CMC Init: 2023-11-13T12:00:00
    Start valid_time: 2023-11-17T12:00:00
    AL Basin, Latitude (deg:):   13.4, Longitude (deg):  -78.7, MSLP (hPa): 1005.1, ~ROCI (km):  672
        850 RV MAX (*10^-5 1/s):  51.55, 250-850 hPa Thickness (m): 9554.80, 925 hPa WS MAX (m/s):  21.93
        10m WS MAX (knots) in ~ROCI:   30.6, Isobar delta (hPa) (MSLP for OCI - minimum):   4
    Last disturbance is before end of model run
    Named Storm Days: 0.75
    ACE: 0.4
    10m WS MAX (knots) in ~ROCI: 35.1
GFS Init: 2023-11-13T12:00:00
    Start valid_time: 2023-11-15T18:00:00
    AL Basin, Latitude (deg:):   14.0, Longitude (deg):  -78.8, MSLP (hPa): 1004.7, ~ROCI (km):  278
        850 RV MAX (*10^-5 1/s):  33.85, 250-850 hPa Thickness (m): 9549.64, 925 hPa WS MAX (m/s):  20.28
        10m WS MAX (knots) in ~ROCI:   30.4, Isobar delta (hPa) (MSLP for OCI - minimum):   3
    Last disturbance is before end of model run
    Named Storm Days: 3.50
    ACE: 3.3
    10m WS MAX (knots) in ~ROCI: 60.3
ECM Init: 2023-11-13T12:00:00
    Start valid_time: 2023-11-18T00:00:00
    AL Basin, Latitude (deg:):   16.0, Longitude (deg):  -76.8, MSLP (hPa): 1002.5, ~ROCI (km):  415
        850 RV MAX (*10^-5 1/s):  30.40, 250-850 hPa Thickness (m): 9552.83, 925 hPa WS MAX (m/s):  18.27
        10m WS MAX (knots) in ~ROCI:   29.2, Isobar delta (hPa) (MSLP for OCI - minimum):   5
    Last disturbance is before end of model run
    Named Storm Days: 1.50
    ACE: 1.0
    10m WS MAX (knots) in ~ROCI: 46.3
GFS Init: 2023-11-13T06:00:00
    Start valid_time: 2023-11-15T18:00:00
    AL Basin, Latitude (deg:):   13.5, Longitude (deg):  -81.2, MSLP (hPa): 1004.0, ~ROCI (km):  164
        850 RV MAX (*10^-5 1/s):  53.88, 250-850 hPa Thickness (m): 9542.51, 925 hPa WS MAX (m/s):  17.14
        10m WS MAX (knots) in ~ROCI:   23.9, Isobar delta (hPa) (MSLP for OCI - minimum):   3
    Last disturbance is before end of model run
    Named Storm Days: 2.25
    ACE: 2.1
    10m WS MAX (knots) in ~ROCI: 63.6
CMC Init: 2023-11-13T00:00:00
    Start valid_time: 2023-11-18T06:00:00
    AL Basin, Latitude (deg:):   14.9, Longitude (deg):  -78.9, MSLP (hPa): 1005.5, ~ROCI (km):  544
        850 RV MAX (*10^-5 1/s):  28.20, 250-850 hPa Thickness (m): 9536.48, 925 hPa WS MAX (m/s):  22.49
        10m WS MAX (knots) in ~ROCI:   30.9, Isobar delta (hPa) (MSLP for OCI - minimum):   3
    Last disturbance is before end of model run
    Named Storm Days: 0.00
    ACE: 0.0
    10m WS MAX (knots) in ~ROCI: 33.6
CMC Init: 2023-11-13T00:00:00
    Start valid_time: 2023-11-20T00:00:00
    AL Basin, Latitude (deg:):   22.2, Longitude (deg):  -68.5, MSLP (hPa): 1003.7, ~ROCI (km):  322
        850 RV MAX (*10^-5 1/s):  72.13, 250-850 hPa Thickness (m): 9568.71, 925 hPa WS MAX (m/s):  22.32
        10m WS MAX (knots) in ~ROCI:   27.8, Isobar delta (hPa) (MSLP for OCI - minimum):   4
    Last disturbance is before end of model run
    Named Storm Days: 0.00
    ACE: 0.0
    10m WS MAX (knots) in ~ROCI: 30.0
GFS Init: 2023-11-13T00:00:00
    Start valid_time: 2023-11-15T12:00:00
    AL Basin, Latitude (deg:):   15.5, Longitude (deg):  -81.2, MSLP (hPa): 1004.8, ~ROCI (km):  245
        850 RV MAX (*10^-5 1/s):  61.40, 250-850 hPa Thickness (m): 9542.69, 925 hPa WS MAX (m/s):  16.41
        10m WS MAX (knots) in ~ROCI:   26.6, Isobar delta (hPa) (MSLP for OCI - minimum):   4
    Last disturbance is before end of model run
    Named Storm Days: 2.50
    ACE: 2.2
    10m WS MAX (knots) in ~ROCI: 64.5
ECM Init: 2023-11-13T00:00:00
    Start valid_time: 2023-11-17T18:00:00
    AL Basin, Latitude (deg:):   15.2, Longitude (deg):  -78.0, MSLP (hPa): 1004.2, ~ROCI (km):  388
        850 RV MAX (*10^-5 1/s):  20.48, 250-850 hPa Thickness (m): 9534.23, 925 hPa WS MAX (m/s):  18.00
        10m WS MAX (knots) in ~ROCI:   27.2, Isobar delta (hPa) (MSLP for OCI - minimum):   3
    Last disturbance is before end of model run
    Named Storm Days: 0.00
    ACE: 0.0
    10m WS MAX (knots) in ~ROCI: 31.1
GFS Init: 2023-11-12T18:00:00
    Start valid_time: 2023-11-15T06:00:00
    AL Basin, Latitude (deg:):   13.8, Longitude (deg):  -82.5, MSLP (hPa): 1003.1, ~ROCI (km):   35
        850 RV MAX (*10^-5 1/s):  52.65, 250-850 hPa Thickness (m): 9545.30, 925 hPa WS MAX (m/s):  16.33
        10m WS MAX (knots) in ~ROCI:   19.5, Isobar delta (hPa) (MSLP for OCI - minimum):   4
    Last disturbance is before end of model run
    Named Storm Days: 3.00
    ACE: 2.5
    10m WS MAX (knots) in ~ROCI: 56.8
CMC Init: 2023-11-12T12:00:00
    Start valid_time: 2023-11-17T12:00:00
    AL Basin, Latitude (deg:):   13.8, Longitude (deg):  -79.3, MSLP (hPa): 1005.1, ~ROCI (km):  466
        850 RV MAX (*10^-5 1/s):  50.57, 250-850 hPa Thickness (m): 9558.24, 925 hPa WS MAX (m/s):  17.99
        10m WS MAX (knots) in ~ROCI:   25.7, Isobar delta (hPa) (MSLP for OCI - minimum):   3
    Below 34kt at end of model run
    Named Storm Days: 0.25
    ACE: 0.1
    10m WS MAX (knots) in ~ROCI: 36.1
Edit: On average from these three models, that is: ~1.9 NSD.
(I fixed the calculations thanks to @ChristopherRandles pointing out the bug, the previous data had the wrong ACE/NSD)
Is quote below correct?
5.25 days is 21 quarter days
At 35kt ACE= .35*.35 = 0.1225
21*0.1225 = 2.57
So how can the ACE be as low as 1.8 for 5.25 named storm days? Are you counting named storm days in periods when it is only a depression?
(Or it could easily be me that is confused in some manner.)
Named Storm Days: 5.25
    ACE: 1.8
10m WS MAX (knots) in ~ROCI: 36.1@ChristopherRandles ACE is normalized by 10^-4, so it’s 34 squared at minimum * .0001. So the minimum any storm can add is 0.1156 ACE. In reality it depends on whether you’re counting the rounded to neatest 5 observational speed and whether you only count when it officially becomes named or when it hits 34 kt prior to naming also.
Edit: I should also note I believe I am using higher res models than the FSU while I am still using thresholds for the lower res models ( as they were determined from work years prior) so I am going to be more sensitive to genesis (for instance for CMC 12Z I see genesis but FSU does not as it has much lower 850 vorticity numbers).
@parhizj That does make some difference but 21*0.1156=2.43 so it still looks like you are counting named storm days when it is below 34kt?
@ChristopherRandles Yep there was an error: I had a variable tracking the max wind speed for the whole storm run and I put that in the comparison for the time step. Took me several minutes to break that hallucination.
This error completely changes the data. I've edited it to reflect it
Uncertainty on how long Tammy will remain a tropical storm and uncertainty in the track further out:
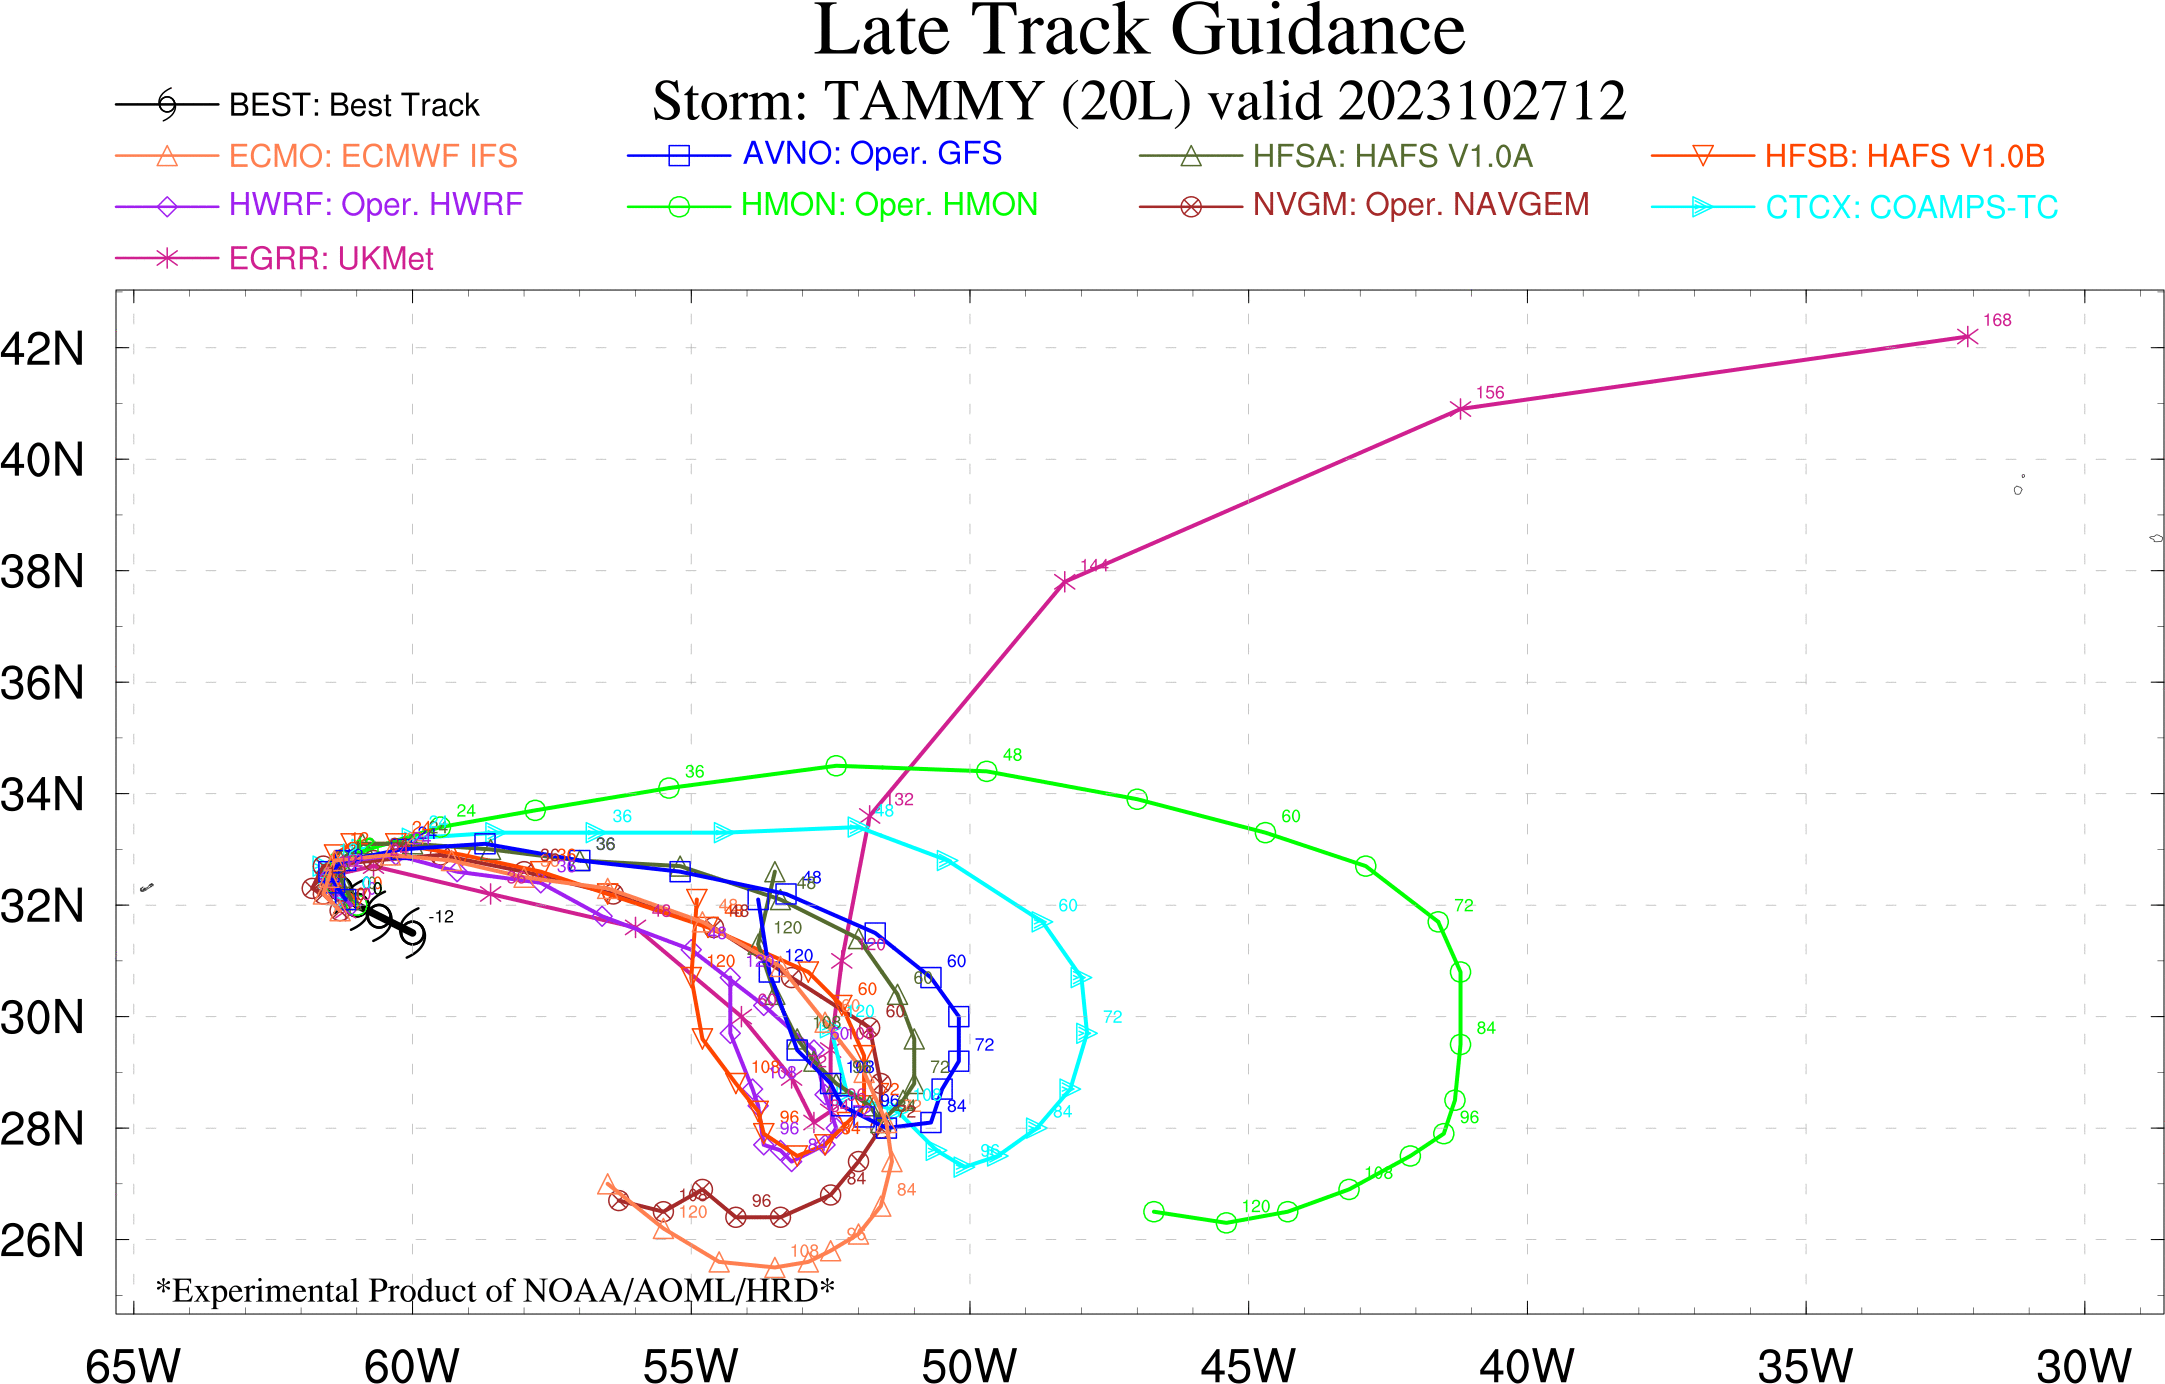
Phase plots show the uncertainty whether it will be a tropical storm in the next 24-48 hours even.

As the discussion has it below TS strength on day four, the range from NHC is another ~1-3 NSD from Tammy (on top of the 97.25 real time) putting it up to 98.25 to 100.25. Leaving it ~ 1.25 to 3.25 NSD short for it to resolve YES (101.5 is the minimum for YES).
Based on my own workbook for NHC advisory errors (from percentiles covering 1981-2022) on intensity errors (considering it alone), there is ~ a 39% chance of a longer than expected run (lasting at TS for 5 days) of Tammy resolving this question YES.
Tammy at least a TS?
2023-10-27 18Z :  99.0 %
2023-10-28 06Z :  98.0 %
2023-10-28 18Z :  94.0 %
2023-10-29 06Z :  82.2 %
2023-10-29 18Z :  70.0 %
2023-10-30 06Z :  57.0 %
2023-10-30 18Z :  46.3 %
2023-10-31 18Z :  37.6 %
2023-11-01 18Z :  39.6 %
As the guidance from OFCL is admittedly on the high side (per the discussion) this is probably also high.
@parhizj If there is 24% chance of reaching an ACE of 160, 31% here certainly looks too low. But perhaps it is the 24% that is too high. Bet yes here and no on the ACE market or on just one of these?
@ChristopherRandles The NSD is MUCH easier to satisfy than ACE. Just one more weak TC meandering for a few days like Tammy would push it over the top, but not so for ACE.
Going to look at ACE tomorrow when there is more certainty about Tammy's future.
Invest 96 doesn't look too favorable enough for me right now to update (despite NHC's 50%) especially since it looks like will be very short lived (maybe 1 NSD more?), and given that Tammy has ~another day left (keeping in track with the forecast), not much has changed since my prior prediction for me to update, so I'll wait another day or two before updating again.
86.75 so far.
1991-2020 average to 9th Oct 57.5
1991-2020 average for season 69.4
2021 and 2022 not far off these averages.
So typical in rest of season =69.4-57.5 = 11.9
11.9 gets to 98.65, not quite enough to reach 100.
However season is more active than typical so 86.75 / 57.5* 69.4 = 104.7
However perhaps El Nino reduces that.
Seems very close, making 16% look surprisingly low?
@ChristopherRandles 86.75 includes the January storm so it is not the total for June-November 30.... It is currently 85.5 NSD for June-November. (Subtract 1.25 from whatever the real-time shows on CSU's page)
Aside from Invest92L (which if it does actually does form in the next day or two will increase the probability), October was supposed to be normal/below (ECMWF ACE), with maybe the first week of November being above normal. As it seems some of the models for 92L have been pushing back genesis (and the probabilities fluctuating a bit), and the UK model still not predicting genesis (Edit: in the next 2 days that is), I'll wait until at least there is a 90% chance of genesis (NHC or FSU experimental) before updating (and even then there will be a lot of uncertainty in the track for 92L which will dictate its NSD contribution).
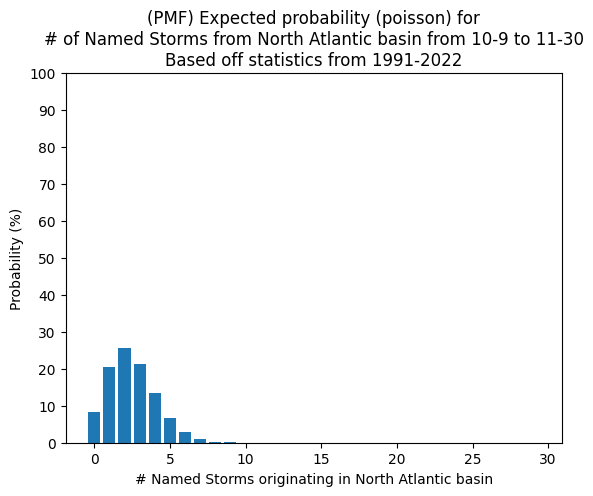
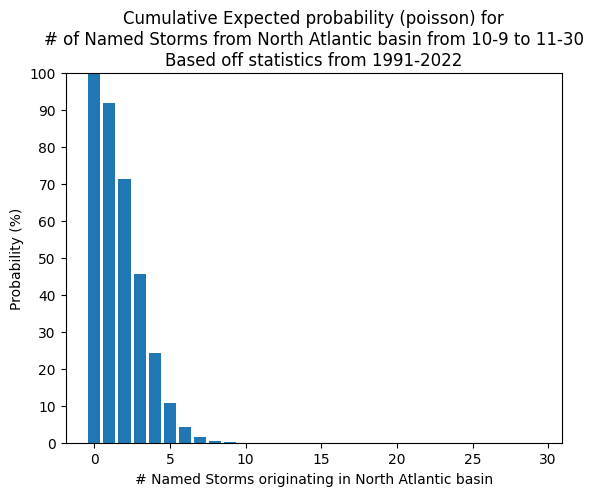
As for base rates, most likely we will get 1-2 more storms on average (1991-2022), but even so, it's unlikely they will together provide 14.75 NSD needed for this to resolve yes
Edit2: I refactored most of my notebook code and fixed an error for this chart (the other charts I did for related markets look OK) but it doesn't change my analysis as 0-2 storms is still the most likely in the fixed version (with 3+ at 45.6%)
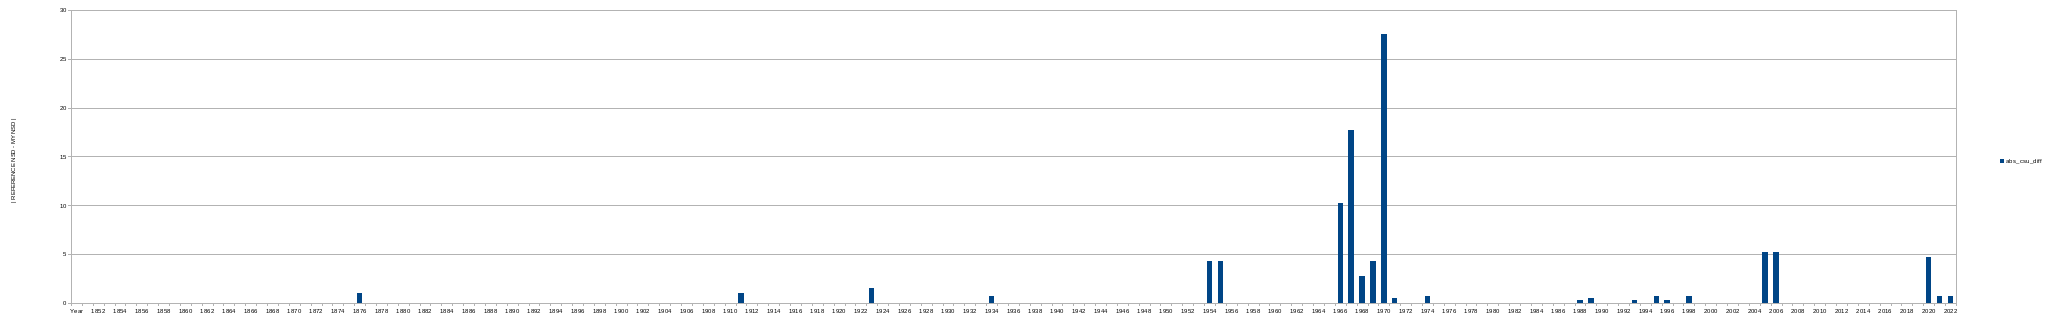
Edit: Fixed some errors in excluding storms as mentioned in https://manifold.markets/sarius/will-accumulated-cyclone-energy-exc#q2aNsfUKZ0j7hRIRJVt8
I still am left with similar differences in NSD (either methodology, dataset, or both), with 1966, 1967, 1970 standing out as large differences.
Edited Nov. 2. West/Central Caribbean Sea still shows TC genesis potential for next two weeks...
The usual output for 1966+ data:
Real-time NSD: 99RMSE final tuning: 5.84Valid until: 2023-11-02 21:00:00
NSD, Real-time + storm model forecast: 99.0
Tuned decay rate: 0.229
Expected NSD (weight historical NSD using exponential decay): 102.31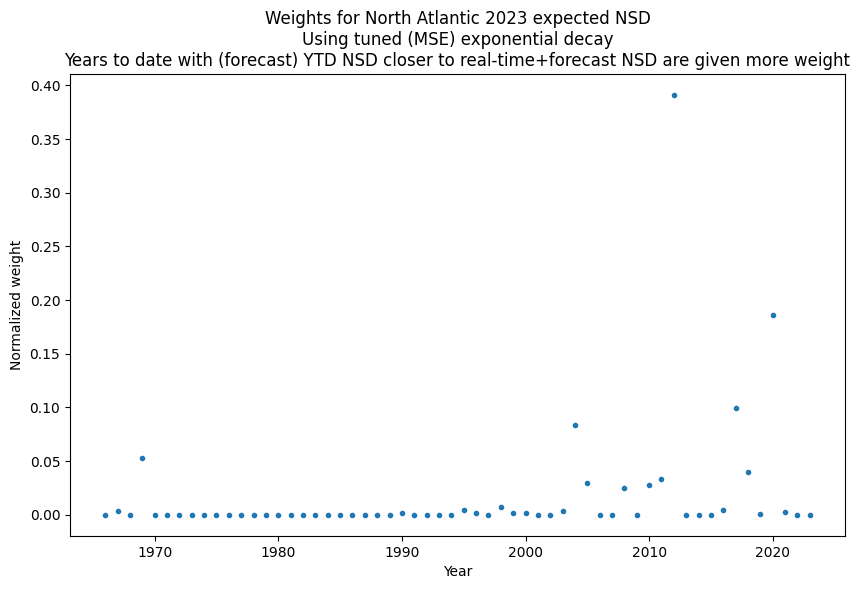
Top 10 weights (sorted by weight)
----------------------------------------
Rank  |  Year  |  Weight  |  Season NSD
----------------------------------------
   1  |  2012  |  0.391   |  101.25
   2  |  2020  |  0.186   |  122.75
   3  |  2017  |  0.099   |  93.00
   4  |  2004  |  0.083   |  93.00
   5  |  1969  |  0.053   |  96.50
   6  |  2018  |  0.040   |  86.75
   7  |  2011  |  0.033   |  89.75
   8  |  2005  |  0.030   |  131.50
   9  |  2010  |  0.028   |  89.50
  10  |  2008  |  0.025   |  88.25
NSD 101.5 (exp. decay) %: 16.21 %
NSD 101.5 (excluding years below real time NSD) %: 94.97 %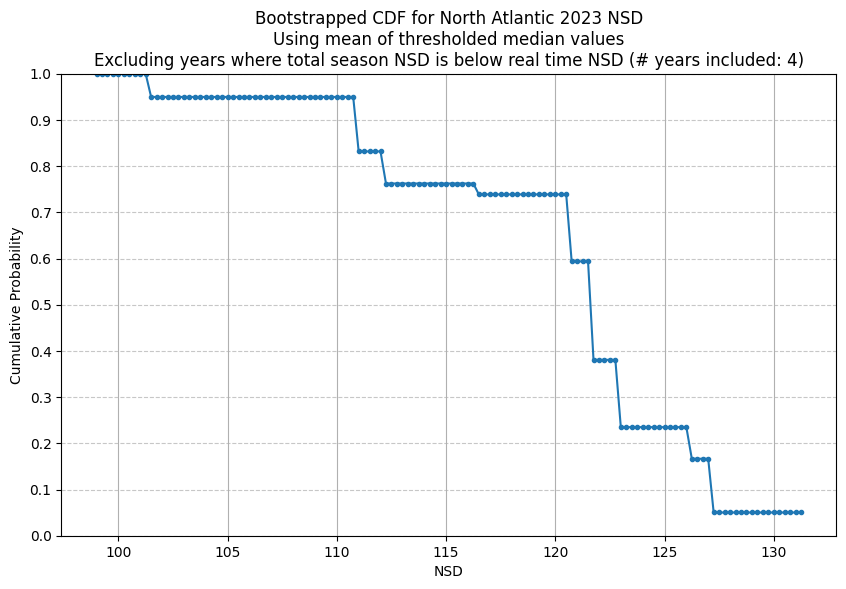
% chance of NSD=101.5 using average of two probabilities: 55.59%

Statistics for 1966 - 2023 excluding years with season NSD < real time NSD:
μ: 119.00
median: 121.62
(NSD=101.25) Weighting the two predictors: (weighting Exp: 0.7, Realtime: 0.3): 38.71%