Accumulated Cyclone Energy (ACE) is a metric that quantifies the energy output of tropical cyclones by summing the squared values of their maximum sustained wind speeds at 6-hour intervals throughout their active lifespan, providing a measure of their intensity and duration.
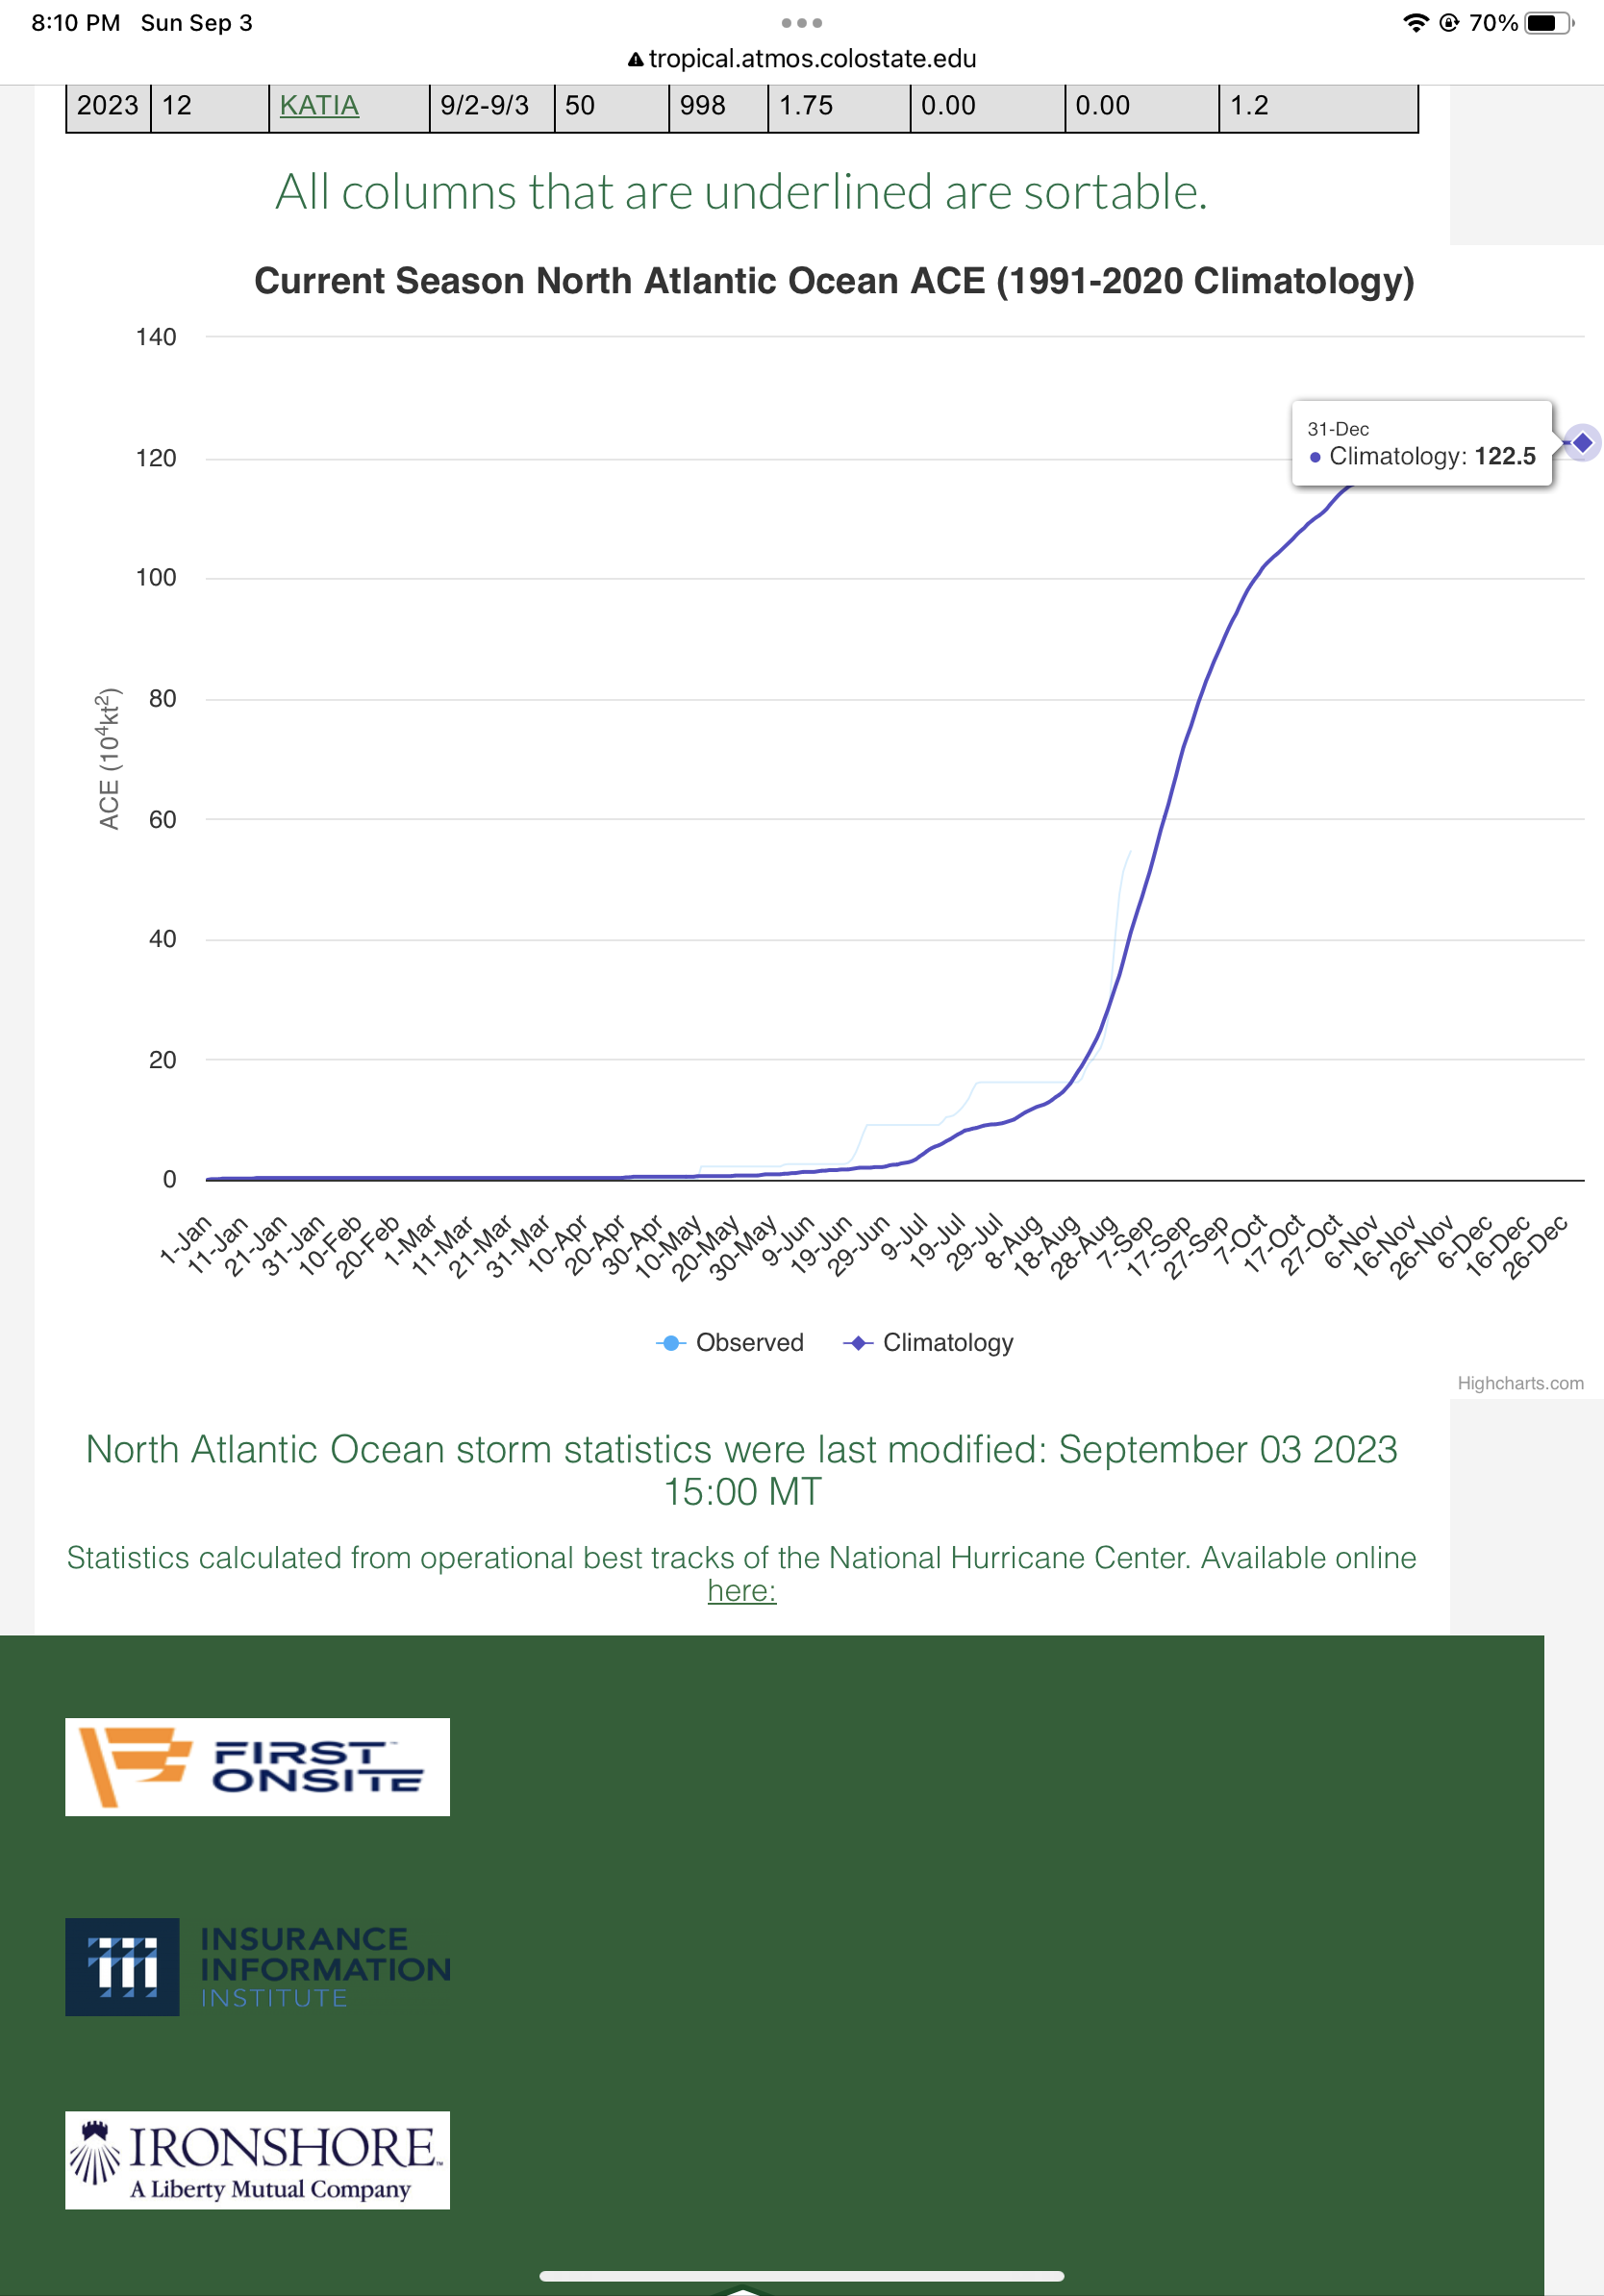
The 1991–2020 average ACE is 123 for the Atlantic basin (North Atlantic, Caribbean, GoM). Will it exceed the 160 predicted by Tropical Meteorgly Project at Colorado State?
Resolves per Northern Hemisphere Tropical Cyclone Activity for 2023.
 1,000
1,000🏅 Top traders
| # | Trader | Total profit |
|---|---|---|
| 1 | Ṁ203 | |
| 2 | Ṁ140 | |
| 3 | Ṁ91 | |
| 4 | Ṁ67 | |
| 5 | Ṁ64 |
People are also trading
No sign of any activity. Even if a 100kt hurricane suddenly appeared and maintained that strength to end of year that would only add 10 ACE and we are 15.8 short of 160.
So I think this can be resolved no. @sarius
@ChristopherRandles thanks! I don't think we will get to see the apocalypse this year - so on that ultra-low probability and in light of the year/season ending I am resolving this NO (i don't want to keep your mana hostage for longer than it has already been).
@parhizj title and closing date indicate it is 2023 (not 2023 season ending 30 Nov). But even with extra month, not likely to get more than a minimal hurricane and not likely to get minimal hurricane lasting 10 days.
Tammy is making an interesting late run. I haven’t run any hard analysis but eyeballing from current forecasts it seems like Tammy will top out around or under 15 which will leave the season 15 short of 160 in an increasingly unfavorable environment with a historical average of under 10 to go. But that’s close enough that these are probably pretty fair odds.
@JoshuaHedlund From the run I did last night (using IVCN):
Future contributions (up until 2023-10-28 00:00:00) of cyclone ACE values in AL basin (including INVESTs)
    from latest forecast using IVCN (excluding 00h) by interpolating intensities
  ACE(future) for AL20 = 12.02
  Total ACE(future): 12.02

Real-time ACE: 132.6
Total ACE (real-time + forecast) up until 2023-10-28 00:00:00: 144.62When working on a related market (named storm days) and comparing the values I get from http://tropical.atmos.colostate.edu/Realtime/index.php?arch&loc=northatlantic
I discovered I have at least a couple of problems with my analysis involving the calculations for the (hindcast) ACE index values. I noticed two serious errors I made in prior calculatons of ACE: 1) that was that I was including all types of systems including extratropical tropical cyclones) when it seems for ACE calculations such cyclones are excluded (according to CSU, only tropical storms (including hurricanes) and subtropical storms are included), and 2) I did not exclude systems that crossed basins (2022 for instance had an example of this). I've corrected these two problems in my current notebook. This revises down the probabilities signficantly. In addition, related to the first error, when including forecast cyclones using a-tracks there will be always a chance that a portion of the ACE added will be from a non TS storm (extratropical for instance) so this is something to check when looking at the first estimator which uses expected ACE (that includes the forecast ACE) as it may be an overestimate from time to time.
Complicating all this is that I'm not sure if there is an authoritative definition for ACE calculations to confirm that if the corrected methodology I am using now is correct, or whether it still has any differences between the way CSU or revised HURDAT (https://www.aoml.noaa.gov/hrd/hurdat/comparison_table.html) calculates ACE values (or just a dataset issue?). As an example, for 1970 I get vastly different values from CSU but close values to HURDAT, but for 1934 I get similar values to CSU but vastly different from HURDAT. When comparing my data to CSU and HURDAT numbers I find that there are only 10-11 years that have an absolute difference of > 1 ACE so it is not too fatal? Here is a chart that shows it is only a handful of ACE values where there might be a problem that remains (excluding differences <= 1):
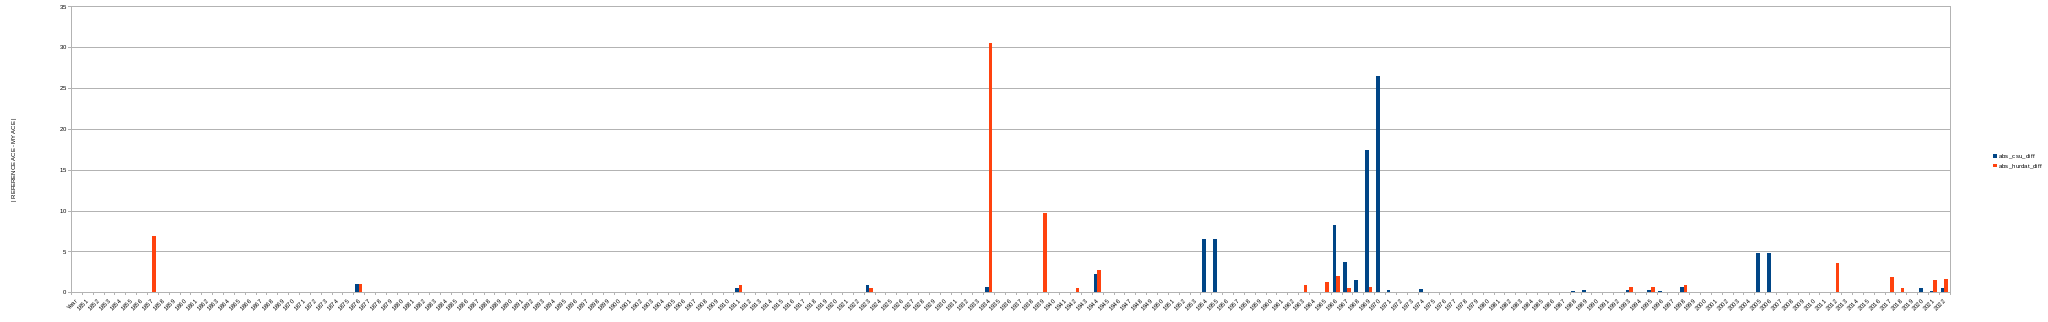
Even though there is not a lot of overlap I can't rule out it is a problem with my methodology. If this is the case, it's unclear to me how much this will affect the calculations I do from now on using ACE values. I speculate that as long as the largest of those years, that is 1934, 1969, 1970, are not in the top weights, I speculate it won't effect the confidence I have in it too much as the RMSE is currently larger than the other years' differences.
Maybe someone can help me narrow this problem down.
I will update the analysis I did this morning (that is a bit out of date) for comparison.
I'll try keeping my updates to this single comment (and just edit it ~daily).
Edited Oct. 28: Going to do short summaries rather than posting all the statistics from my notebook for base rates, as I'm spending more time tracking individual genesis events as we near the end of the season rather than paying close attention to base rates any more. Tammy doesn't look like it will survive as a much TS past tomorrow (adding ~2 ACE). This marginally increases the probabilities from last time (weighted 2 predictors) to ~68%. However since I think there is less uncertainty now about it's future, I'm going to have to go back to deferring 10%
There is an Invest 96L that is given 50% chance of development, but as it pertains to ACE it doesn't look like it will add anything substantial at all as global models show a very short lived TD/TS (looks like SSTs have cooled off as we head into November).
Further out 6-7 days from now, GFS 18Z now shows a possibility of genesis in the Caribbean, but that is still fairly far out and it's the first model run (and only global model) showing such a development, so it's still low probability.
As the ACE continues to increase I can only say that my credence in this hybrid predictor will only decrease, with the exception of any invests or storms that forecast significant ACE. So I will go back to deferring to a low (10%) when there is not much in the forecast (as is now).
https://tropical.colostate.edu/Forecast/2023-0928.pdf
New 2 week forecast from CSU (1 final one coming in two weeks).
As mentioned, interaction between Philipe and Rina could cause the ACE forecast to drop below expected since there is uncertainty whether this will happen from current guidance.
@parhizj Why 1966 cut off? It is more normal to go with 1979+ cut off because we have satellite coverage from then so likely more consistently finding smaller storms when they are away from shipping routes after 1978.
@ChristopherRandles I've noticed CSU (regularly) references a 1966+ cutoff for their rankings for ACE forecasts:
Real time is 109.0
I did a much more complicated analysis using historical data (best track intensities) that seems to show this market probability is (way) too high. I attempt to calculate the expected ACE using all the historical data with exponential decayed weights (difference between ACE for YTD in historical years versus current ACE (realtime+forecast) so that large differences are weighted (exponentially) less and less as the season progresses) through auto-tuned weights (this will mitigate years that are less representative) .
Using a bootstrapped CI range to estimate the probability (one version using the expected value using the above method, and the other with the mean using the constraint on all the years data but excluding years with season ACE below real-time), the best I can come up with is about 54% to 71% confidence level (with the two methods) that the ACE will be above 160. (Edit: added CI for expected value using resampled data).
Edit: (updated Sept. 19)
Forecasts until: 2023-09-25 00:00:00
ACE, Real-time + storm model forecast: 120.44
Tuned decay rate: 0.171

Expected ACE (weight historical ACE using exponentially decay): 168.00
(bootstrapped) CI using expected value (70.0%): [160.48, 237.50]

Statistics for 1851 - 2022 excluding years with season ACE < realtime ACE:
μ: 164.27
(bootstrapped) CI using mean (54.0%): [160.02, 168.31]
https://github.com/JRPdata/wastebook/blob/main/ACE_AL_forecast.ipynb
ECMWF extended ACE forecast through Oct. 23 is below average now.
I did more work on the same calculations to create CDFs and found a bug in the bootstrapping calculation using the expected ACE (didn't renormalize on the weights for bootstrapping). This only affected the CI calculation (not the expected), and in addition the CDF shows the distribution is more fat-tailed at the high end for ACE.
For the second calculation above I also did a CDF (this is bootstrapping by conditioning on the base rates). Both using thresholds (on different statistics) and then the mean for the all the samples thresholds for each ACE value.
This is not updated with the latest real time or the latest forecast since I wanted to leave the graphs for comparison to the first comment for reference. I'll post an updated version tonight if no one notices anything odd about these calculations.
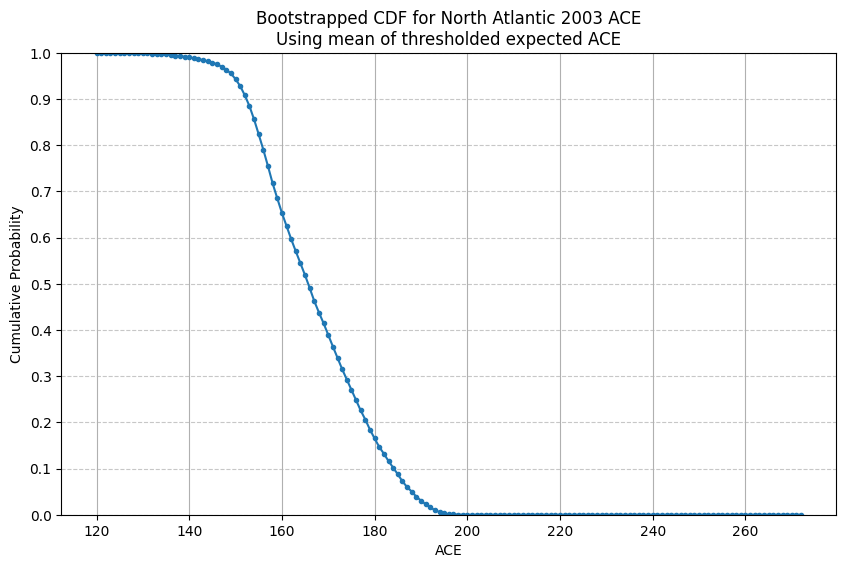
For the second chart ~70% of the probability is concentrated around the median. This chart is much more conservative since it weights equally all years with season ACE above real time ace, even those that are not very plausible. With the limited number of years (57) it creates a more step-wise function, so for ACE of 160 it is only 25% (or maybe as high as 30% if you try to interpolate).

Edit: fixed minor typo CDFs -> CDF
Update for today (11/02): Looking at different outlooks and forecasts (NHC outlook, FSU's TC guidance, ECMWF's tropical frequencies chart, GFS (15day)) it looks like any genesis that will occur will likely be from the west/central Caribbean sea for the first half of October (and GFS 18Z at least shows some potential genesis into a hurricane ~2 weeks from now, although this is very speculative this far out); this provides some weak justification for still not clamping to NO, despite it being late in the season with no candidates a week out.
Only 10, 13 samples in the two predictors with any significant contributions), so I still have low confidence in these probability estimates a month out. Nothing in the forecasts are included. Usual run (1966+):
RMSE final tuning: 8.98Valid until: 2023-11-02 21:00:00
ACE, Real-time + storm model forecast: 145.6
Tuned decay rate: 0.209
Expected ACE (weight historical ACE using exponential decay): 156.67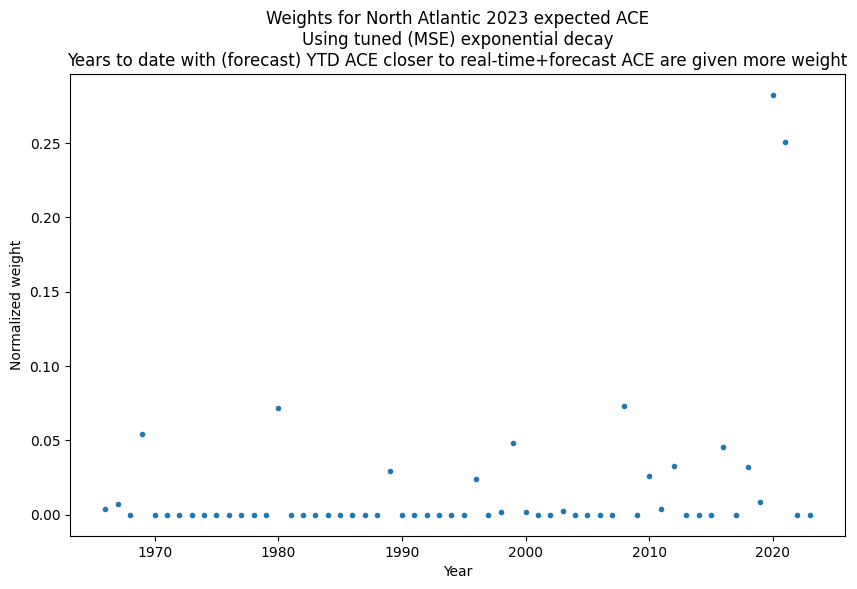
Top 10 weights (sorted by weight)
----------------------------------------
Rank  |  Year  |  Weight  |  Season ACE
----------------------------------------
   1  |  2020  |  0.283   |  180.37
   2  |  2021  |  0.251   |  145.56
   3  |  2008  |  0.073   |  145.72
   4  |  1980  |  0.072   |  148.94
   5  |  1969  |  0.054   |  148.31
   6  |  1999  |  0.048   |  176.53
   7  |  2016  |  0.045   |  141.25
   8  |  2012  |  0.032   |  132.63
   9  |  2018  |  0.032   |  132.58
  10  |  1989  |  0.030   |  134.84
ACE=160 (exp. decay) %: 26.56 %
ACE=161 (exp. decay) %: 24.94 %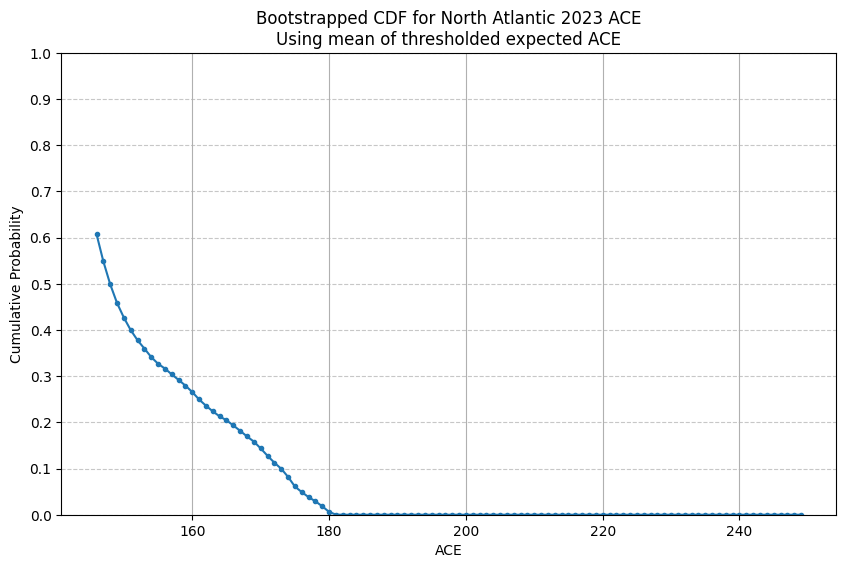
ACE=160 (excluding years below real time ACE) %: 98.42 %
ACE=161 (excluding years below real time ACE) %: 98.42 %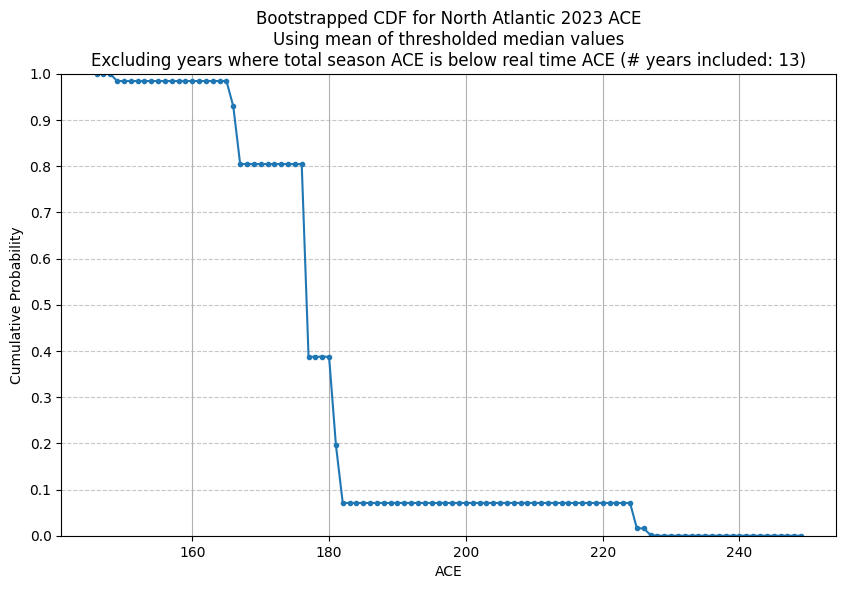
Statistics for 1966 - 2023 excluding years with season ACE < real time ACE:
μ: 186.01
median: 176.53
(ACE=160) Weighting the two predictors: (weighting Exp: 0.4, Realtime: 0.6): 67.17%ACE realtime at 100.5 and...
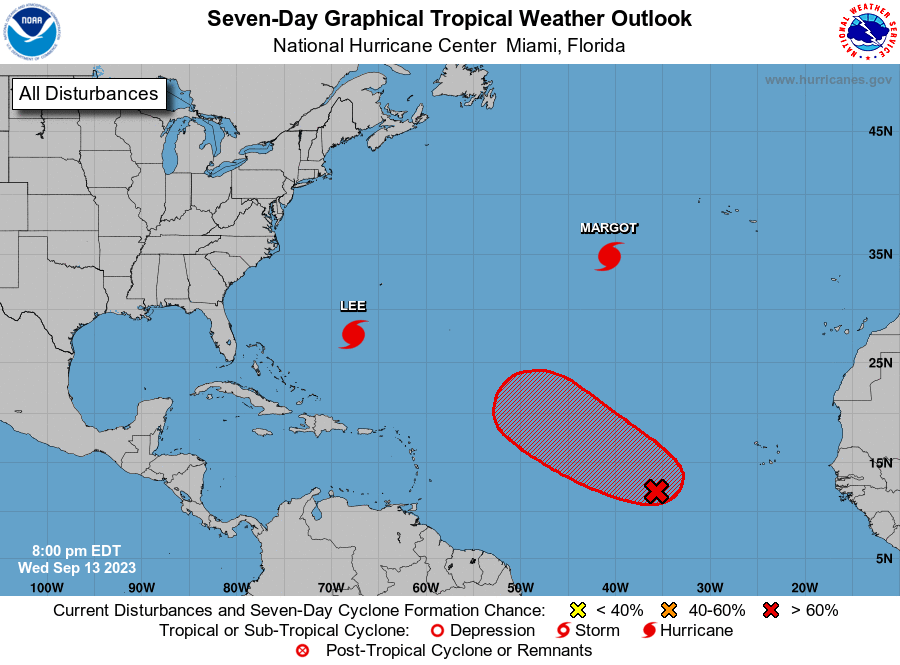
CSU released their new forecast for the next two weeks, giving 85% chance of adding >26 ACE in the next two weeks:
https://tropical.colostate.edu/Forecast/2023-0914.pdf
"Lee and Margot. They are estimated to generate an additional ~14 ACE before dissipation, which is the main reason why we effectively gave a 0% chance of the two-week period ending up below normal. The National Hurricane Center is monitoring one area with a high chance for tropical cyclone (TC) development in the next couple of days (97L). Global models are quite aggressive with intensification chances for 97L, giving us increased confidence that this system could generate the remaining ACE needed to reach the above-normal threshold for the two-week period."
I reran the same notebook (below) I did yesterday with the latest a-tracks and now get:
Future contributions of cyclone ACE values in AL basin (including INVESTs)
    from latest forecast using IVCN (excluding 00h) by interpolating intensities
  ACE(future) for AL13 = 3.94
  ACE(future) for AL14 = 6.15
  ACE(future) for AL97 = 12.81
  Total ACE(future): 22.90
22.9 + 100.5 = 123.4 through (~half-way) of September 21st (last intensity in the forecast for AL97 is 87kt so it still has more ACE to contribute before it dissipates in the forecast).
Latest ACE value from above is 95.8
I wrote a notebook to use a-track forecasts from NHC to calculate the future ACE value you might expect from the latest forecasts (using linear interpolation, IVCN model, and excluding init time) (you have to manually download/unzip the a-tracks you want, and include the file names in the notebook):
Future contributions of cyclone ACE values in AL basin (including INVESTs)
    from latest forecast using IVCN (excluding 00h) by interpolating intensities
  ACE(future) for AL13 = 7.3
  ACE(future) for AL14 = 7.12
  ACE(future) for AL97 = 11.32
  Total ACE(future): 25.74
I'm including AL97 since it has 80% of formation, and if it does form the forecast only covers part of the future contributions AL97 (since the latest a-track data only goes out 132H for AL97)
95.8 + 25.74 = 121.54
This covers up to about Sept 19-20:
AL13: 0-132H : 2023-09-14 00:00:00 to 2023-09-19 12:00:00
AL14: 0-168H : 2023-09-14 00:00:00 to 2023-09-21 00:00:00
AL97: 0-132H : 2023-09-14 00:00:00 to 2023-09-19 12:00:00
I can speculate off the top of my head (guesswork on intensities so far in forecast) as far as doubling AL97's eventual ACE contribution to 20 given the trends in the forecast (as it only covers it on the upwards strengthening phase of the cyclone)
... putting the total at 130 after AL97. And given the AL storm season has ~ 78 days left, that leaves 70 days to go from 122 to 160. Speculating beyond the forecasts with AL97 increasing it to 132, leaves ~30 ACE left to reach 160, which should be likely with the number of days left and the current above normal activity of this hurricane season (especially as we are just now around the peak of the season).
https://twitter.com/philklotzbach/status/1702079341520400737
"The 2023 Atlantic #hurricane season has already produced 96 ACE (Accumulated Cyclone Energy) - surpassing ACE generated in entire 2022 Atlantic hurricane season."
Notebook here:
https://github.com/JRPdata/wastebook/blob/main/ACE_AL_forecast.ipynb
Forecast extends out to Sept. 20-21 now:
AL97: 0-168H : 2023-09-14 06:00:00 to 2023-09-21 06:00:00Latest CSU: 98.2
+ 28 from forecast (IVCN) = 126.2
Future contributions of cyclone ACE values in AL basin (including INVESTs)
    from latest forecast using IVCN (excluding 00h) by interpolating intensities
  ACE(future) for AL13 = 6.56
  ACE(future) for AL14 = 5.71
  ACE(future) for AL97 = 15.73
Total ACE(future): 28.00Latest CSU realtime ACE: 104.0
Updating now that AL97 is AL15 (forecast goes to Sept 22 18Z):
104.0 + 19.34 = 123.34
Future contributions of cyclone ACE values in AL basin (including INVESTs)
    from latest forecast using IVCN (excluding 00h) by interpolating intensities
  ACE(future) for AL13 = 1.78
  ACE(future) for AL14 = 3.07
  ACE(future) for AL15 = 14.49
  Total ACE(future): 19.34
The drop is from IVCN guidance no longer predicting a major hurricane for AL15 in it's latest forecast (barely a cat. 2), although OFCL still does predict a major hurricane.
CSU realtime ACE: 106.1
106.1 + 16.55 = 122.65 (up to Sept 24 06Z). The ECMWF (50%) and GFS forecast shows some chance of possible development ~1 week out (around Sept. 24th), with the NHC 7-day outlook only giving it 30% so far.
Future contributions of cyclone ACE values in AL basin (including INVESTs)
    from latest forecast using IVCN (excluding 00h) by interpolating intensities
  ACE(future) for AL13 = 0.74
  ACE(future) for AL14 = 0.12
  ACE(future) for AL15 = 15.69
Total ACE(future): 16.55Page 29 is the most relevant data I could find:
https://tropical.colostate.edu/Forecast/2023-08.pdf
Since they predicted 160 ACE, care to share how did you pick 170 for the question, @sarius ?
@parhizj because my eyes slipped in the column while copying the number. Thanks for catching that! Since I was the only trader so far it is now set to 160 (which is what it was supposed to be...).
When you refer to ACE for 2023 you mean the cumulative ACE of all the storms in the North Atlantic right? ( the bottom chart as it shows on Dec 31? But for 2023)