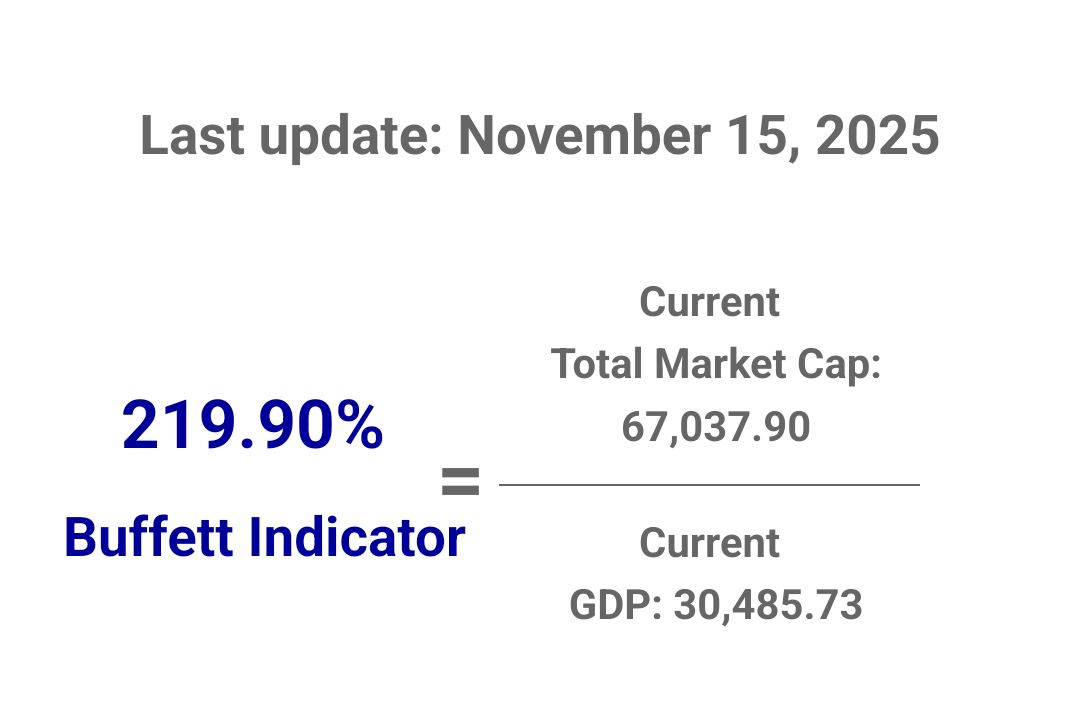
current sitting at 219.9% but a growth of profits can impact it along with a downturn
Resolution criteria
The Buffett Indicator is calculated as Total US Stock Market Value divided by Gross Domestic Product (GDP). The market will resolve to the value of the Buffett Indicator as of November 30, 2026, rounded to the nearest whole percentage point.
Resolution will be determined using data from...
https://thebuffettindicator.com/
If none of these sources have published data for November 2026 by December 15, 2026, the creator will resolve based on the most recent available data from any reputable financial source.
Background
Warren Buffett called the ratio "the best single measure of where valuations stand at any given moment", though he has since walked back those comments, hesitating to endorse any single measure as either comprehensive or consistent over time. As of November 13, 2025, the Buffett Indicator stands at 221.4%. Buffett suggested a range of 75-90% is reasonable, while over 120% suggests the stock market is overvalued. The indicator set an all-time high during the "everything bubble," crossing the 200% level in February 2021.
Considerations
The stock market valuation reflects international activity while GDP does not—for example, Amazon's India business is priced into its US stock price but not included in US GDP. The Buffett Indicator has trended upwards over time, particularly post-1995, with lows registered in 2009 that would have been average readings from 1950-1995. The indicator is exceptionally poor as a short-term timing tool; had investors dumped stocks due to overvaluation, they would have missed one of the longest bull markets in history.
 1,000
1,000