Does a vaccinated person with mild symptoms and inconsistent rapid test results have Covid?
6
Ṁ102Ṁ350resolved Aug 23
Resolved as
87%1H
6H
1D
1W
1M
ALL
This is a hypothetical question auxiliary to https://manifold.markets/dreev/does-faire-actually-have-covid-afte but I intend to resolve it to a probability based on the most convincing case I hear.
Suppose someone presents with a scratchy throat, mild cough, and slightly runny nose. They take 4 antigen rapid tests and 2 come back positive and 2 come back negative.
What is the probability that they have Covid?
This question is managed and resolved by Manifold.
Market context
Get  1,000 to start trading!
1,000🏅 Top traders
| # | Trader | Total profit |
|---|---|---|
| 1 | Ṁ16 | |
| 2 | Ṁ1 | |
| 3 | Ṁ0 | |
| 4 | Ṁ0 | |
| 5 | Ṁ0 |
Sort by:
I don't think I can do better than resolve to the market probability here. We have a bunch of good math, thanks especially to @jack but we have to make a guess as to the prior probability before testing but after observing the mild symptoms.
Another point: rapid test results depend a lot on how much viral matter you have, which changes quickly over the course of an infection, so the timeline of when symptoms started and when the different test results were from matters a lot.
E.g. it's expected for vaccinated people that symptoms can start a couple days before rapid tests start returning positives, probably about 2 days:
https://twitter.com/michaelmina_lab/status/1472024457640394756 and https://www.statnews.com/2022/01/05/study-raises-doubts-about-rapid-covid-tests-reliability-in-early-days-after-infection/
Here's a list of some studies on rapid test accuracy: https://www.healthline.com/health/how-accurate-are-rapid-covid-tests#at-home-tests. I'll use the data from this review of studies: https://www.cochranelibrary.com/cdsr/doi/10.1002/14651858.CD013705.pub2/full. It finds sensitivity (correctly identifying true positives) averaged 72% among symptomatic people and 58% among asymptomatic; specificity (correctly identifying true negatives) averaged 99.6%.
This matches with my understanding of the qualitative communications that the public health institutions have put out about rapid test accuracies.
I read a thread (which unfortunately I can no longer find) that said that the specific stats that the manufacturer provides to get EUA authorization (the ones on the test's pamphlet/box) are not really useful and everyone in the industry knows it, because they test how well the manufacturer can work around the terrible regulatory rules, not how well the tests work. In particular, the studies are allowed to cherry-pick highly infectious individuals to get better results, and they are also kind of forced to in order to meet the highly arbitrary regulatory standards. So you should ignore those stats.
Now, trying to use those to estimate the probability of Covid for this question:
As a baseline, I'll compute an estimate that ignores the information about symptoms, because I don't currently have data on that. With current covid prevalence in my area (SFBA) estimated at 0.6%, we can apply Bayes rule to a single rapid test to estimate that a positive result implies a ~50% chance of having covid, i.e. 1/2 of positives are false positives. (Hopefully I didn't mess up the math, you can double-check my numbers)
It's not clear how to combine multiple test results (how correlated are they), but something like Daniel's calculation is probably reasonable - but I would replace the sensitivity/specificity numbers with ones from a meta-review like above.
Found the thread on why the pamphlet stats are bogus: https://mobile.twitter.com/michaelmina_lab/status/1473514544735608840
@jack Oh ho, thank you! Regenerating my graph with your sensitivity/specificity numbers yields this:
https://user-images.githubusercontent.com/9928/168388425-b8c3b41b-bfdb-4c36-9973-2b95db312a79.png
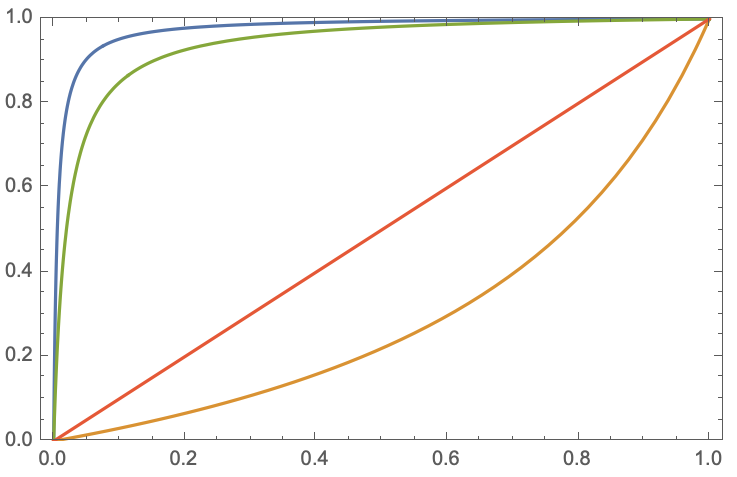
Non-nerd explanation of that graph:
Pick the probability you had Covid initially (called the prior probability -- prior to getting new evidence) on the x-axis. The y-axis gives the posterior probability -- the probability after updating on the new evidence.
New evidence being a positive test (blue), a negative test (orange), or mixed tests (green). The red line -- just the y=x diagonal -- is if you don't test at all, so the probability doesn't change.
If I'm Bayesing this out correctly then the green line in the following plot gives the posterior probability of Covid as a function of the prior probability:
https://user-images.githubusercontent.com/9928/168380795-474c10cc-6e36-46a8-b03d-b73e699ce138.png
This makes the probably-wrong assumption that, given Covid and given not-Covid, repeated test results are independent from each other. So getting a true positive followed by a false negative is just the product of those probabilities.
You say "vanishingly rare" but the pamphlet with the test says it "correctly identified 33 out of 35 (94.3%) of symptomatic positive samples and correctly identified 102 out of 104 (98.1%) of symptomatic negative samples". Which sounds like a 1.9% chance of a false positive and 8.6% chance of false negative.
@dreev I was going off of my memory of the features of the COVID tests on the market - I am not familiar with the specific pamphlet you are referencing.
False positives with covid tests (both pcr and antigen) are vanishingly rare. False negatives are very common. If you took 4 tests with 2 coming back positive and 2 coming back negative, you almost certainly have (or had) covid.
There's a possibility you had it and are still testing positive even though you're no longer contagious, but I'd still count that as a "yes" the way your question is worded.