
In a similar vein as my very first markets self-resolving to f(mkt), a couple of thought-provoking attempts at inducing theoretical chaos were made by @BoltonBailey, however I think no real chaos can ensue without the iterative recurrence relation characteristic of the logistic map and other more famous chaotic mappings such as Mandelbrot and Julia sets in the complex plane. This attempt aims to correct that. Thanks, Bolton, for the inspiration!
This market resolves to PROB=ROUND( x_(n+1), 2) i.e. the closest integer percent to x_(n+1) = (p+3) x_n (1-x_n), the (n+1)-th iteration of the logistic map's recurrence relation,
where n = the number of unique traders at close (as seen in the market info pane accessible through the top-right [•••] button) and,
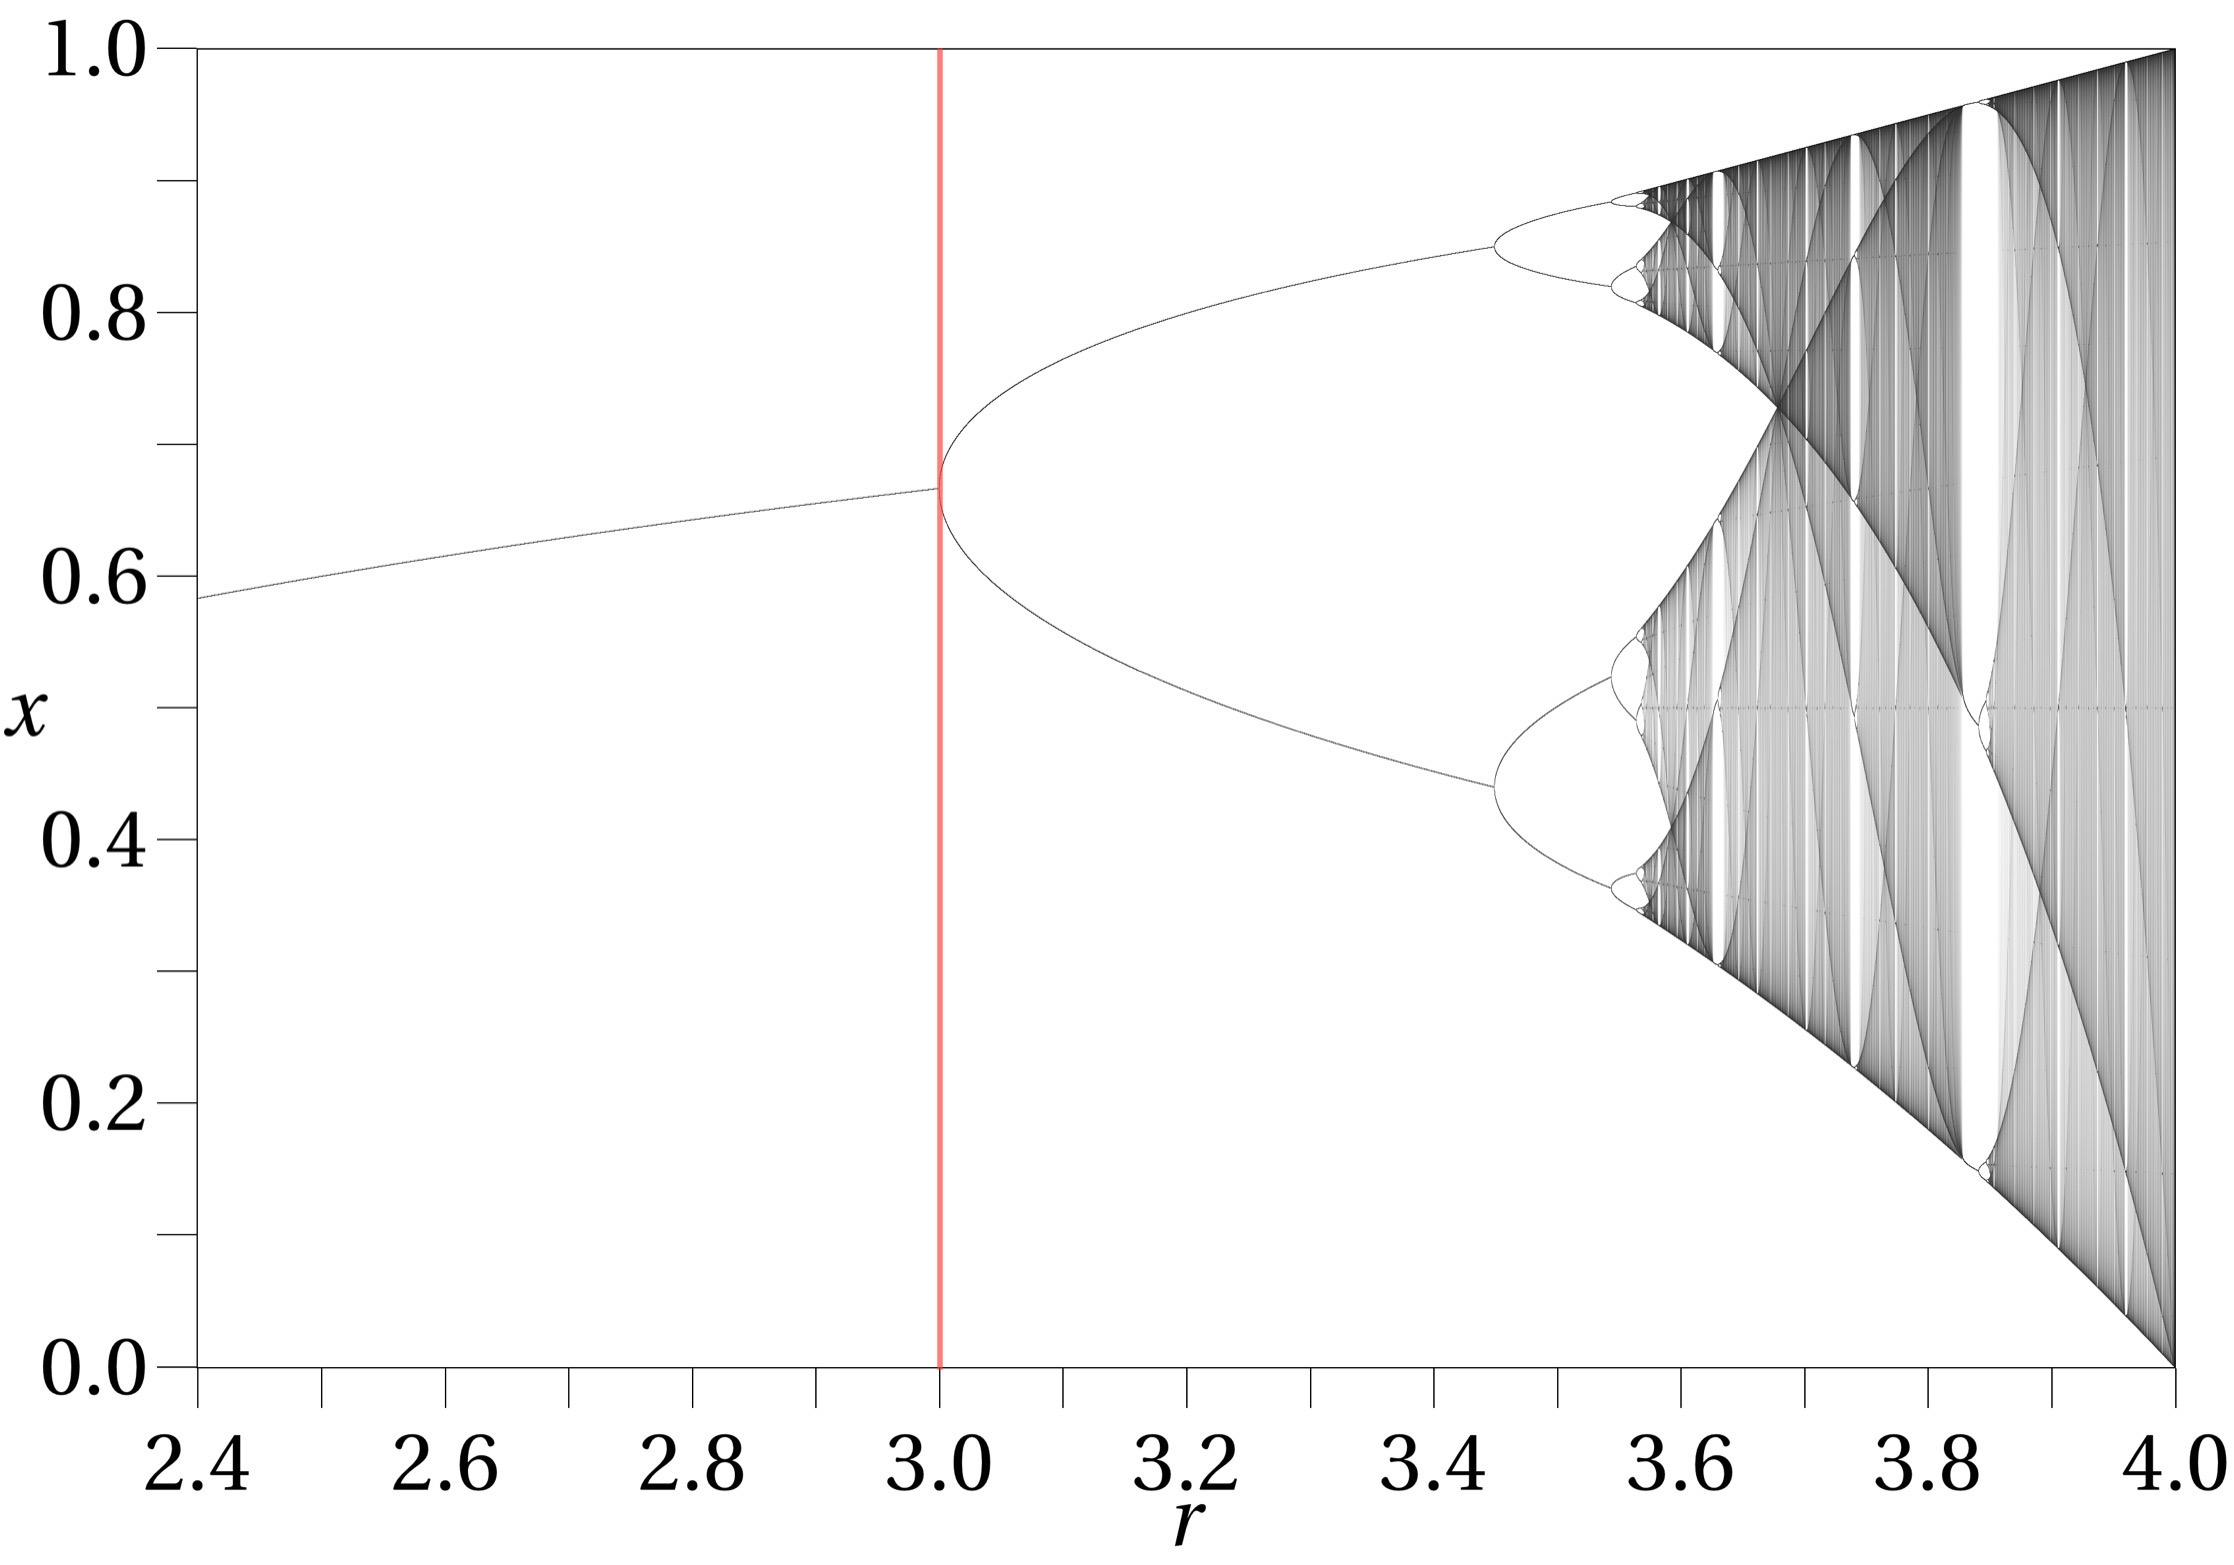
the initial iteration x_0 (read as x subindex zero) = p, the full-precision market probability value at close, as obtained through the API or anyone's web browser inspector (this is how I'll get it). Note this same p appears as part of the (p+3) parameter factor of the logistic map's recurrence above, limiting it within the region of the map shown here on the right of the red line:
I'm not sure how traders will try to figure this one out, but one thing I'm almost sure is, the higher the price and number of traders, the more chaotic (yet still deterministic) it should be. Have fun!
 1,000
1,000🏅 Top traders
| # | Trader | Total profit |
|---|---|---|
| 1 | Ṁ68 | |
| 2 | Ṁ29 | |
| 3 | Ṁ12 | |
| 4 | Ṁ5 | |
| 5 | Ṁ0 |
Currently the market probability stands at,
p=x_0=0.7021533854488928 [1]
And there’s been n=4 unique traders so far (this counts traders who may have sold out of their position, or even traders who placed a limit order but have never even held a position).
According to my spreadsheet this gives,
x_5=0.92456431648
and if it were to close as is without any new trades (or traders), it’d resolve to 92%
NO holders better shake things up!
[1] from my browser’s web dev Network pane, find the json file “chaos-theory-n-resolves[…]”, look for the last y-value in the “points” data structure. Note this is provided with 16 digits of precision while my version of Excel does up to 15 digits (this may be relevant with a higher n) so if anyone feels it worth to run the calculation with more/full digits, please do so and post a comment with the details.
@deagol Ten traders now and the output hasn't actually changed all that much:
ghci> chaos 10 0.5985794792079979 :: Fixed 1000000000000000000000000000
0.896672068730114726221327725

@1941159478 Yeah it's not, but draw the x=p line on there and it's quickly obvious that you lose money betting it down.
@1941159478 from the linked article (note r there is 3+p here):
At r ≈ 3.56995 (sequence A098587 in the OEIS) is the onset of chaos, at the end of the period-doubling cascade. From almost all initial conditions, we no longer see oscillations of finite period. Slight variations in the initial population yield dramatically different results over time, a prime characteristic of chaos.
Most values of r beyond 3.56995 exhibit chaotic behaviour, but there are still certain isolated ranges of r that show non-chaotic behavior; these are sometimes called islands of stability.
Just realized the title question didn’t precisely match the description, so fixed the title (criteria in description remains the same).
Chaos Theory n: resolves to logistic map iterated to the number of traders → Chaos Theory n: resolves to logistic map iterated to the number of traders+1
@deagol Just to check, if it closed with 4 traders at precisely 70%, that would result in a resolution of 47 (≈46.829...)?
@Imuli That would be the case if there were 3 traders. As the description always said, and the title now correctly asks, you’d need to do one more iteration.
@deagol Thanks for the correction! I somehow managed to write my implementation in alignment with the title even though I was reading the description.
@Imuli Here's my (corrected) Haskell implementation:
import Numeric.Natural (Natural)
chaos :: Num n => Natural -> n -> n
chaos n p = chaos' (n+1) where
chaos' 0 = p
chaos' n = (p + 3) x (1-x) where
x = chaos' $ n-1
@Imuli Yeah I don't know Haskell but if it matches the number I gave above it's probably right.
Now, I assume you'll run that to give you the best bet at any given p and n? 🧐
Data approximating mean of steady-state distribution for various values of p
0% average is 0.653
1% average is 0.652
2% average is 0.651
3% average is 0.650
4% average is 0.647
5% average is 0.646
6% average is 0.645
7% average is 0.644
8% average is 0.646
9% average is 0.646
10% average is 0.641
11% average is 0.640
12% average is 0.639
13% average is 0.634
14% average is 0.633
15% average is 0.632
16% average is 0.631
17% average is 0.630
18% average is 0.629
19% average is 0.629
20% average is 0.633
21% average is 0.633
22% average is 0.632
23% average is 0.625
24% average is 0.624
25% average is 0.624
26% average is 0.623
27% average is 0.622
28% average is 0.621
29% average is 0.627
30% average is 0.627
31% average is 0.626
32% average is 0.625
33% average is 0.625
34% average is 0.624
35% average is 0.624
36% average is 0.623
37% average is 0.615
38% average is 0.614
39% average is 0.614
40% average is 0.613
41% average is 0.612
42% average is 0.612
43% average is 0.611
44% average is 0.610
45% average is 0.602
46% average is 0.601
47% average is 0.605
48% average is 0.606
49% average is 0.600
50% average is 0.607
51% average is 0.609
52% average is 0.613
53% average is 0.611
54% average is 0.609
55% average is 0.612
56% average is 0.607
57% average is 0.608
58% average is 0.609
59% average is 0.596
60% average is 0.594
61% average is 0.598
62% average is 0.616
63% average is 0.629
64% average is 0.611
65% average is 0.627
66% average is 0.619
67% average is 0.631
68% average is 0.640
69% average is 0.638
70% average is 0.644
71% average is 0.618
72% average is 0.615
73% average is 0.620
74% average is 0.640
75% average is 0.643
76% average is 0.600
77% average is 0.607
78% average is 0.625
79% average is 0.582
80% average is 0.641
81% average is 0.632
82% average is 0.659
83% average is 0.572
84% average is 0.564
85% average is 0.523
86% average is 0.608
87% average is 0.517
88% average is 0.590
89% average is 0.553
90% average is 0.609
91% average is 0.565
92% average is 0.649
93% average is 0.547
94% average is 0.537
95% average is 0.560
96% average is 0.476
97% average is 0.524
98% average is 0.507
99% average is 0.504
100% average is 0.493