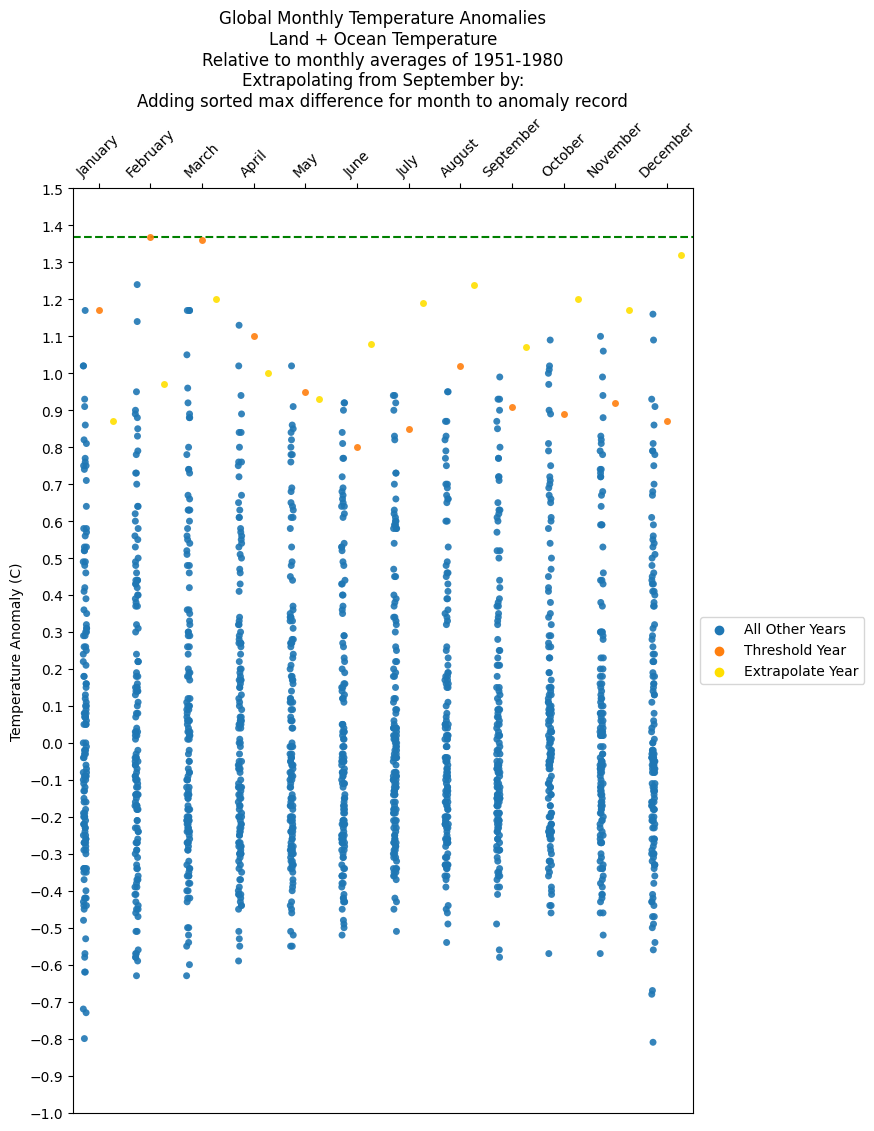
Resolves YES if in NASA's monthly GISTEMP data (Land+Ocean column) any entry for 2023 has the (strictly) highest monthly temperature anomaly, and NO otherwise. The current record is 1.37° (for "2016.13", which I think means Feb 2016). If the format of the GISTEMP data changes, I'll resolve according to whatever part of the GISTEMP data best corresponds to the meaning of the question title. If monthly GISTEMP data is unavailable at resolution, I'll look for another dataset of monthly global temperature anomalies.
For the first week that this market is open, I reserve the right to make whatever changes to the resolution criteria I feel best capture the spirit of the question title. I won't bet on this market during that week, but may bet after that week.
Edit 04-25: To clarify, one of the 2023 months has to be the highest number in the entire Land+Ocean column, not just the highest out of all the months with that name.
Edit 08-15: If multiple 2023 months have the same rounded anomaly that is higher than any pre-2023 anomaly, this still resolves YES.
 1,000
1,000🏅 Top traders
| # | Trader | Total profit |
|---|---|---|
| 1 | Ṁ425 | |
| 2 | Ṁ375 | |
| 3 | Ṁ276 | |
| 4 | Ṁ220 | |
| 5 | Ṁ127 |
People are also trading
2023    87   98  120  100   94  108  119  119  148  134  143  137    117 112     88  105  115  141  2023
Year   Jan  Feb  Mar  Apr  May  Jun  Jul  Aug  Sep  Oct  Nov  Dec    J-D D-N    DJF  MAM  JJA  SON  Year
Per https://data.giss.nasa.gov/gistemp/tabledata_v4/GLB.Ts+dSST.txt
Both September and November are higher than 137 for Feb 2016 December only the same.
@StevenK Resolve please
@StevenK might help to add that to the rules next time; I assumed this would be settled on 1st data, not subject to revisions. No worries, I'll just sell when I need the cash.
Thanks. Would suggest you set up another one like it with 1.47 as the mark to beat.
@ScottSupak Apologies for the confusion - I did mention it in the comments earlier, but I agree that the description was ambiguous and will make sure it's clearer next time.
@ScottSupak Look's like the 2005 cutoff was more realistic in my prediction as I predicted 1.423 C
https://manifold.markets/StevenK/will-any-month-in-2023-have-the-hig#3em2gPhGgfhqnQolA9p6
Updated my notebooks now with better forecast data for rest of October:
I'll just write a summary from now on (and edit it) rather than posting lots of charts, and simply update my above notebook if anyone is interested:
10/11/2023: I'm now predicting an anomaly of 1.388 to 1.428 C for October, with a 61-78% chance of October breaking the all-time monthly anomaly record for this question.
https://www.bbc.co.uk/news/science-environment-67017021
"Last month was 0.93C warmer than the average September temperature between 1991-2020, and 0.5C hotter than the previous record set in 2020."
Different temperature record. (edit meaning different to gistemp record, it seems to be same ERA5 data as climate reanalyser uses)
(The data, from the Copernicus Climate Change Service) but 0.5 is quite a bit bigger than the 0.39C needed in the Gistemp data.
https://climate.copernicus.eu/copernicus-september-2023-unprecedented-temperature-anomalies
Feb 2016 was really high in NASA's data which I don't think people are considering. I think the market is just anticipating uncertainty with regard to Sept without taking into account measurement difference in Feb 2016.
Aug 2023 was also higher in NASA's data than CFR though. July was lower.
If you take it all into consideration I think there's a bit less than a 50% chance the NASA record is broken based purely on the updated CFR data for September alone.
https://www.theclimatebrink.com/p/visualizing-a-summer-of-extremes
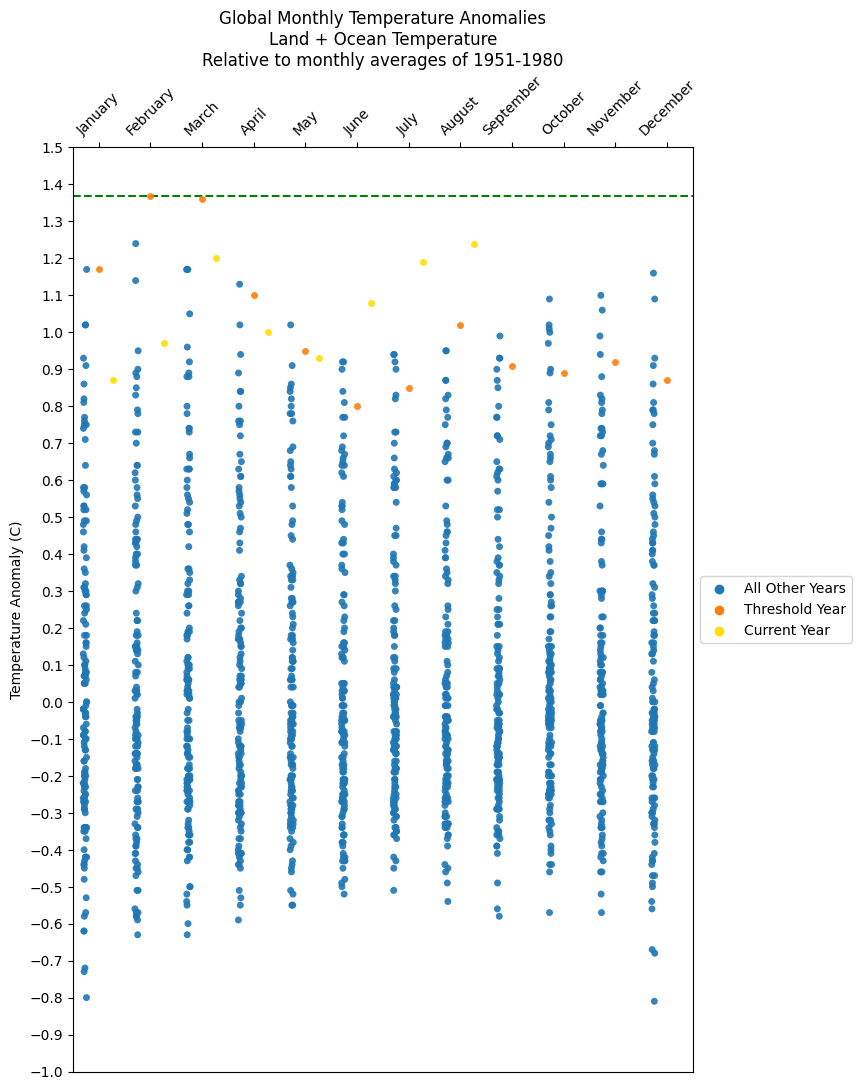
The fifth figure, below, shows the best estimate of September monthly temperatures alongside the 95th percentile confidence intervals (2-sigma). It shows that September is almost certain to smash prior monthly records by a large margin, with the month likely to end up around 0.85C over the 1991-2020 baseline period, or between 0.4C and 0.5C warmer than the next-warmest September (2020).
September 2020 was 0.99 in NASA's data, so this would correspond to between about 1.39 and 1.49. The 2sd interval looks a bit wider than that, but this still seems to imply that the highest anomaly this month is very likely.
@StevenK In fact, based on eyeballing the blue graph, the bottom of the 95% interval is at ~.78 and the previous record is at ~.37, which would correspond to a .41 difference or a 1.40 anomaly, which higher than 1.37 (the number to beat). Based on that and the possibility of a future month setting a record, a case for near-certainty could be made. (I'm not very confident that I didn't get confused, though.)
@StevenK Yes, but the uncertainty from predicting September of one dataset from first 21 days of data for that same dataset is fairly small. The uncertainty on how it converts to a different dataset is likely somewhat larger.
@StevenK Yes, the difference in datasets will add some uncertainty, but I guess I don't understand why this approach is yielding so much higher confidence than the calculations in the thread below. 0.4-0.5 degrees warmer average than 2020 looks plausible on the climatereanalyzer.org graph as well.
@StevenK No idea...in the last few days since I've been updating I haven't gone higher than 83% and now the highest I have is at 72%, so I do think the market is over overconfident, especially since the temperatures from the last couple days do look like they will trend downwards as expected for the rest of the month... https://manifold.markets/StevenK/will-any-month-in-2023-have-the-hig#3em2gPhGgfhqnQolA9p6
@StevenK Because the different dataset adds a lot of uncertainty.
Compare 2022
2023 looking like an average of 16.46
2022 had CR average of 15.97 and gistemp anomaly of 0.90
Add 16.46-15.97 to 0.90 and you get 1.39
Whereas using 2018
16.46-15.71+0.80=1.55
1.55 is miles over but 1.39 is very close, certainly within margin of error.
With anomaly back up to 1.07, I am getting all years 2009 to 2022 as over 1.37 but two years 2017 and 2022 are very close.
I also don't want to rule out the possibility of there being a downwards trend in these adjustments in recent years which might gives 2023 a better chance of the adjustment ending up less than the 1.39 suggested by the 2022 adjustment.
@parhizj Market overconfident? Or is it you who is underconfident?
For one thing, I think you are giving far too much weight to years prior to 2008. The adjustments are very different or at least look different. They are older and likely less reliable indicators of what is likely to be the adjustment this year and this might well be easily explained as different satellites in use.
The other thing is that if the September gistemp anomaly comes in just below 1.37 then the claim does not resolve no but instead question has 3 more months of opportunities to resolve yes. If we are getting close in September, these opportunities shouldn't be written off as negligible chances.
I see now - I guess Sep '20 happened to be relatively warm in the NASA data compared to the reanalyzer data, so taking the difference between Sep '23 and Sep '20 from the reanalyzer data and assuming it holds for NASA data will tend to overestimate how hot Sep '23 will be in NASA data?
Still, on the whole, I'd guess September is at least ~75% likely to be a record, and then if September isn't a record, maybe there's at least another ~50% chance that some other month is a record.
@StevenK (though I guess either way I should wait until they release the December data)
@ChristopherRandles I can't assign numbers to months past September so I may be projecting when I interpret the market's leap in high probability as anticipating September will break the record. If I am right about my interpretation of the market (and the increase in probability doesn't by in large correspond to the year as a whole) and September does not break the record, then I expect the probability for this market should decrease after middle October when the new data comes out back to or below 60% (which was the probability after NCEI's August's global report and the gistemp data update)
I did do a very loose intuitive analysis two months ago (https://manifold.markets/StevenK/will-any-month-in-2023-have-the-hig#1ZUxkfxYRXYXcibZhlpX) suggesting December might be the month most likely to break the record, but I don't think of this as "adding" to the probabilities for September and don't know what cumulative probability to assign to Oct-Dec other than it is likely (> 50%). If you think September is 75%, and Oct,Nov,Dec is 50% I don't think you can add them, so are still left with the probability for the market at 75%. If September doesn't break the record, I think I would wait until seeing CFSR temperatures for the middle of each successive month before updating to decrease my bet size in this market.
Relating to that old analysis, the upper-bound I anticipated for August was broken though as it was a record setting month, but I still think they are somewhat useful to compare visually against 2016 and other years. It is interesting to suggest that the upper-bound for September using this idea would be an under-estimate given my current estimate range using the more recent analyses I did, suggesting 1.382 to 1.430), and that of the four remaining months it actually suggests September having the lowest chance of the four of breaking the record (without any other knowledge).
(intuitive) upper-bound (projection):
@parhizj The jump in probability was me betting based on the Hausfather article, and it did reflect my expectation that September would set a record. If the probability for September is 75%, and the probability for any of the other months setting a record conditional on September not setting a record is 50%, then there's an 87.5% chance the market resolves YES. The model is interesting, but we have data for most of September now, and I don't see the model overriding that, though it might be a reason to think the rest of the month will be a little less hot than Hausfather's regression suggests.
@StevenK If it is completely independent data we might also expect 75%+50%=87.5% but in reality, how do the probabilities combine?
One line of expectation is from a different dataset daily numbers for September. Another liner is looking at causes for large anomalies like ENSO, shipping pollution cuts etc. which in general suggest larger anomalies later in the year. The data and lines of expectation look completely different but there are correlations between successive months temperature anomalies.
I think we have to conclude these are not completely independent. If September comes in at 1.35C then we might be more inclined to think expected further increases are going to push the anomaly over 1.37C. Whereas if September gistemp data comes in at 1.25, barely more than 1.24C in August, it might look more like the anomalies are getting close to their peak and may not reach 1.38C.
Do the different lines of expectation actually work better in combination? If the September daily data is pretty much ruling out less than 1.3C and this is therefore going to be an increase on August anomaly which is in line with out expectations of increasing anomalies then we have more confidence in this reasoning and expect the record to be broken.
Not sure about the maths of "actually work better in combination".
I am thinking we ought to be like 80% sure there should be an increasing trend of anomalies towards the end of the year. However there may be a lot of noise we cannot explain with expected trends such that there is still a good chance that the expected increasing trend does not actually show up. Not sure I can put decent numbers on this though.
@ChristopherRandles Definitely agree they're not independent. 50% was a vague guess conditional on lower than expected September numbers, based on something like "it's a high bar but it's probably going to be a hot rest of the year".
@parhizj So your model was predicting at one point that the last couple of days would be even hotter? Interesting. I would have thought that every day with a temp anomaly above 1 c on climate reanalyzer is pulling strong in the yes direction and a huge outlier such that'd you expect reversion to mean.