The number of tropical storms in the Atlantic in 2024 that receive a name from the National Hurricane Center and NOAA. The record number of named storms was 30, in 2020.
🏅 Top traders
| # | Trader | Total profit |
|---|---|---|
| 1 | Ṁ1,019 | |
| 2 | Ṁ503 | |
| 3 | Ṁ410 | |
| 4 | Ṁ301 | |
| 5 | Ṁ247 |
People are also trading
Edit: had a problem with double counting... that shifts the probabilites slightly..
What I get now under different scenarios for the two disturbances in the Atlantic (weighting a normal climatology with ensemble probabilities until Oct. 14):
# Named Storms in bins: {(11, 15): 65.65597724262948, (16, 20): 34.194078278186765, (21, 25): 0.1499100830268043, (26, 30): 3.4394976133551305e-05, (31, 35): 1.1808170372811923e-09, (36, 999): 1.0124506645081181e-14}I expect the number of tropical storms in the next month to be on average near the climatological mean. Using a couple different climatological estimates, I get the 11-15 bin as the most likely, with 0-10 as the second most likely. This contrasts with the ACE market where I still expect above normal ACE with albeit fewer, more powerful storms.
Edit: Ran the same analysis again with Francine, still 11-15 bin as likely. With ACE, now I expect normal ACE (or near normal) ...
https://www.nhc.noaa.gov/climo/
September 9 is when we have on average our 8th storm. Francine makes 7. This puts us a week behind the seasonal average of 14, right in the middle of the 11-15 bin.
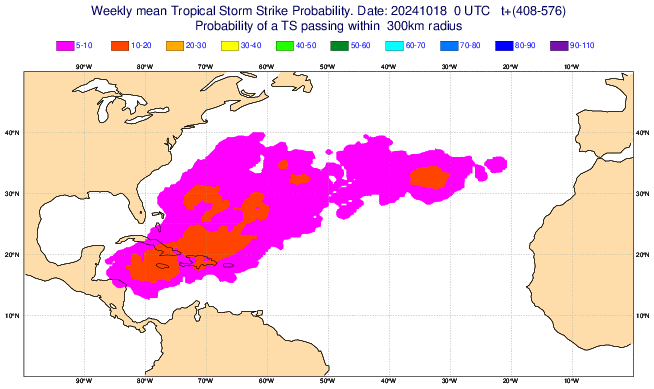
NHC is also forceasting a TC in the next week at 70% chance, so this matches as well.
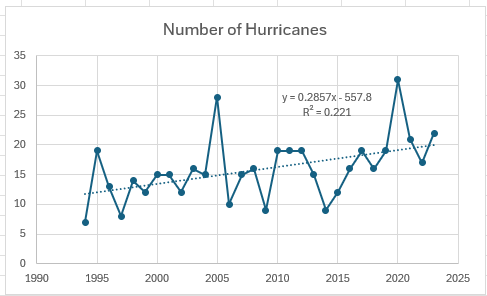
Standard linear regression: n_storms = 0.2857 year - 557.8
R^2=0.221 - so the year only captures a bit of the variance
Year-based estimate: 20.4568 storms
Data is at the bottom.

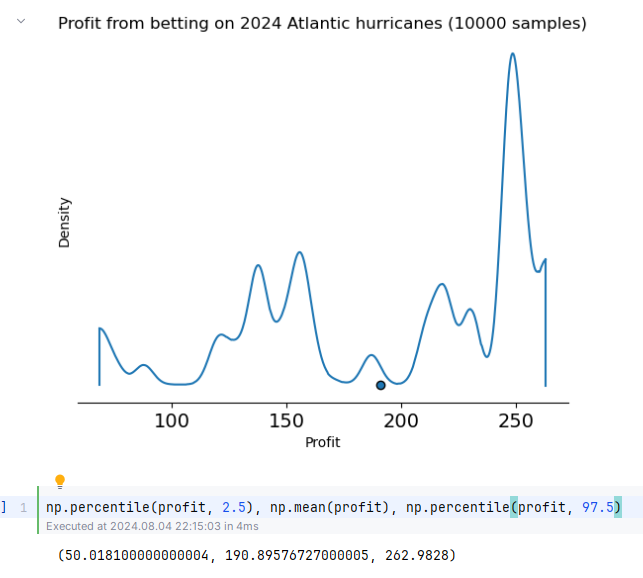
I also did a simulation with a linear model and increasing variance and then multiplied the posterior storms by 1+HalfNormal(0.1). (I'll post a notebook link when I have time.) It identified some of the items as under-estimated. But when I bet, they went haywire. So, I've provided some more liquidity. But I reached my limit. Someone else will need to correct the huge overestimate for 36+. It was fun, but a lot of time for 191 Manna (expected).


Data (storms per year 1994-2023)
# From the number of entries recorded on https://www.aoml.noaa.gov/hrd/hurdat/<year>.html
"Year","Number of Hurricanes"
2023, 22
2022, 17
2021, 21
2020, 31
2019, 19
2018, 16
2017, 19
2016, 16
2015, 12
2014, 9
2013, 15
2012, 19
2011, 19
2010, 19
2009, 9
2008, 16
2007, 15
2006, 10
2005, 28
2004, 15
2003, 16
2002, 12
2001, 15
2000, 15
1999, 12
1998, 14
1997, 8
1996, 13
1995, 19
1994, 7
@EricMoyer You are counting (unnamed named storms) and tropical depressions in your count ...
Edit: Here is the count I get from IBtracks NA:
{1966: 15,
1967: 13,
1968: 9,
1969: 18,
1970: 14,
1971: 13,
1972: 7,
1973: 8,
1974: 11,
1975: 9,
1976: 10,
1977: 6,
1978: 12,
1979: 9,
1980: 11,
1981: 12,
1982: 6,
1983: 4,
1984: 13,
1985: 11,
1986: 6,
1987: 7,
1988: 12,
1989: 11,
1990: 14,
1991: 8,
1992: 7,
1993: 8,
1994: 7,
1995: 19,
1996: 13,
1997: 8,
1998: 14,
1999: 12,
2000: 15,
2001: 15,
2002: 12,
2003: 16,
2004: 15,
2005: 28,
2006: 10,
2007: 15,
2008: 16,
2009: 9,
2010: 19,
2011: 19,
2012: 19,
2013: 14,
2014: 8,
2015: 11,
2016: 15,
2017: 17,
2018: 15,
2019: 18,
2020: 30,
2021: 21,
2022: 14,
2023: 19}
Edit: deleted. Nevermind, this is satisfied by the resolution criteria.
@ScottSupak Just wondering, what makes you expect that this hurricane season will be so disastrous?
NOAA predicts 17-25 named storms:
https://www.noaa.gov/news-release/noaa-predicts-above-normal-2024-atlantic-hurricane-season
