On March 13, 2024, I will run a script to calculate the average probability of open Manifold markets. Only binary markets will be counted.
Resolves to a linear interpolation between nearest bounding answers, or ">55" or "<45" if the average is not one of the middle answers.
Examples:
53.59% will resolve to 59% 54 and 41% 53.
55.4% will resolve to 60% 55 and 40% >55
 1,000
1,000🏅 Top traders
| # | Trader | Total profit |
|---|---|---|
| 1 | Ṁ324 | |
| 2 | Ṁ130 | |
| 3 | Ṁ49 | |
| 4 | Ṁ23 | |
| 5 | Ṁ20 |
People are also trading
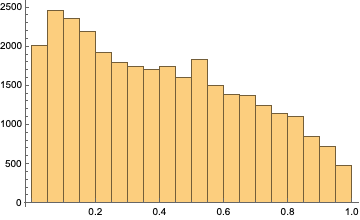
@ItsMe ~44.2% of the resolved binary markets to date were resolved yes (ignoring canceled markets) and the average probability of open markets is now at ~40.9%.
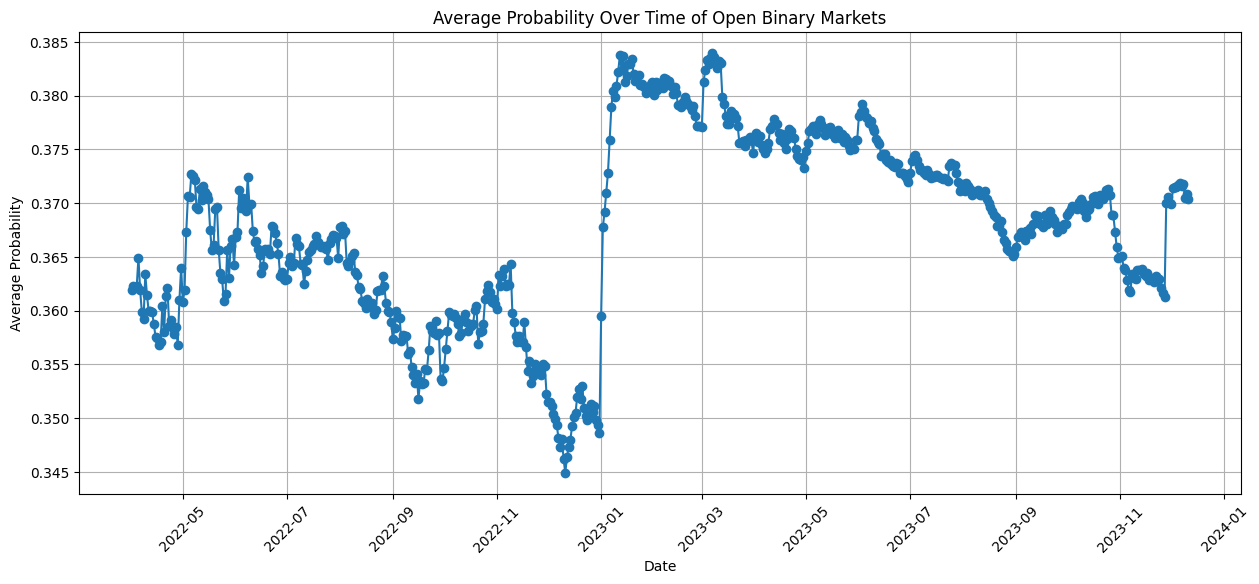
That difference seems expected: no markets tend to linger around longer, often until their planned resolution date, whereas yes resolutions can more often happen prematurely in response to some news. This also explains why the end of the calendar year is followed by a sharp increase in the average probability of open markets. However, I would also have expected to see an overall downward trend caused by markets with longer expiration dates, which hasn't materialized in the data so far, or at least might take longer to be noticeable.
https://colab.research.google.com/drive/1DV8e1VpVLs0m3zEwVwAS2u1V2lj9dF0w?usp=sharing
Current average: 37%
Let me know if there's a glaring mistake in the notebook, haven't proofread it, so no guarantees
@3721126 I didn't calculate it beforehand, so it's possible my bounds are off. I made a follow-up here /Mira/what-is-the-average-probability-of-0307e1520ab9
I expected there to be a NO bias, but 35-38% is steeper than I expected!