I’m currently trying to halve the time I spend on social media (see specifics in embed market)
On Monday (note : I live in UTC+1), March 18th, I will compute the variation rate of my phone screentime defined as X = (new - old)/old
Where past is my daily average over [Feb 5, March 3] and new is my daily average over [March 4, March 17]
This market resolves to probability = X + 1/2. For example, if new = past, then X = 0 and this resolves PROB = 1/2 = 50%.
If needed, I will round to the nearest % (ie 69.9% resolves 70%)
In the event X >= 1/2 or X <= -1/2, this resolves YES or NO respectively.
I will not be betting on this market.
Edit : data is collected through the default iOs Screen Time feature, and old = 115,46 minutes per day (week by week screenshots in embed market)
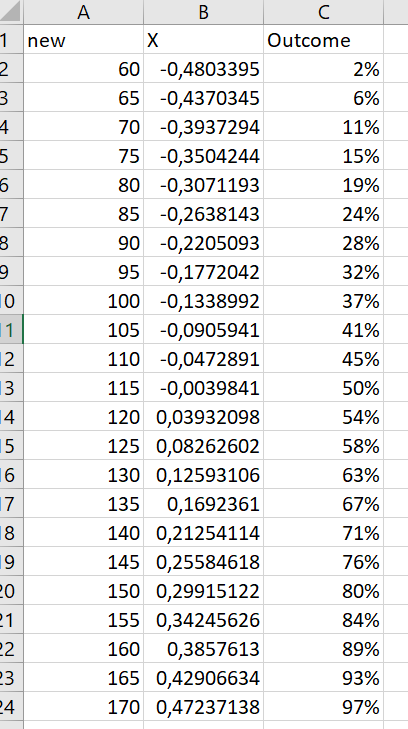
Edit : to make this more intuitive, here's a little time - associated outcome table
 1,000
1,000🏅 Top traders
| # | Trader | Total profit |
|---|---|---|
| 1 | Ṁ11 | |
| 2 | Ṁ3 |