Short description
In the image below, there are two sets of points, green and red. One of them is "random" while another one has been produced by me via clicking points into the square. Market resolves to YES if the green one has been produced by me and NO otherwise.
All 100 points have now been revealed

Details
One of the point sets has been produced by sampling from a uniform distribution over a square. The length of this square is strictly less than the bounding box in the square above. Call this the Hidden Square. I won't tell you the side length of the Hidden Square.
Another of these point sets has been produced by sampling from me. Some details of the data generation process:
The points were generated by clicking a location in a UI interface on a mousepad.
I generated 100 points in roughly 90 seconds.
I have practiced.
If a point landed outside of the Hidden Square, I discarded that point and generated a new one.
I have applied one or several entropy-increasing transformations to the final point set.
To elaborate on the last point, here is a hypothetical example of such a transformation: "Given a point, round its x-coordinate to the nearest multiple of 10, and then add a uniformly random integer between 0-9 to it." Intuitively, this makes the set of points "more random", i.e. harder to distinguish from the "actually random set".
I won't tell which transformations I've used.
EDIT: Here are the transformations I used:
Reflect the points along the two perpendicular bisectors of the sides and one of the diagonals (giving 8 possible destinations for the point), in a uniformly random way.
Reveal the points in a random order, in a uniformly random way.
The length of the hidden square is 400 - 6*2, with the same center as the bounding box.
Other
Here is a market on how many points it will take for traders to figure out the answer: https://manifold.markets/Loppukilpailija/how-many-points-are-needed-to-disti-74e061c28bb6
The data
The data in a more convenient form. The bounding box in the image has corners at (100, 100) and (500, 500).
GREEN:
226 280
253 454
150 465
405 217
456 203
370 268
373 260
454 170
166 474
274 247
272 377
446 459
281 434
116 385
464 250
299 396
446 271
271 473
354 281
149 304
424 303
180 220
130 454
344 304
409 154
231 256
462 195
311 459
299 272
465 374
434 220
157 268
227 230
446 182
337 416
244 478
280 284
203 240
249 482
279 356
154 463
435 288
275 357
305 252
357 200
219 166
379 390
451 438
453 436
303 270
488 165
112 440
414 233
386 269
314 415
306 324
308 447
372 202
386 391
404 247
452 277
364 204
176 399
281 462
156 227
290 410
327 245
310 140
378 220
445 455
124 300
491 417
365 441
116 277
311 205
494 166
290 375
276 314
357 151
322 392
452 345
370 162
327 437
336 337
308 275
221 430
423 242
324 238
300 305
160 209
203 127
444 333
349 486
293 239
345 370
211 228
154 240
221 108
349 440
242 179
RED:
285 229
142 422
250 224
468 169
410 215
301 178
232 247
371 480
417 294
410 196
128 122
213 302
400 399
444 373
163 213
155 454
340 319
477 386
149 369
302 442
204 470
396 152
123 306
118 454
106 110
362 399
127 209
448 346
188 286
442 135
263 124
452 351
183 429
285 150
209 405
283 236
453 132
332 374
296 176
227 202
251 480
325 322
350 242
270 341
147 368
469 266
281 167
418 165
449 416
223 158
265 171
239 433
462 398
110 241
345 318
210 167
291 477
295 125
381 236
487 362
359 117
381 283
289 205
349 393
183 244
479 447
200 480
224 144
433 427
133 346
374 206
127 413
246 399
457 155
247 251
299 292
163 142
367 344
276 349
364 302
167 340
423 133
424 427
204 245
150 385
170 258
133 361
357 200
361 307
176 175
304 148
223 163
366 169
437 437
239 123
355 465
211 283
341 469
235 486
287 488
 1,000
1,000🏅 Top traders
| # | Trader | Total profit |
|---|---|---|
| 1 | Ṁ3,271 | |
| 2 | Ṁ1,945 | |
| 3 | Ṁ1,314 | |
| 4 | Ṁ1,050 | |
| 5 | Ṁ539 |
(deleted)
Anyone up for some more randomized fun?
https://manifold.markets/BenjaminShindel/which-set-of-words-is-random?r=QmVuamFtaW5TaGluZGVs
I am doing post mortem on my chi-square test. The main result I considered was obtained using 80 points. The source code is here: https://pastebin.com/n56c80fA
Results:
P-value green: 0.0116
P-value red: 0.2757
P-value green: 0.0909
P-value red: 0.8942
Now, I used the generator published by @Loppukilpailija to generate 80 points many times, reconstructing the histogram of p-values for middle digit and last digit.
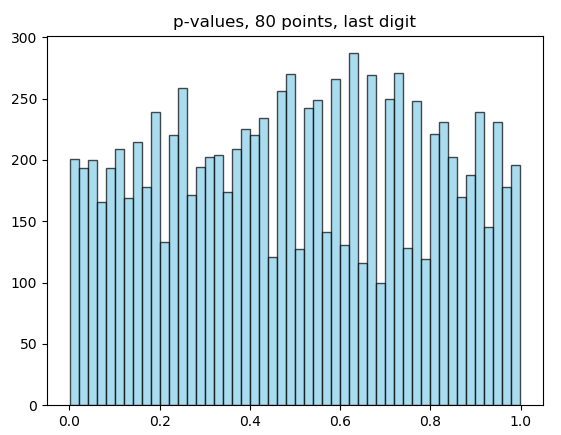
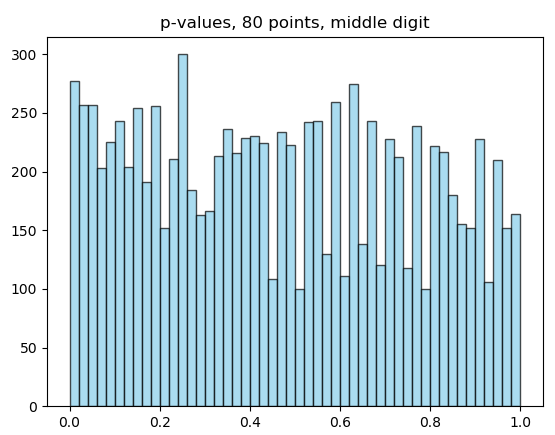
So, I am still confused. I would have to be extremely unlucky for the test fail as it did. The source code to the histograms, including the random generator I copied in, can be found here: https://pastebin.com/zR5wpkBd
Just to be clear: The histograms of the single-digits are not random uniform, there are mild differences (I can past the histograms, calculation is included in the code). But 80 points repeatedly produce almost evenly distributed p-values, so the difference is probably not detectable on 80 points.
P.S. Yes, the code is stupidly ineffective, I was lazy to polish it.
Fantastic market @Loppukilpailija. Was a lot of fun.
I got eaten up by this market because I was underconfident and thought that others had more knowledge than me. Lucky to still come out with a profit. Was generally confused and still am.
I struggled between the arguments that easy human-generated errors like average distance, angles, and quadrant flips all pointed to RED, while GREEN was far too clumpy and RED look very random on many metrics
@PC I think the tale of this market was not that anyone should have been more confident.
To make money here, you should have been less confident. We just didn’t have enough evidence to support either YES or NO with high confidence.
For example, my private estimate was 51% for YES. What I should have done is buy NO when the market was above 90% YES, not because I thought the outcome would be NO, but because I estimated a 49% chance of NO and buying NO was cheap.
Anyone who spent a very large fraction of their bankroll here was overconfident. Even if they bet correctly on NO. Because about half the time they’d had lost.
I am glad that this market bet so strongly against the actual outcome. This way one can feel the overconfidence and the associated loss. If the market had resolved YES instead, it would have been harder to recognise the mistake, given that one has won.
All of my point! Lost!
Very nice markets, big thanks to OP
Thank you @Loppukilpailija for this great game! I learned something, and following the comments was a lot of fun.
when you over-rely on p-values.
I don't think p-values are the specific issue? Just over-relying on methods of analysis you don't necessarily understand? "likelihood that the null hypothesis distribution would produce a sample with a property greater than or equal to this" is a reasonable thing to look at here, right?
@jacksonpolack I'm not sure it is, it makes you very vulnerable to accidental p-hacking when throwing properties at the wall and trying to get one to stick, with no preregistration and pretty much zero clues as to what properties have a high chance of actually being correlated
That's just 'running multiple tests and believing in the result if only one is positive', which can happen with or without p-values
How it went for me: I was very enthusiastic about the market from the start, but I had the uneasy feeling "I hope OP didn't go overboard with the secret transformation stuff, they may just render a ton of work completely worthless". I tried lots and lots of statistics and became convinced green was a way to go. Then at about 80 points it all collapsed, also OP revealed that yes, everything I was trying was in fact bullshit. I was left in a state of total doubt, sold all my green and bought 20 red thinking that I no longer had any idea what was going on, but the market was probably overconfident. I made some profit, but it's clear I'm not good enough at stats to have solved it. Not sure if anybody got this one right in a rigorous, principled way, but if you did, wow, you have my respect.
@Tasty_Y Maybe someone who was not betting a lot or engaging with the comments knew something that we didn't, but I don't think myself, Phil, or Capy really knew what was going on. Even if I ended up being right, my reasoning was all wrong.
@Shump I know you just don’t believe me, but I think the knowledge that one set had a transform that added radial-only spread was critical information that could be used.
@capybara Great job! Can you share more? I couldn’t figure it out myself. Got scared that Shump was selling
@capybara I tried to convince ppl in the comments below. If it doesn’t make sense, I can try again.
@Shump I actually wonder why you sold. I imagine it was because you did the analysis of distance from the middle. I think your reasoning was sound.
@PC Each point gets sent to one of 8 positions, but all 8 positions are roughly the same at distance from (300,300) for each point. So by spread I mean spread around at whatever radial distance they started.
@PC For example, distance to neighbor. Points near (300,300) effectively won’t move. Points far from (300,300) will move a lot. Areas with few points but away from (300,300) are more likely to get a point move into it than an area with few points near (300,300). For example.
@PC I left a comment in a thread below but my reasoning is that basically, if we apply the transformations again to each dataset, if the difference in metrics is real then you would expect the difference to remain, but if it's a fluke you will see regression to the mean. All of the indicators for red failed on this test, so I was left with no argument for red, and still several for green. The distance from the middle is one thing but some other metrics that indicate green also seem to be resistant to the transformation.
@capybara That doesn't sound right: the OPtransform is only erasing information, it can't introduce any noticeably abnormalities. It's not going to make things randomer than random, or more evenly spread than random in any way. A uniformly random set of points to which OPtransform was applies would be indistinguishable from another random one.
@PC Yes. All of my indicators relied on order. Reshuffle the dataset, and they become insignificant. Some green indicators like discrepancy also fail the analogous test for the other transformations, but not all.
@PC so it might have been luck. But the distribution of potential values for RED is more extreme, and it happened that the transformation created one that was extreme
sample 2 points from uniform in 389x389 square. And run the following test: are two points within a 10x10 test square. The probability is uniform over larger square. Now sample 2 points and apply transform. The probability of both points being within test square is now higher near the center compared to far from center.
@capybara Finally, sample 2 points and run transform twice. Nothing changes from the situation where you applied it just once.
@capybara 1 point is simpler than 2, will your idea work with 1 point? 10x10 positioned however I want?
@Tasty_Y Because the quality that chances is point density. It changes differently according to distance from centre.
@capybara This has already been said, but the uniform random distribution, with the transformations applied to it, is still the uniform random distribution. Point density doesn't change. That's because for every point, there are 8 points that can be mapped to it after transformation, each with 1/8 chance. If you're getting anything different you might have a bug.
@capybara Do I understand the test you are proposing right?
Generate 2 points. Notice how often both end up in a 10x10 square, call this P1.
Generate 2 points and apply the transform, see how often both end up in the same 10x10 square, call it P2.
And the claim is that P1!=P2? Is that right?
@Shump Yes, but 100 points sampled from uniform distribution is it’s own thing.
Example: expected neighbor distance differs for 50 vs 100 point samples. So clearly there are properties of 100 point samples that are not properties of the uniform distribution.
@Tasty_Y Yes. Choose an test location that’s away from centre for maximum effect, or just average over all possible locations of 10x10 box.
@capybara I went ahead, did the test as described and P1 and P2 became equal with enough trials, as was expected. I think you are very much mistaken, feel free to write some simulations for yourself and see.
@capybara it should be equal if you perform this experiment many times, because you are not changing the distribution.
@Shump I think that is this might be the point. I believe that the average is the same across many tests, but the variance increases
I tried a few metrics and couldn't find any evidence to support the idea about radial spread and the box test, so that looks to be false intuition!
Having said that, I would like to present an alternative perspective. What is useful to do when you know the transforms have been applied is to realise that from the single given rand_transform(human) we can compute all possible transformed point sets. No single one is better, and given that we can, we should consider all of them instead of just the one we are given. Below is the scipy.discrepancy for 10k random samples (blue), 10k transforms of reds (orange) and 10k transforms of greens (light green). The original red and green discrepancy are the dashed red and green lines.
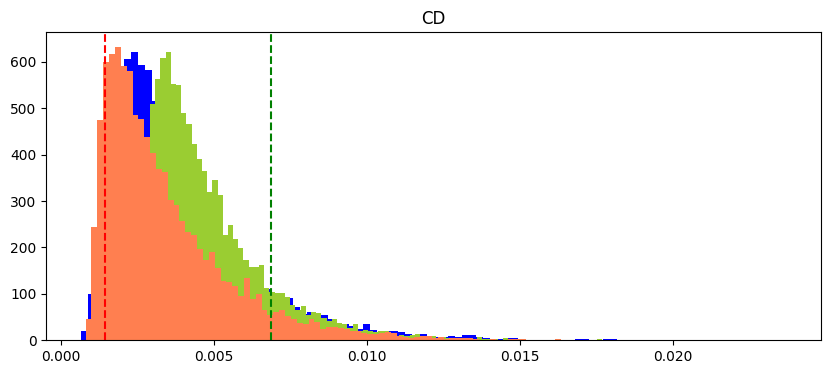
You should do this so as it is free information as to whether the single given human generated sample has had an unlikely transform.
With this, I think a lot of metics that are 9/1 in favour of green being human will regress to say 6/5. In the end, this idea can't be used to favour No, but it can certainly be used as an argument as to why odds should be less than say 70% Yes.
So I think there was a signal to which I was ascribing a very wrong interpretation, and @Shump's argument about regression to the mean is probably a better line of intuition.