How many net additional housing completions in London in 2024-25?
3
200Ṁ89resolved Nov 20
Resolved
30,000 - 34,9991H
6H
1D
1W
1M
ALL
100%21%
30,000 - 34,999
8%
Below 25,000
30%
25,000 - 29,999
19%
35,000 - 39,999
8%
40,000 - 44,999
7%
45,000 - 49,999
6%
50,000+
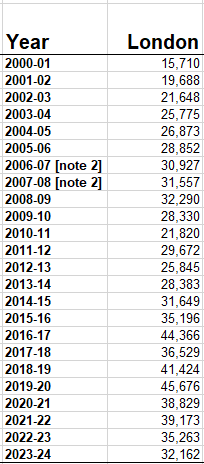
RESOLVED TO 32,680 ON 20 NOV 2025
#############################
This market will resolve when the 2024-25 figures for net additional completions are released by MHCLG and shown in Live Table 118 (or its successor).
Live tables on housing supply: net additional dwellings - GOV.UK
Net additional completions are roughly housing completions minus demolitions.
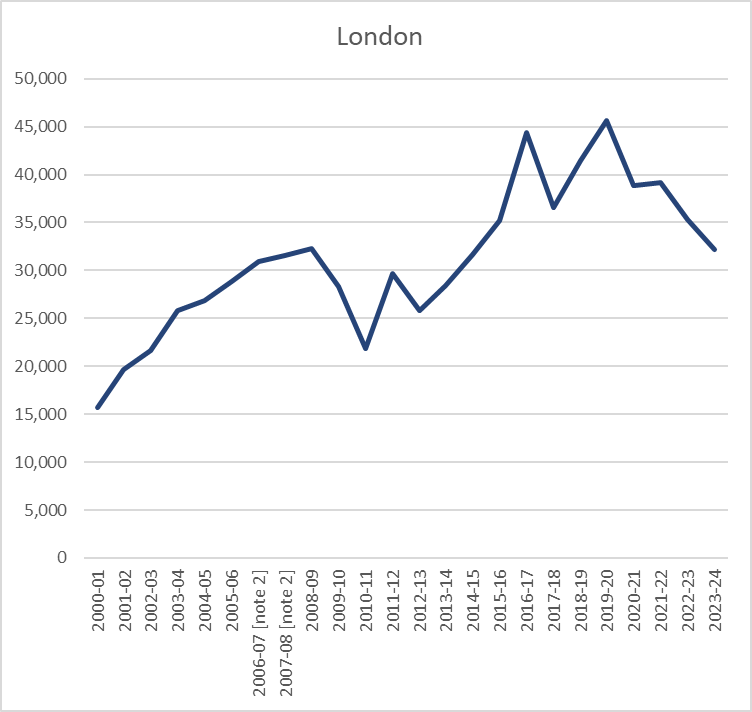
Some past data:
This question is managed and resolved by Manifold.
Get  1,000 to start trading!
1,000🏅 Top traders
| # | Name | Total profit |
|---|---|---|
| 1 | Ṁ14 | |
| 2 | Ṁ10 | |
| 3 | Ṁ2 |
People are also trading
Related questions
How many passengers will pass through London Luton airport in 2025?
18m
Conditional on Labour winning the next election, will English housing rents increase by more than 3% in 2025?
90% chance
UK Labour builds how many homes by July 4, 2029?
1.2m
How many housing units will California authorize in 2025?
-22,389
NYC housing units built in 2025?
31,759
Will NYC build more housing in 2026 than 2025?
67% chance
Will London's population exceed 10 million people by the end of 2025?
19% chance
Will the UK build >1.5m new homes by the end of Q2 2029
25% chance
NYC housing units built in 2026?
33,964
2x2: Will Labour get a majority, Will more than 200k houses be built per year, on average, in England and Wales?