Resolution criteria
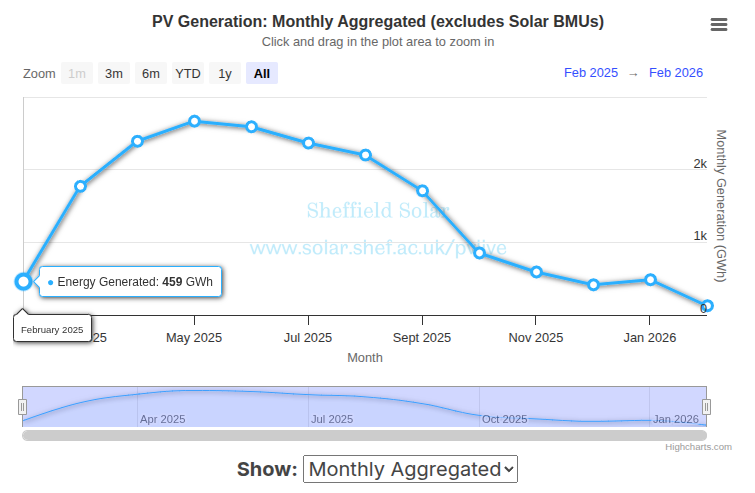
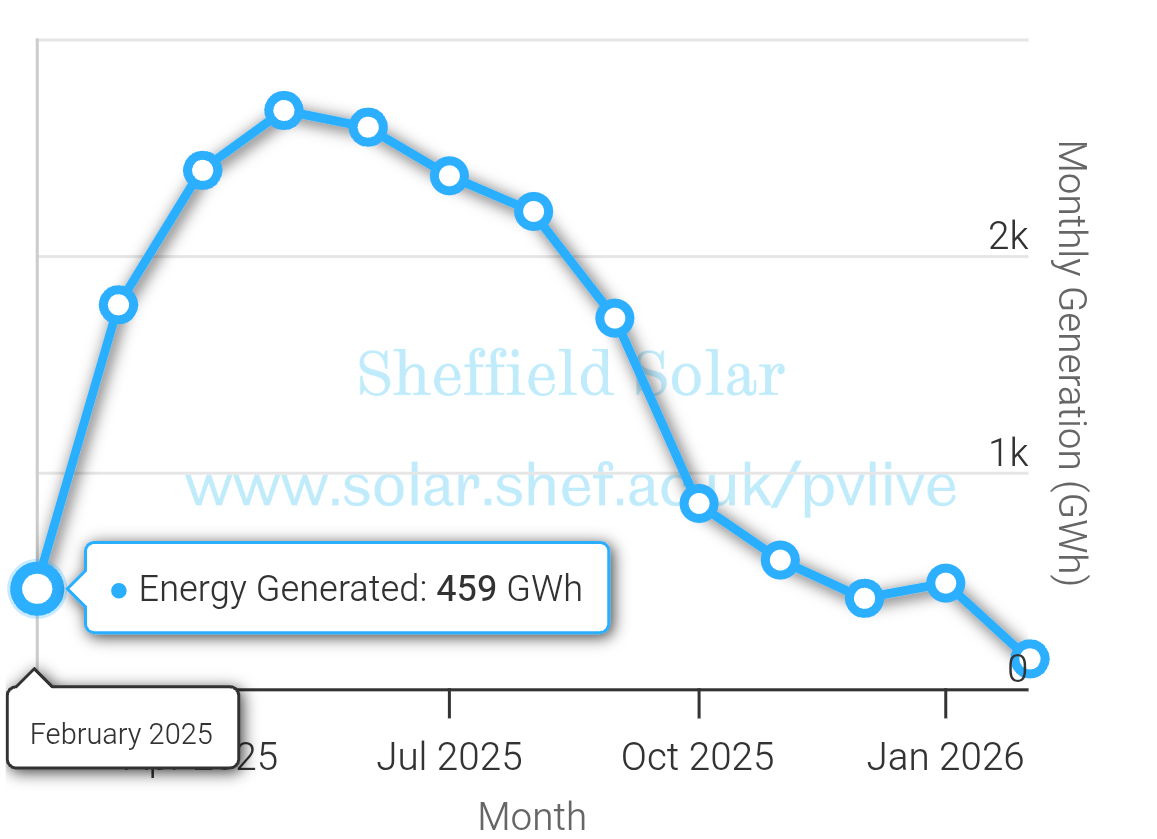
This market resolves YES if the UK's total solar energy production in February 2026 exceeds 459 GWh, as measured by the Sheffield Solar PV_Live national dashboard's "Monthly Yield" aggregate (GWh). The February 2025 baseline is 459 GWh. Resolution will be determined by accessing the historical data download feature at https://www.solar.sheffield.ac.uk/pvlive/, which provides monthly yield figures for all months since 2013.
Background
The UK solar market grew 50% year-on-year in 2025, adding 3.5 GWp of capacity and taking total capacity past 23 GWp. In 2026, the UK solar market is forecast to grow by 5-5.5 GW, continuing the expansion trajectory. Solar power in Great Britain had a record-breaking start to 2025, with solar up 32%, producing a record 9.91 TWh. February is a winter month in the Northern Hemisphere, meaning solar output is typically lower than summer months. A solar panel system in the UK will produce about 70% of its total output in spring and summer (March to August), with the remaining 30% coming in autumn and winter (September to February).
Considerations
The comparison is between two specific months one year apart, making weather conditions a significant variable. February 2025 was part of a record-breaking year for UK solar, so exceeding that baseline will depend on both continued capacity growth and favorable weather conditions in February 2026. The Sheffield Solar PV_Live dashboard is the authoritative source used by National Grid for solar generation data.
Interesting Links
National Grid Live: grid.iamkate.com
Energy Dashboard (Live Graphs): energydashboard.co.uk/live
UK Power Sites List: energydashboard.co.uk/sites
Windy Solar Forecast: windy.com/solar-power
Update 2026-02-12 (PST) (AI summary of creator comment): The creator has clarified that resolution will be based on the "Monthly Aggregated" view on the graph at https://www.solar.sheffield.ac.uk/pvlive/, rather than by downloading and manually summing historical data.
Update 2026-02-12 (PST) (AI summary of creator comment): The creator has determined that the graph view on the Sheffield Solar PV_Live dashboard only tracks 'Metered' (Transmission) solar and effectively ignores rooftop solar installations. The CSV download from Sheffield PV_Live specifically models 'Embedded' generation which includes rooftop solar.
Resolution will now prioritize the Sheffield CSV (Total Generation) as the primary source of truth, rather than the "Monthly Aggregated" graph view previously indicated. This ensures all UK solar generation is counted, not just large solar farms connected to the transmission grid.
 1,000
1,000People are also trading
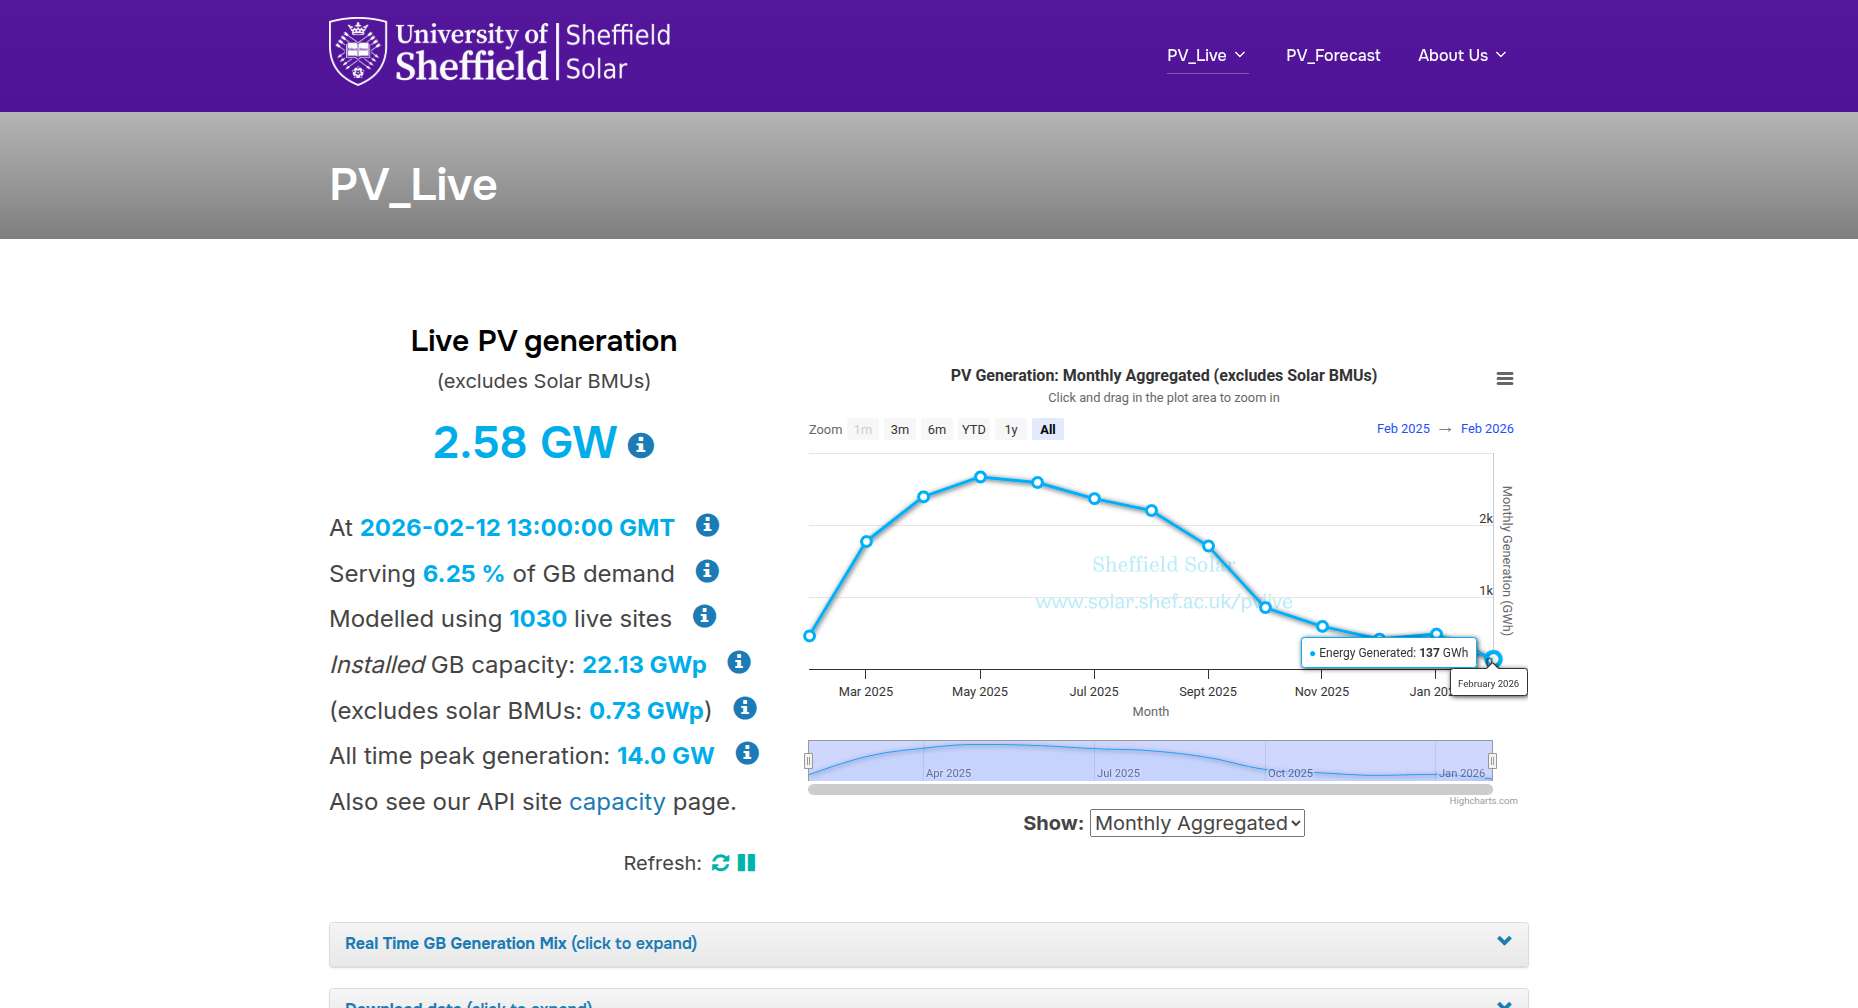
@DaleKirkwood the graph currently shows that the solar energy generated in Feb. 2026 is more than that in Feb 2025. Will you resolve this market based off of the graph, or by downloading the historical data and summing the amounts generated?
@robert Hi Robert
It will be based off the graph based on "Monthly Aggregated"
Currently it shows 136GWh in Feb 2026
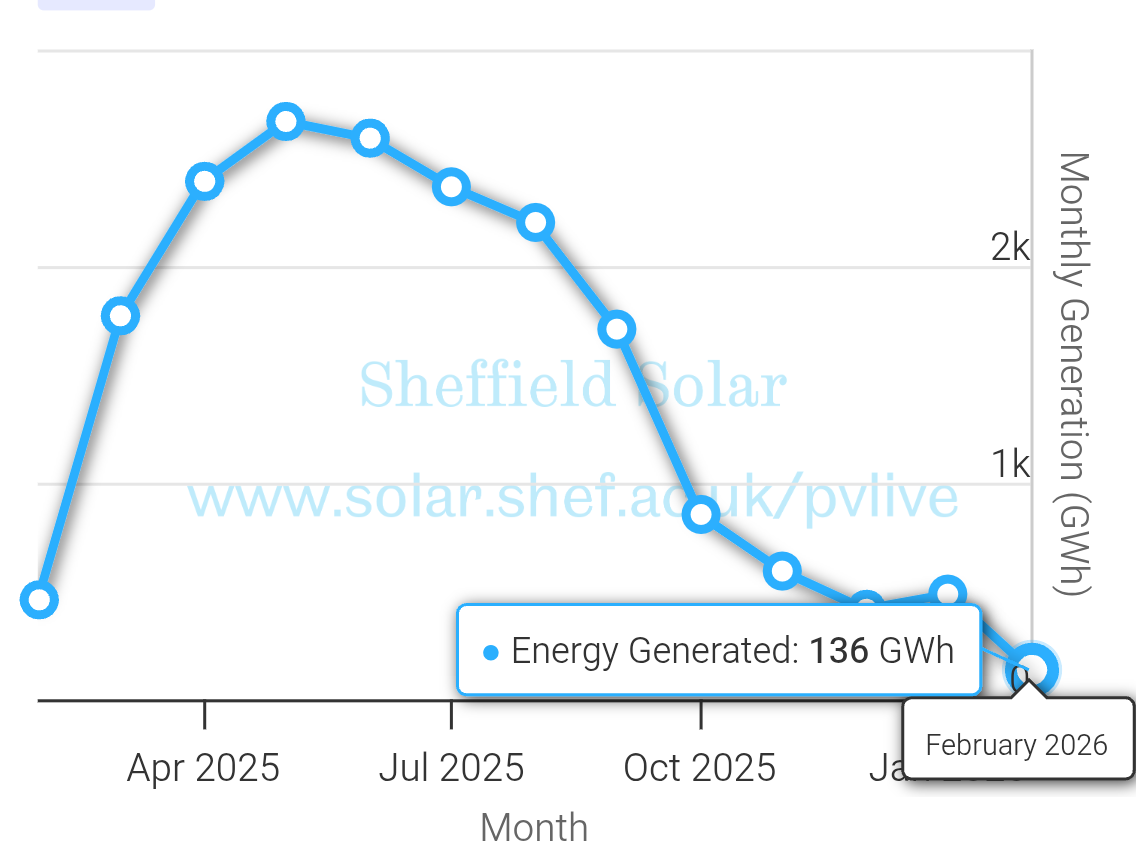
Vs 459GWh for February last year
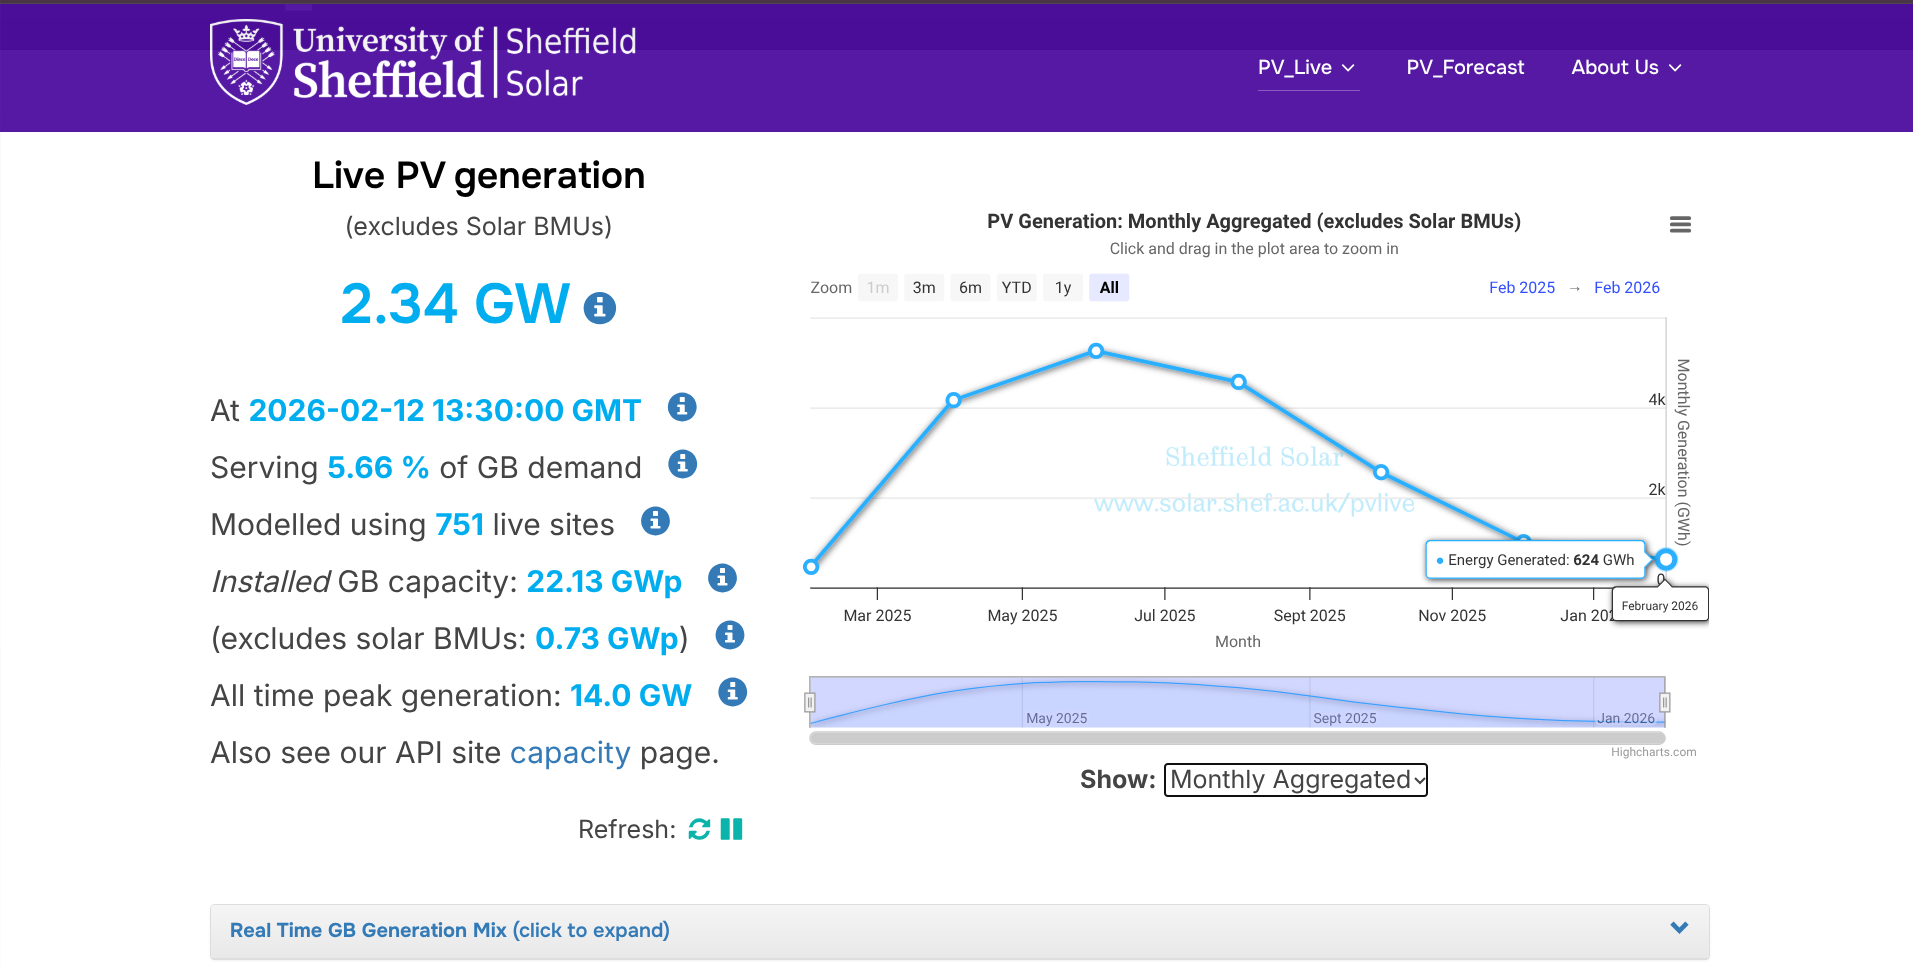
Thanks for the clarification. This is what the graph looks like for me, but as long as it has sane numbers for you...
This is a screenshot of the full page, I have checked from 3 devices just to make sure & even via a VPN.
It's a little concerning, could you share a screenshot of the fullpage for comparison?
Thanks for bringing it to light.
(The grey pv live thing is hidden under the purple banner). It looks like I can only see every other month??
@robert thanks for this. It does seem strange and the CSV numbers do not correlate with either.
From what I can see, there is no aggregate data for February. I will monitor the site and if needed we may have to change the data source.
Meanwhile if anyone else can check the site and share their results, that would be very helpful.
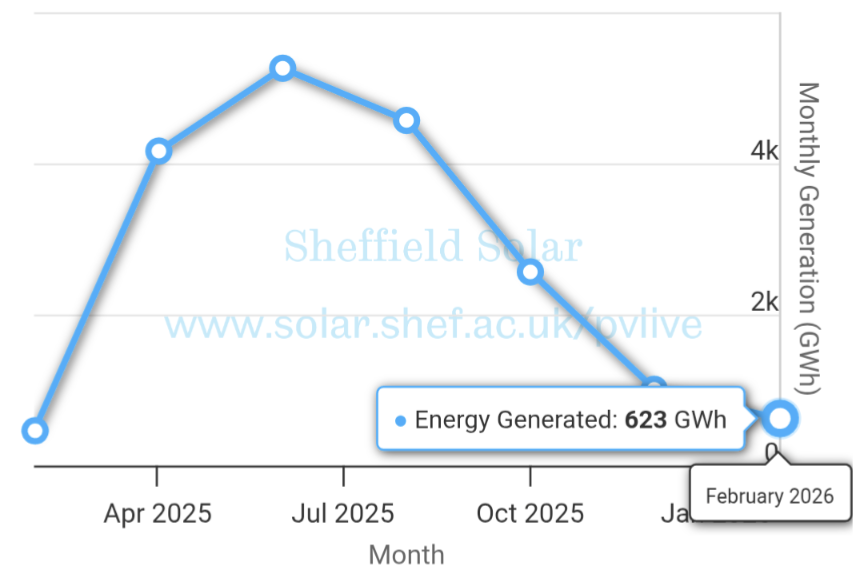
@DaleKirkwood I'm seeing the same monthly chart as robert, it looks messed up. The daily chart looks okay though. The csv numbers are consistently about double what the daily chart shows. So that makes it 641 GW for last February and 143 GW so far for this February (through the 12th). I just added all the February numbers from the csv and divided by 2.
@travis thanks for checking.
I also did some digging last night.
It turns out the Graph we were looking at likely only tracks 'Metered' (Transmission) solar, effectively ignoring millions of UK rooftops. The CSV (Sheffield PV_Live) specifically models that 'Embedded' generation.S
Since the spirit of this market is 'Will the UK generate more solar energy?' (not just 'Did the big farms export more?'), the Graph is actually an incomplete proxy.
To avoid resolving this incorrectly due to missing rooftop data, I will prioritize the Sheffield CSV (Total Generation) as the primary source of truth. This captures the actual sunshine, not just the grid connection type. I hope you agree this is the fairer way to judge the outcome.