Data in no smoothing column at
https://data.giss.nasa.gov/gistemp/tabledata_v4/GLB.Ts+dSST.csv
or
https://data.giss.nasa.gov/gistemp/tabledata_v4/GLB.Ts+dSST.txt
(or such updated location for this Gistemp v4 LOTI data)
Resolution
If the anomaly versus 1951 to 1980 base period per gistemp LOTI is reported as 1.50C or higher this claim resolves at 100%
If the anomaly versus 1951 to 1980 base period per gistemp LOTI is reported as 1.00C or lower this claim resolves at 0%
If 1.01C claims resolves at 2%
If 1.02C claims resolves at 4% and so on.
 1,000
1,000🏅 Top traders
| # | Trader | Total profit |
|---|---|---|
| 1 | Ṁ7 | |
| 2 | Ṁ2 | |
| 3 | Ṁ2 | |
| 4 | Ṁ0 | |
| 5 | Ṁ0 |
People are also trading
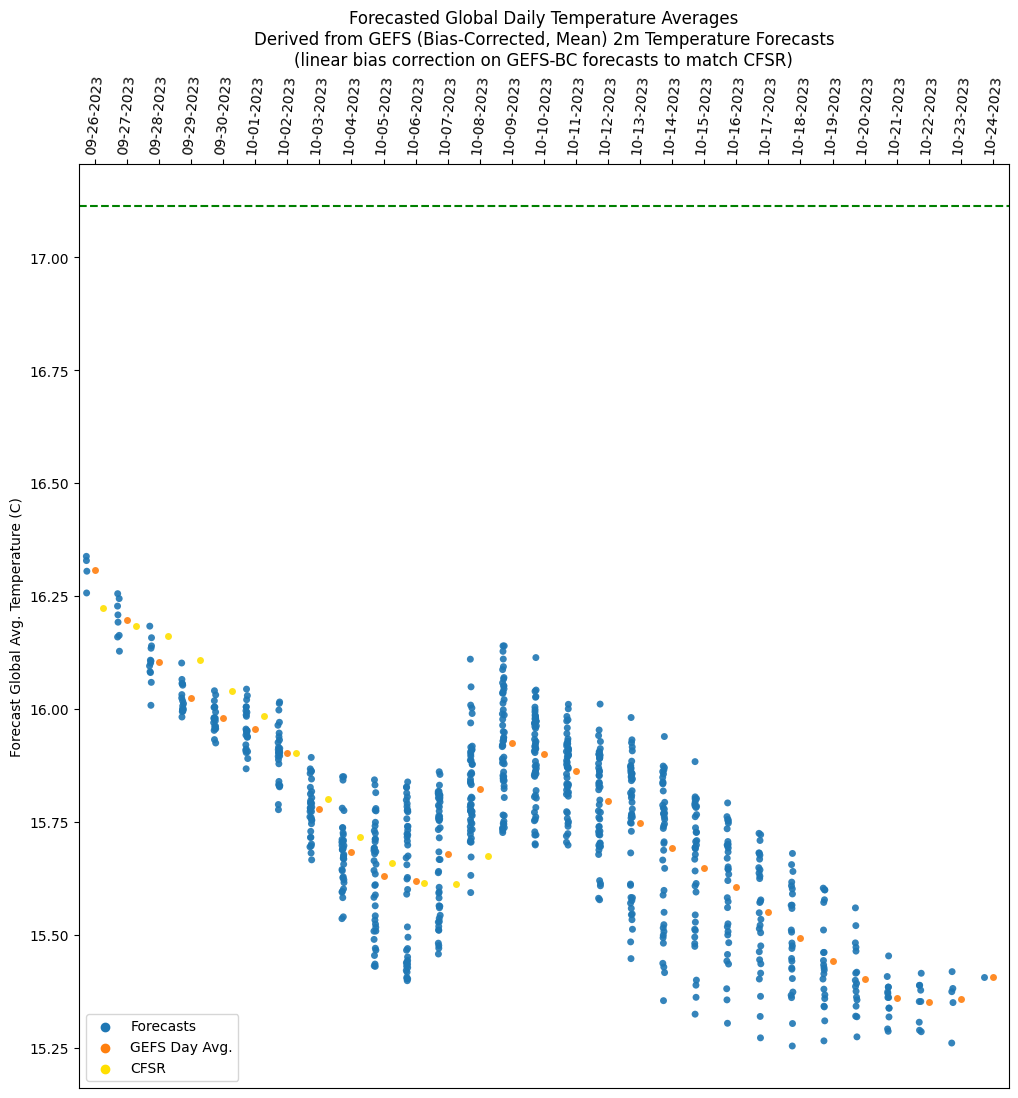
I've made some improvements (fixes) in my GEFS->CFSR to finally now predict (roughly the correct) temperature (before it was off by a factor of 2 (predicting 8C instead of 16C) -- in short I wasn't weighting the temperatures by area (for instance, the temperatures near the poles correspond to grid cells in an area where the area of the grid cells are 1/4 the area of the ones at the equator; as I was treating them with equal area this resulted in much cooler temperatures); I am using now the WGS 84 ellipsoid projection from pyproj).
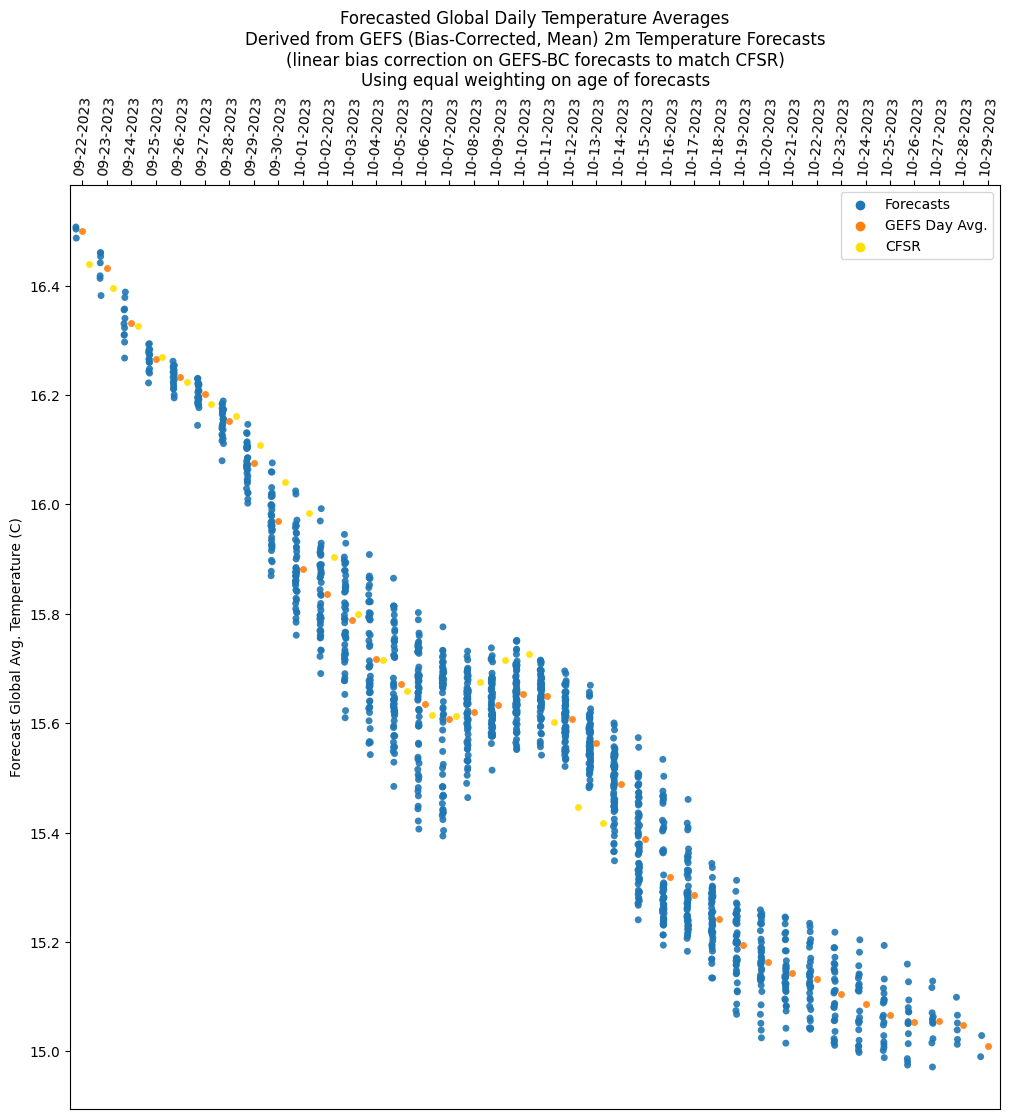
I am still just using the average at each valid date across all the forecasts (orange dots), but maybe I'll experiment with weighting older forecasts less to compute a value to see if I can reduce the RMSE).
The RMSE for the average (orange dot) of the temps is 0.037 C (this is half the RMSE I had before the weighted area fix, so I am happy with it!
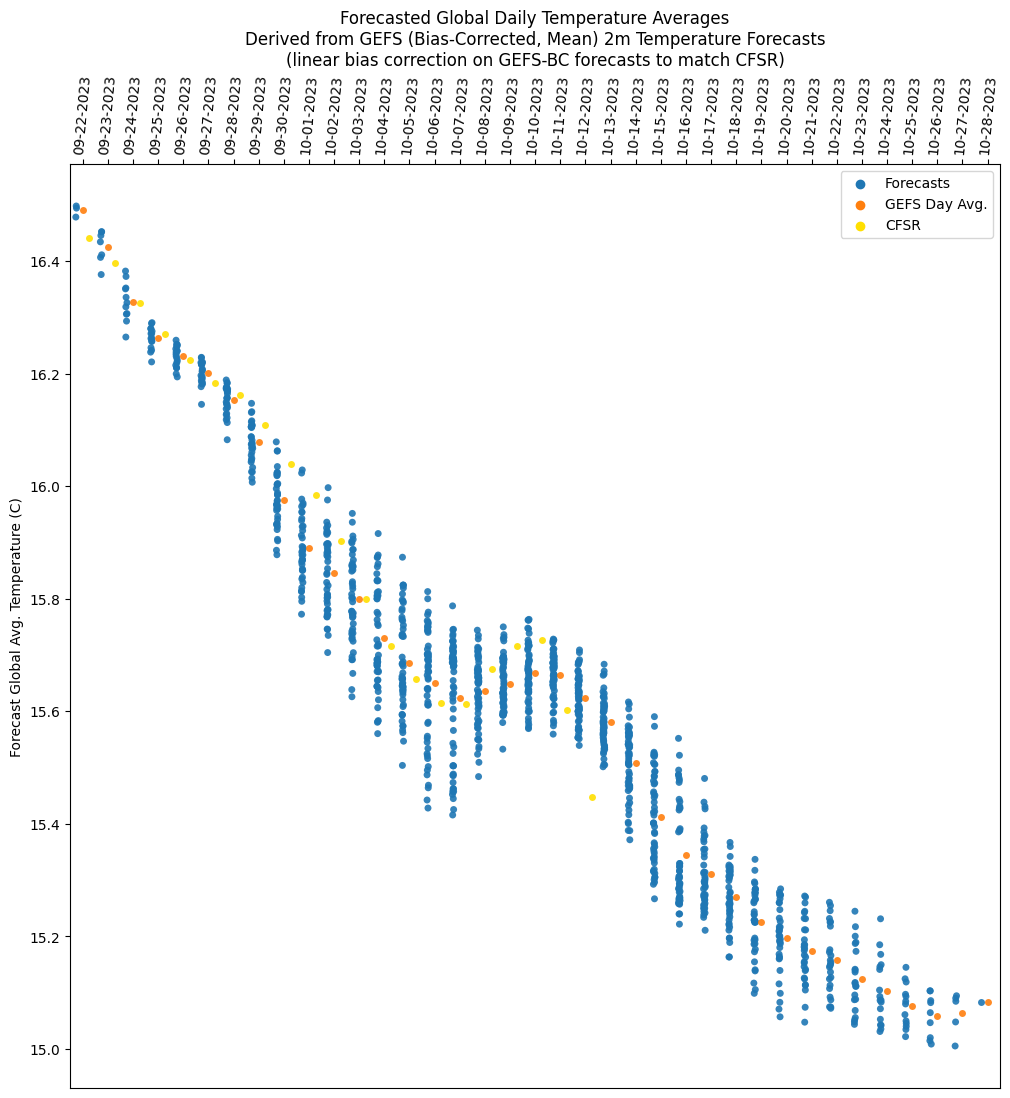
Unfortunately it still doesn't match up perfectly with CFSR so it still requires further bias adjustment: (this is without any adjustment):

And this is with the adjustment (a pretty good fit!)

I am also extending this forecast even further using slightly different (more sketchy) methods using prophet and some adjustments to finish off the month. With that I get the following values for the anomaly
2000 year cutoff (in otherwords, including years in gistemp starting from 2000):
GIS TEMP anomaly projection (October 2023) (assuming 0 error): 1.3882005 year cutoff:
GIS TEMP anomaly projection (October 2023) (assuming 0 error): 1.428Taking the average of the two: I get 1.408 C anomaly for October.
Deferring by 30% now since I am more confident in this analysis but only as much as I am estimating for 20 days of data and the uncertainty in the error of conversion/transformation from absolute gistemp to anomaly gistemp temps.
Edit: Updated notebook here: https://github.com/JRPdata/hot-july/blob/main/gefs/gefs_global_2m_temp_mean_bias_corrected-Oct.ipynb
(it's useless to run it without the GB of gistemp data that I've been downloading, and the other project: monthly-land-ocean-temp)
Yesterday was a big enough drop in CFSR temps that it fell outside the range of the GEFS->CFSR predictions I do (the first time it happened in the last 3 weeks):
The last few days have ruined the accuracy ... (RMSE up to 0.064 C for daily averages)
I tried various ways of weighting older forecasts (as each day has data from forecasts from 1 to 15 days ago) such as exponential/linear/gaussian weighting and none of them improved on the MSE of equal weighting which I was doing already (with only one test (of this month's data so far) I can only speculate this may have to do with the way I transform the GEFS to CFSR temps is not correct in combination with the different weighting schemes, or that the error in the transform is greater than any improvements in the weighting scheme so the equal weighting compensates for that error the best).
Using the above forecast temps (+adjusted prophet extension) I get between 1.341 C and 1.381 C for October's anomaly (2000, 2005 cutoff). If the CFSR stays below the forecast trends in the future than these will be overestimates of the anomaly.
Edit: Oct. 31 (18Z):
RMSE: 0.069
GEFS->CFSR temp prediction errors by lead time:

========================
GEFS->CFSR temp predictions -> GISTEMP anomaly temps:
2000 cutoff (Only using historical years >= 2000):
GIS TEMP anomaly projection (October 2023) (assuming 0 error): 1.2762005 cutoff:
GIS TEMP anomaly projection (October 2023) (assuming 0 error): 1.316For this question, (sum of the two predictors - 2) * 100 = 59.2%
@parhizj October is CFSR done, so I am uing the 2005 cutoff since it has been the closest recently. No further bets. 62.4% is my expected resolution probability (312 * 2 / 10)
GIS TEMP anomaly projection (October 2023) (assuming 0 error): 1.312October via here is out (market links not yet): https://data.giss.nasa.gov/gistemp/graphs_v4/graph_data/Monthly_Mean_Global_Surface_Temperature/graph.txt
1.34 C
Was off by 0.03 C
@parhizj no different organisations estimating same thing. In Sept NASA giss 1.47 but NOAA 1.44
may use many of the same weather stations data.
I've been trying to extrapolate temps from GEFS using different manual adjustments from my usual method and I still get really high temps for the end of the month (~14.41 C). If anyone has any predictions for the end of the month they can vote without spending any mana in some rougher ranges:
https://manifold.markets/parhizj/cfsr-world-2m-temp-deg-c-oct-31-202?r=cGFyaGl6ag
@parhizj Why so large ranges? I would put 14.4-14.6 as more likely than 14.2-14.4 then 14-14.2 and 14.6-14.8 as fairly unlikely 3rd and 4th places
@ChristopherRandles Ok, I spent sometime and made a more detailed one:
https://manifold.markets/parhizj/cfsr-world-2m-temp-deg-c-oct-31-202-26c63fa2b0a8
@ChristopherRandles It is interesting you agree with 14.4-14.6 more likely, as with my current forecast for the rest of the month I get an anomaly of 1.450 for October (it seems too high on the face of it) but I don't know how well the forecast will turn out until at least a couple more days.
@parhizj The highest on record is 2018 at 14.49. So that would seem quite low given current anomaly and El Nino. So I don't quite see why you think it is "too high".
@ChristopherRandles As a single absolute temperature no, but in as it pushes the anomaly up to 1.450, yes.
@parhizj CFSv2 anomaly for 31 Oct 2018 is 0.68 and record Oct anomaly for gisstemp is 1.09. At beginning of Oct 15.98 vs highest of 15.62 so .36 warmer than record warmest before. So should expect 1.09 plus circa half of .36 if temps decline from .36 above record to 0 above record. So that is about 1.27C anomaly in Gistemp terms and yes 1.45C does sound a bit too high.
So it is anomaly over month that seems too high rather than the ending temperature?
Wondering if that can be explained by various years having a spell as warmest but also spell well below highest?
I understand how YES shares would work.. but would the same percent apply to NO shares? For instance if this was for July 2023 which was 1.19, for 100 YES shares it would pay out 38 mana, but what about 100 NO shares?
Also why not use a numeric type question?
@parhizj It is not 38 mana but 38%.
If it is currently at 50% indicating 1.25C and you think it will be cooler you would buy a no position.
I have edited "pays" to 'resolves at' in the description.
@parhizj numeric used to be an option, but not any more as far as I can see.
Multichoice with 50 options (at 25 mana each) would be too expensive.
I would have preferred to do 4% for each 0.01C above 1.10C but I am not sure 1.3C is high enough and doing above 1.20C might not go low enough.
@ChristopherRandles Yes I understand but it would be 38 mana in the example for YES shares. I'm confused by these resolves to % questions. So then for 100 NO shares would you get 38% of that, or the compliment (62%)?
@parhizj The complement 62%. So if you buy 50 mana worth of no at 50% and gistemp for October turns out to be 1.19 then the resolution is 38% to yes and 62% to no. You would get back 62 mana i.e. making 12 mana on your 50 mana or a 24% return.
@ChristopherRandles It seems one way of thinking about this market is betting YES/NO whether it will be greater than (YES) or less than (NO) 1.25 C.
@ChristopherRandles I tried to do a very speculative analysis using my estimates from GEFS converting to CFSR (which are always sketchy and off by large enough amounts) and then extending further out by using temps from 2016 (I also used the CFSR mean for 1979-2000) and adjusting them upwards with a simple offset (with two different pairs of offsets for lower and upper bounds: for 2016: +0.0 and +0.9 (this value puts Oct 17's value close to Oct 16 (end of GEFS forecast)), and for the 1979-2000 mean +0.62 to +1.52 (using the same spread), I get the following ranges for October:
2005 year cutoff: [1.268 to 1.703 C] (GEFS forecasts Oct. 1-16; Oct 17+ using adj. 2016)
2000 year cutoff: [1.227 to 1.663 C] (GEFS forecasts Oct. 1-16; Oct 17+ using adj. 2016)
2005 year cutoff: [1.341 to 1.766 C] (GEFS forecasts Oct. 1-16; Oct 17+ using adj. 1979-2000 mean)
2000 year cutoff: [1.300 to 1.726 C] (GEFS forecasts Oct. 1-16; Oct 17+ using adj. 1979-2000 mean)
The high end of the range assumes the forecast GEFS adjusted temps are accurate (especially at Oct. 16 since I'm using that to place the upper bounds for an offset) AND that Oct. 17-31 trends for 2016/the mean are an accurate analog for Sept. 2023 AND that Oct 2023 will be warmer than 2016/the mean (as I've only assumed a 0 or higher offset for Oct 17+)..
Many assumptions leads to a huge range of 1.227 to 1.766 C (a middle value of 1.5C). I might have done some other predictions that were better using seasonality w/ Prophet to extend the GEFS forecast or use 2015 instead of 2016 (as that was the record for October), but I am guessing the error is already so large I don't see the point (at least +-0.2C) . For reference, the GISTEMP record for October 2015 was 1.090 C.
I have very low confidence in this speculative analysis, but using the middle value it looks like the anomaly in October 2023 might be higher than September's 2023 anomaly, mainly because the trends for GEFS look like a pause in global temperature drops and even a slight rise the second week of October. I would have guessed the opposite of this if not for this analysis. The reversal of the trend for October 6-15 does look quite odd:

I discovered I was not doing the best job removing the bias from this type of fit I was doing for the GEFS data (there was still some bias left), and after removing the remaining bias the error decreased quite a bit. If I use the largest window I have (this has more spread since there are older forecasts), I get a RMSE of 0.073 deg C

And if I just use only forecasts that cover the last week of CFSR temps in order to come up with a fit, the RMSE drops to 0.024 deg C (might not have the correct spread of variability long term, but looks more accurate in temperatures in near future)

Increasingly looks like the rise in temperature will be very modest, to the point where I had to manually adjust my forecast temperatures down 0.2C to get a reasonable chart for the rest of October, as the error for yesterday is quite large (I can only increase the window to get a more reasonable forecast now). (this is without the -0.2 adjustment, but I expect the rest of October's forecast to be about -0.2 below the average (orange dots))