Data is currently at
https://data.giss.nasa.gov/gistemp/tabledata_v4/GLB.Ts+dSST.csv
or
https://data.giss.nasa.gov/gistemp/tabledata_v4/GLB.Ts+dSST.txt
(or such updated location for this Gistemp v4 LOTI data)
January 2024 might show as 124 in hundredths of a degree C, this is +1.24C above the 1951-1980 base period. If it shows as 1.22 then it is in degrees i.e. 1.22C. Same logic/interpretation as this will be applied.
If the version or base period changes then I will consult with traders over what is best way for any such change to have least effect on betting positions or consider N/A if it is unclear what the sensible least effect resolution should be.
Numbers expected to be displayed to hundredth of a degree. The extra digit used here is to ensure understanding that +1.20C resolves to an exceed 1.195C option.
Resolves per first update seen by me or posted as long, as there is no reason to think data shown is significantly in error. If there is reason to think there may be an error then resolution will be delayed at least 24 hours. Minor later update should not cause a need to re-resolve.
June 2026 market
 1,000
1,000🏅 Top traders
| # | Trader | Total profit |
|---|---|---|
| 1 | Ṁ1,142 | |
| 2 | Ṁ752 | |
| 3 | Ṁ409 | |
| 4 | Ṁ116 | |
| 5 | Ṁ88 |
People are also trading
@ChristopherRandles 1.12 official, can resolve now.
ghcnm.tavg.v4.0.1.20260608.qcf.dat 2026-06-09 02:19 165M
They used the ghcnm from Monday night (a day later than expected) meaning they did the run yesterday.
ERSST came in earlier in the afternoon but there has been no GHCNm since May 30 !
~
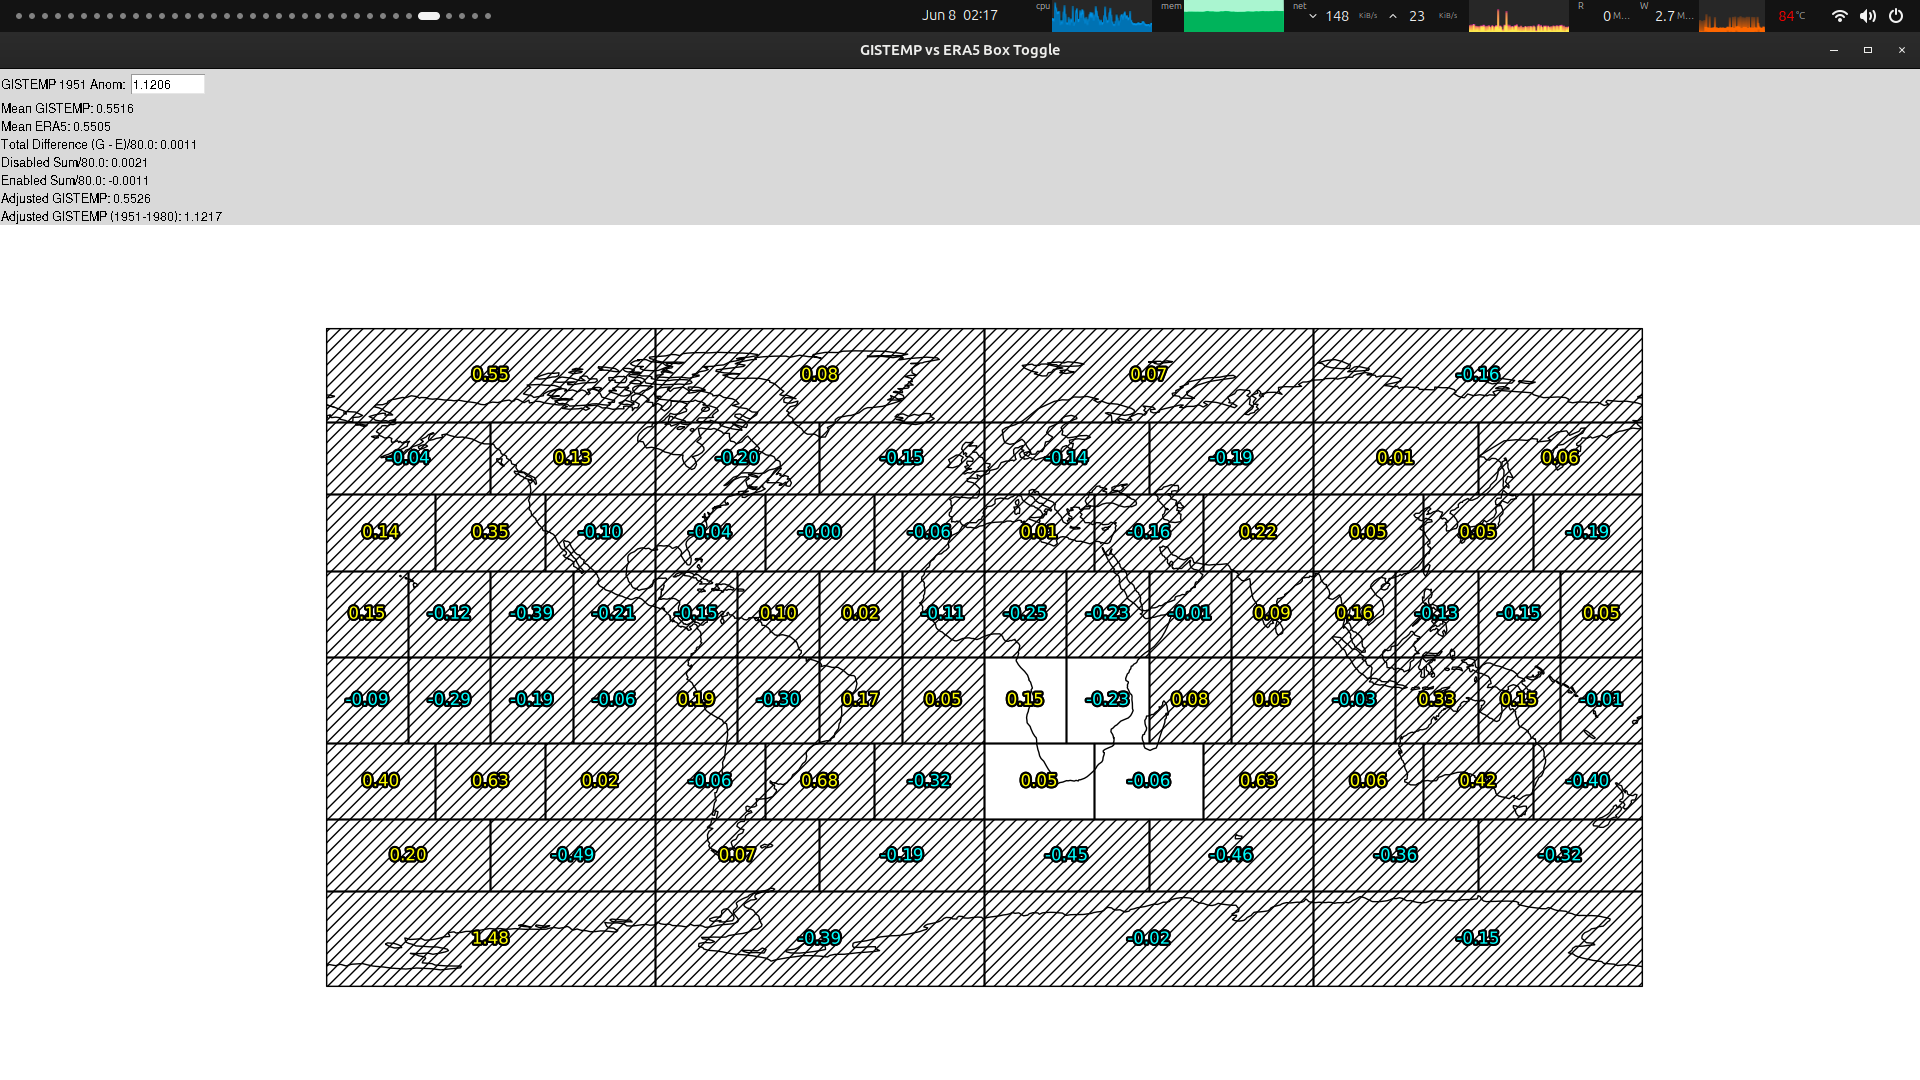
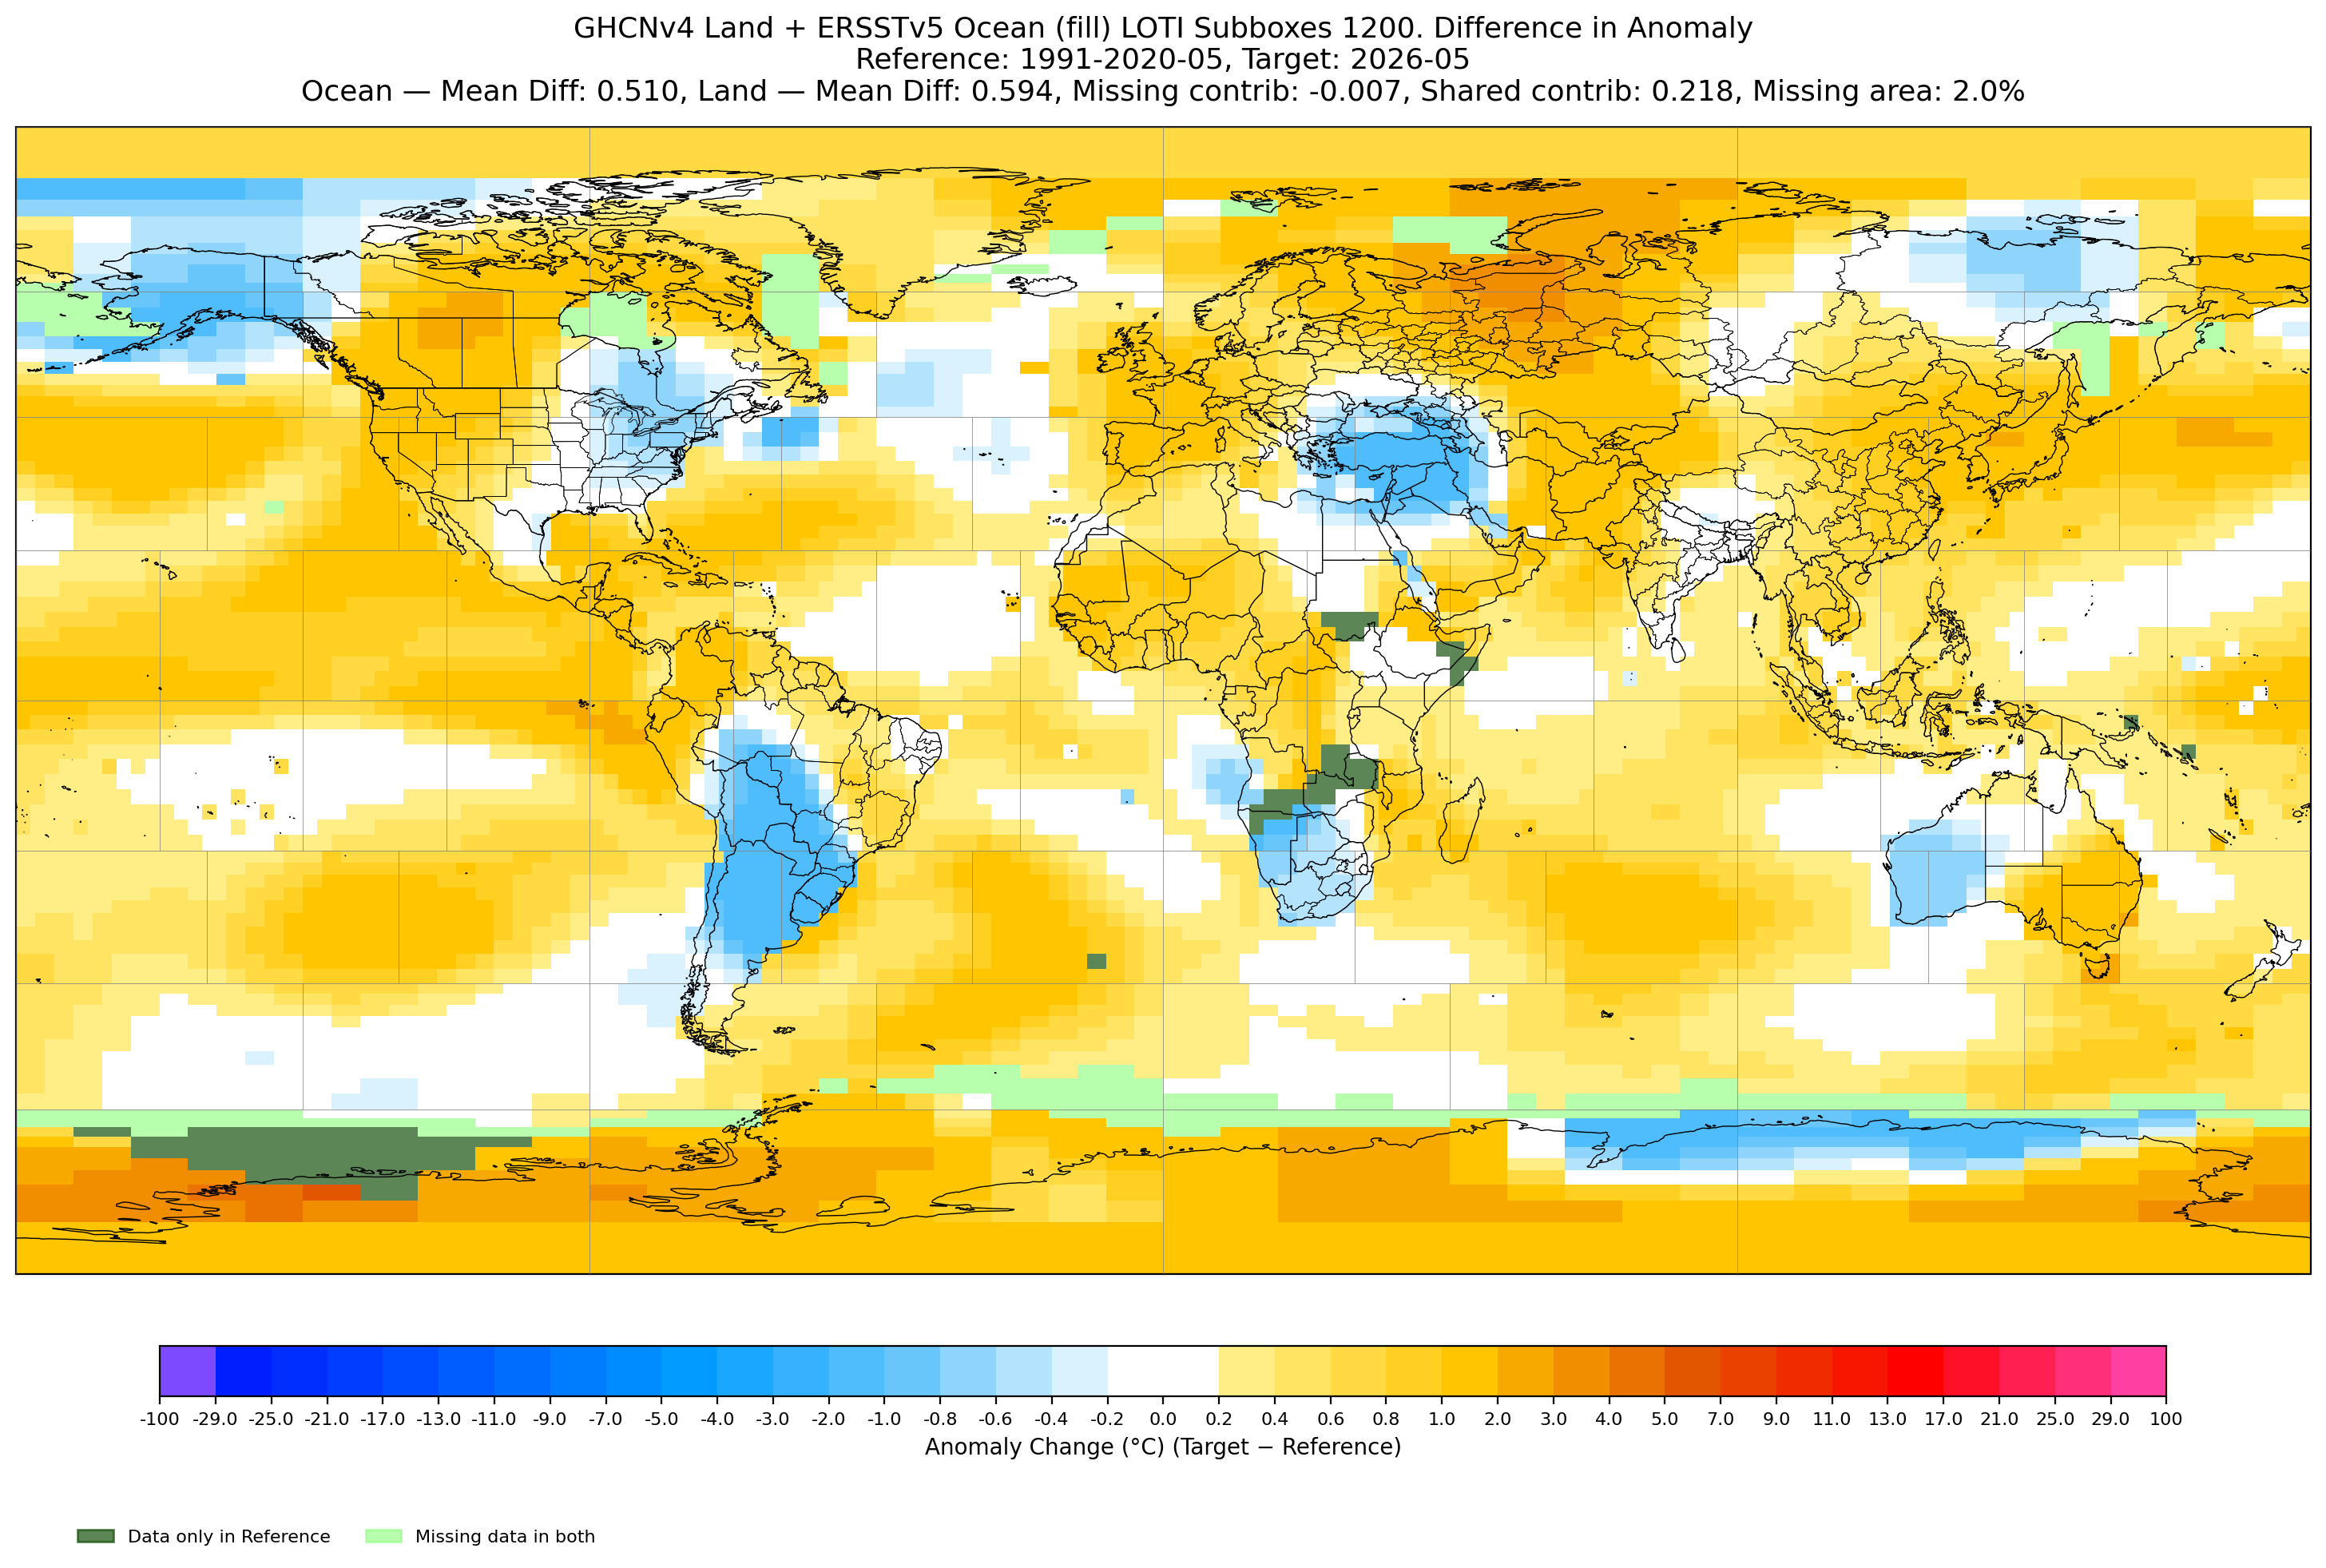
Vibe-coded a ERSST-ERA5-loti predictor today (using the predicted ERA5 adjusted from the super ensemble + and last 3 days of super ensemble for the ERA5 portion of subboxes) with Gemini's help (taking care to mask subboxes when necessary for ERSST,ERA5,GISTEMP data)...
The new method (dubbed ERSST-ERA5-loti) weighted together using the 3 ERA5->GISTEMP predictors yields 1.0918 C (weighting heavily (by inverse MSE) the ERSST predictor to the other aggregate of the other 3 methods (also weighted by inverse MSE, which would yield 1.1132 C by themselves) by nearly 3 to 1). Notably, the delta analog method is far higher than the rest at 1.13 but this new method has its prediction at 1.08 C!
The ERSST-ERA5-loti predictor uses several features in a Bayesian Ridge model for each month: the global, land and ocean anomalies from ERA5 in a 1991-2020 baseline (masking the appropriate subboxes by using the last best guess from the previous year of which subboxes to mask), and similarly calculates the ERSST ocean anomaly (also masking subboxes), a simple time trend feature, and additionally uses (somewhat dated) gistemp land/ocean/global subbox data from the original 1951-2020 baseline (from last October) as the train; a final correction is done using ARIMA on the residuals with LOTI data from the last month to provide a correction for the last year (which has had high positive residuals) and to estimate the std dev.
~
ERSST-ERA5-loti Prediction: 1.0918
Std dev: 0.0470
Point estimate (old, delta method, analog method, ERSST-ERA5-loti method) adjusted by prediction error mean: 1.1149, 1.1318 1.1049 1.0840
Point estimate (mix) adjusted by prediction error mean: 1.0918
Probs (mix) with super ens var
Std. dev.: 0.0470
Bin Probability (%)
<1.095 52.7
1.095-1.145 34.4
1.145-1.195 11.5
1.195-1.245 1.4
1.245-1.295 0.1
>1.295 0.0
The delta analog value and the ERSST-ERA5-loti predictor will continue to shift for the next 3 days until all the ERA5 data comes in.
ERA5 (last 3 days from super ensemble)
~
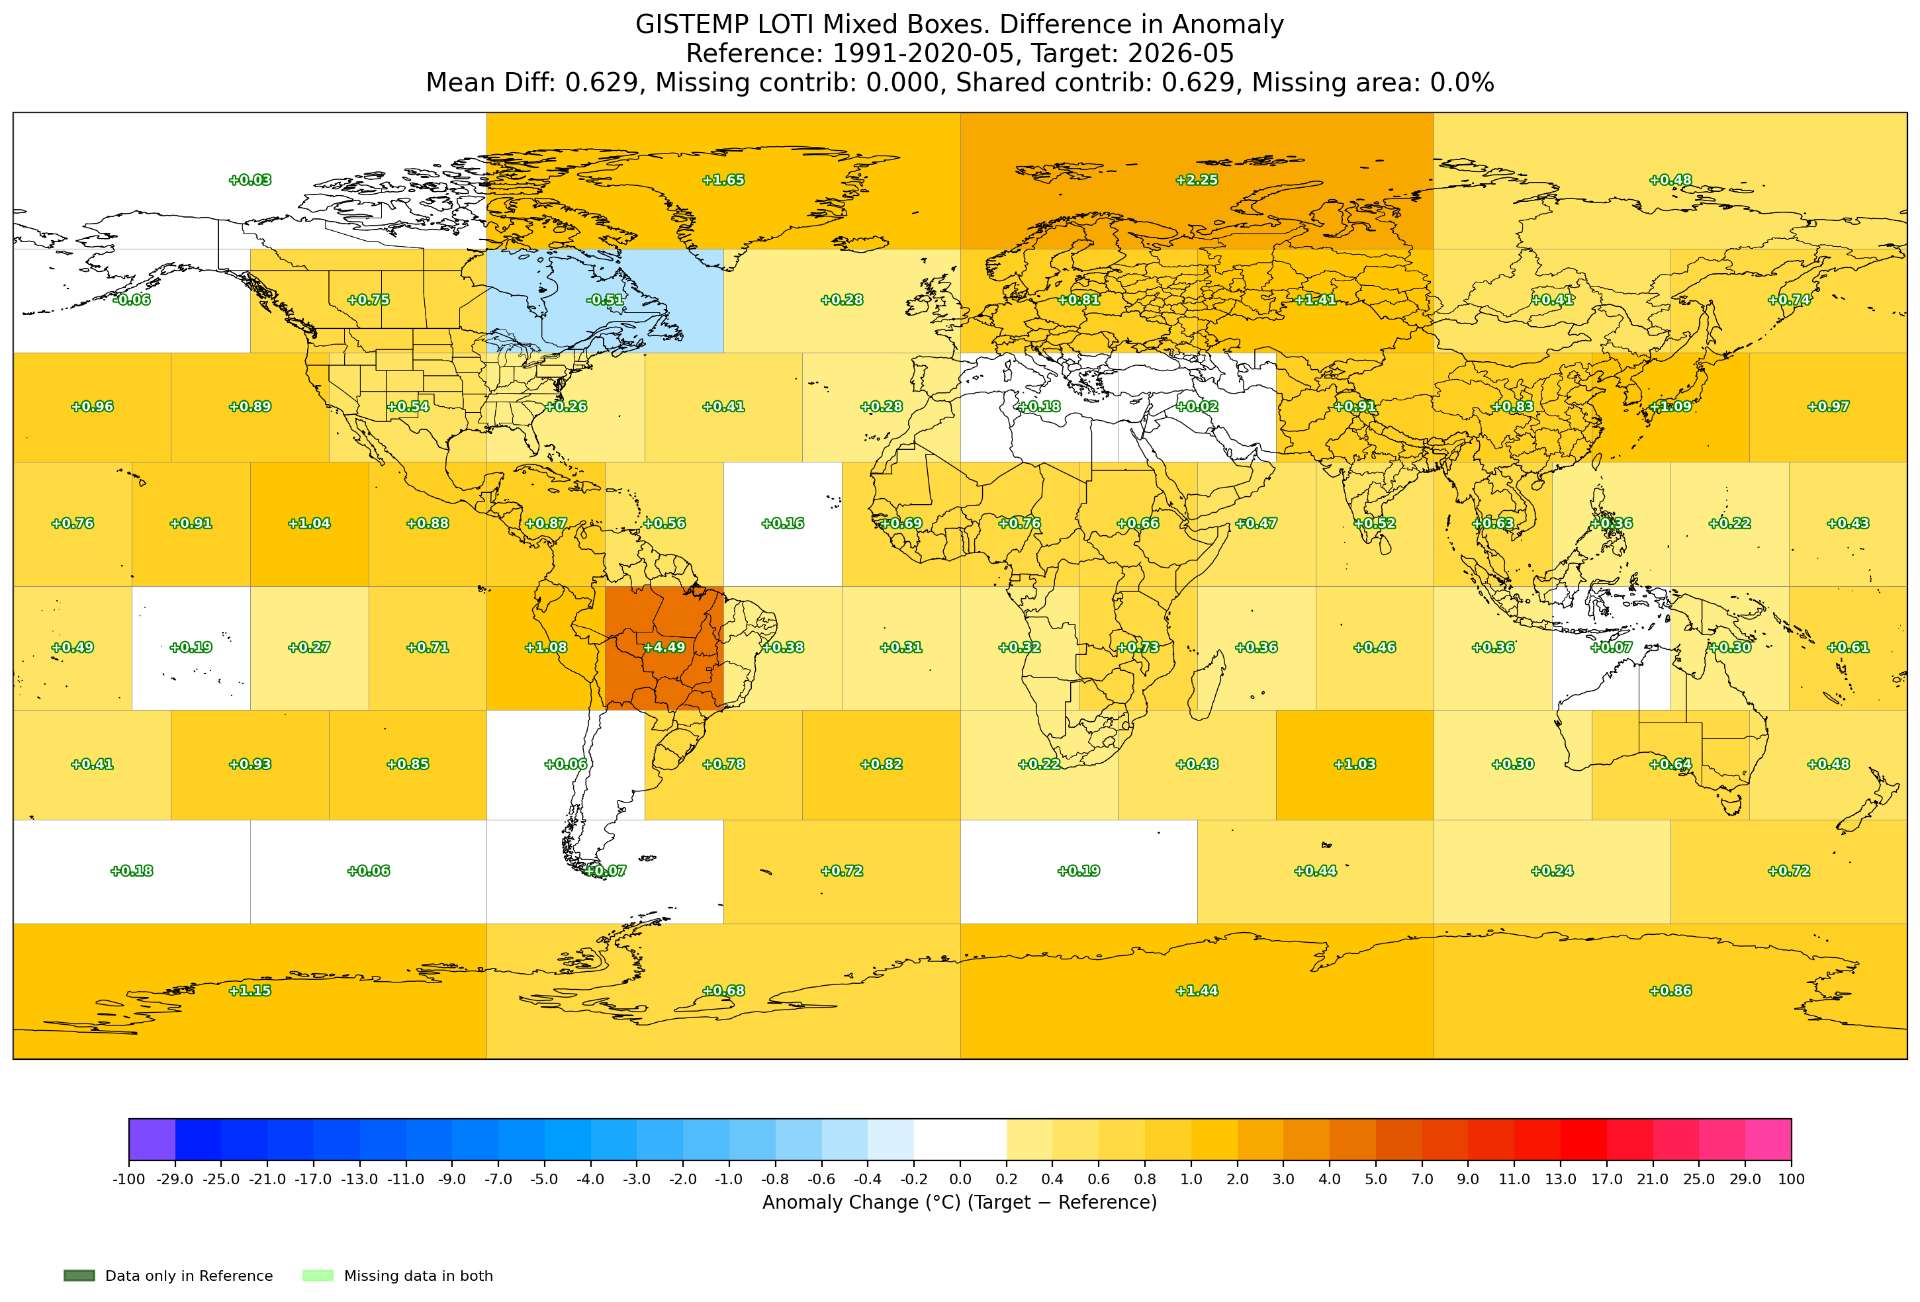
Some of the intermediate product data from the pipeline of the new predictor (the ocean anomaly is cooler than last month after masking) (columns are not great labeled -- first 3 columns after the date are the older gistemp run (1951-1980), and the anomaly_* columns are from the ERA5 subboxes masked (1991-2020)
mixed_anom_global mixed_anom_land mixed_anom_ocean anomaly_global anomaly_land anomaly_ocean num_masked_subboxes ersst_ocean_anom_1991_2020
valid_date
2023-12-01 1.377519 2.043990 0.969033 0.849618 1.220008 0.619150 163 0.533718
2024-01-01 1.253380 1.719702 0.972136 0.700568 0.771375 0.657418 130 0.565262
2024-02-01 1.437205 2.234928 0.960542 0.813673 1.098417 0.642008 85 0.558540
2024-03-01 1.384441 2.148096 0.927454 0.731198 1.037960 0.546445 80 0.511427
2024-04-01 1.303471 1.900322 0.944800 0.666791 0.838704 0.562586 109 0.499449
2024-05-01 1.145133 1.524313 0.915568 0.655910 0.779686 0.580254 142 0.460152
2024-06-01 1.207819 1.703052 0.906297 0.668019 0.904912 0.521780 156 0.438015
2024-07-01 1.207098 1.700158 0.905937 0.651600 0.907535 0.492104 160 0.439888
2024-08-01 1.293515 1.960004 0.885098 0.707287 1.056088 0.488799 151 0.363787
2024-09-01 1.243570 1.817291 0.888836 0.726884 1.069012 0.511739 162 0.420883
2024-10-01 1.355217 2.115524 0.885117 0.800141 1.252806 0.515580 163 0.408489
2024-11-01 1.305689 2.029494 0.857784 0.726761 1.130253 0.473320 172 0.402416
2024-12-01 1.272353 2.005487 0.821029 0.752327 1.197735 0.475273 164 0.385637
2025-01-01 1.359179 2.215773 0.839048 0.774653 1.288923 0.461358 131 0.435265
2025-02-01 1.246236 1.947519 0.825068 0.606542 0.878641 0.442555 86 0.425203
2025-03-01 1.351475 2.225937 0.826939 0.653001 1.016076 0.434406 81 0.413631
2025-04-01 1.217876 1.903120 0.803854 0.601577 0.949547 0.390656 109 0.362246
2025-05-01 1.070632 1.502682 0.807548 0.532251 0.698247 0.430789 142 0.354269
2025-06-01 1.046238 1.461059 0.792045 0.467265 0.558011 0.411227 155 0.325548
2025-07-01 1.016958 1.312678 0.834920 0.436208 0.484352 0.406206 160 0.371042
2025-08-01 1.160056 1.681400 0.844275 0.470637 0.578061 0.403280 161 0.359056
2025-09-01 1.248739 1.967811 0.820923 0.651539 1.057294 0.396816 159 0.330069
2025-10-01 NaN NaN NaN 0.680923 1.185889 0.364496 145 0.202053
2025-11-01 NaN NaN NaN 0.643339 1.129358 0.339036 154 0.179403
2025-12-01 NaN NaN NaN 0.475717 0.733124 0.316046 148 0.221281
2026-01-01 NaN NaN NaN 0.490230 0.630107 0.405185 116 0.294682
2026-02-01 NaN NaN NaN 0.519300 0.675555 0.425098 85 0.413599
2026-03-01 NaN NaN NaN 0.537497 0.749775 0.409650 80 0.458403
2026-04-01 NaN NaN NaN 0.521255 0.530265 0.515803 202 0.455820
2026-05-01 NaN NaN NaN 0.546661 0.530906 0.556270 129 0.428528
ghcnm.v4.0.1.20260603:
109.153
Ooof. Looks like I will lose mana this time.

Looks very unlikely it won't go up significantly from here:
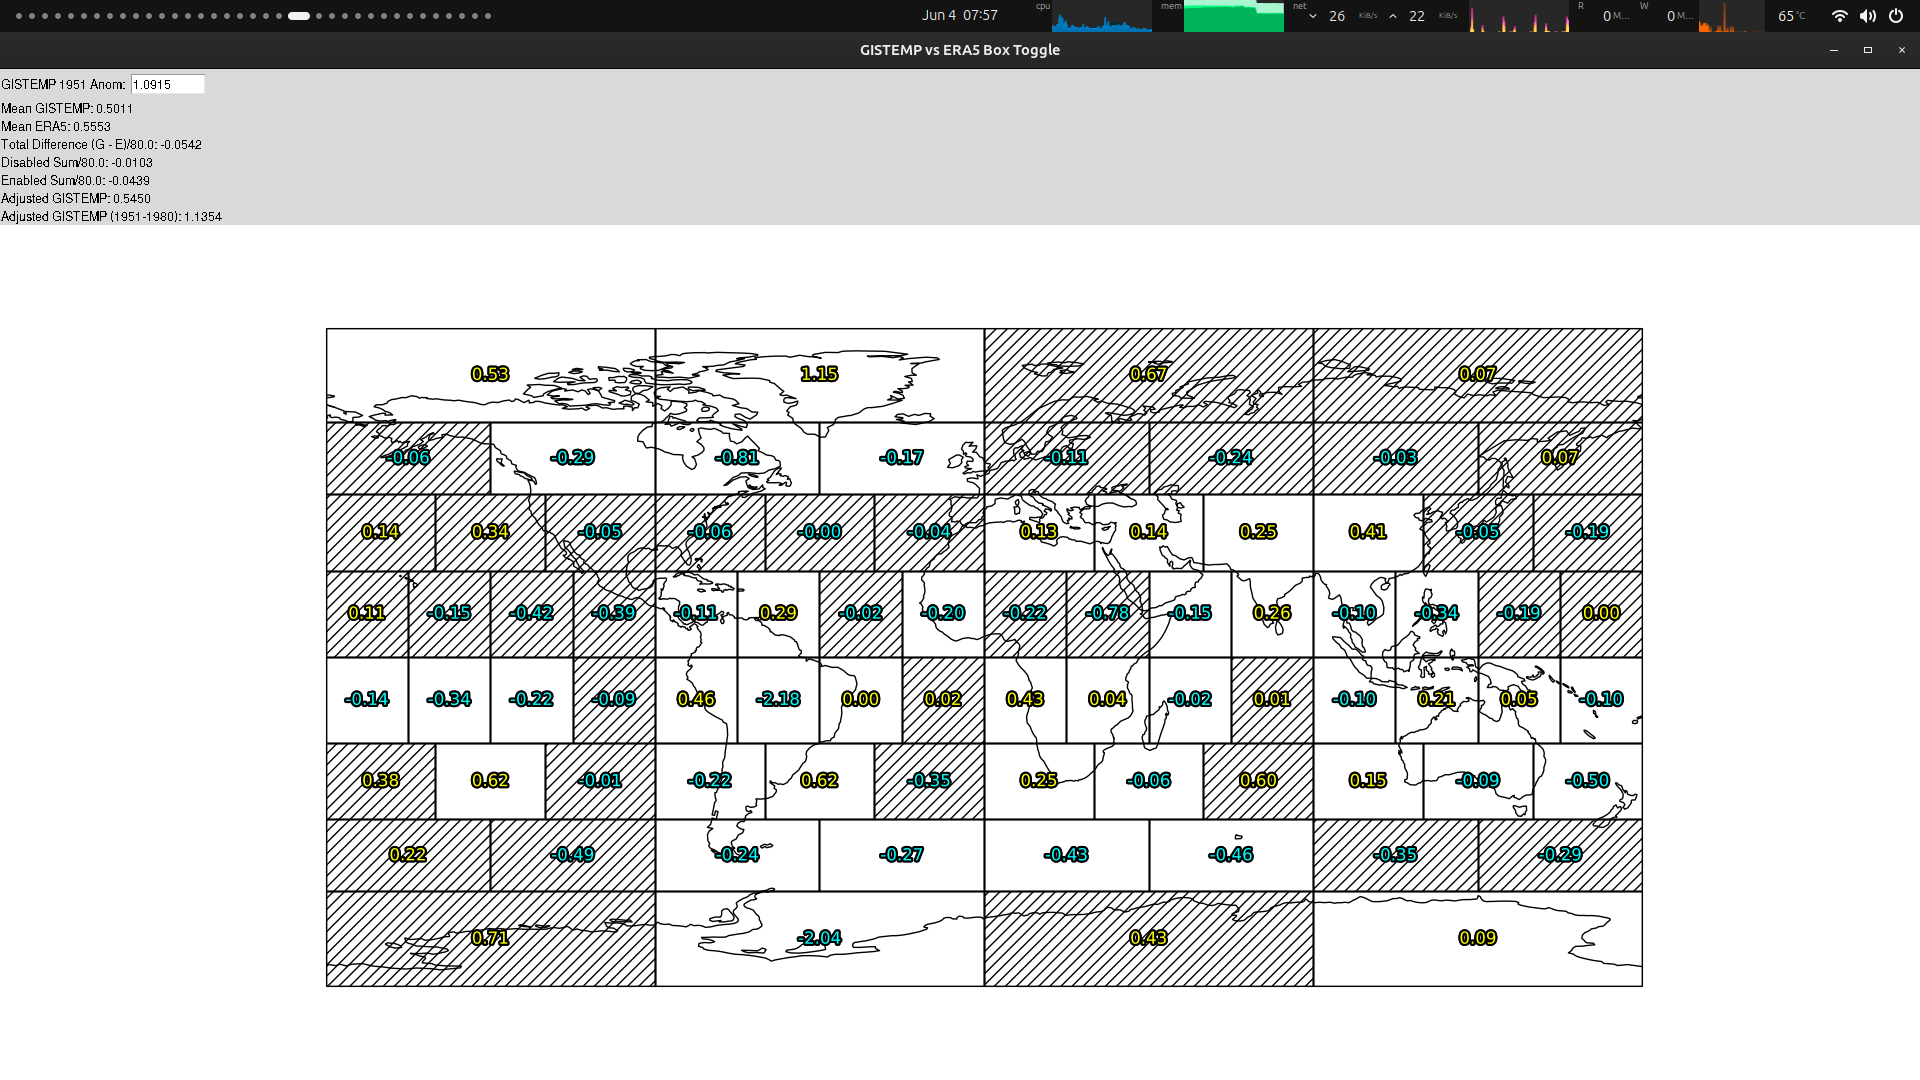
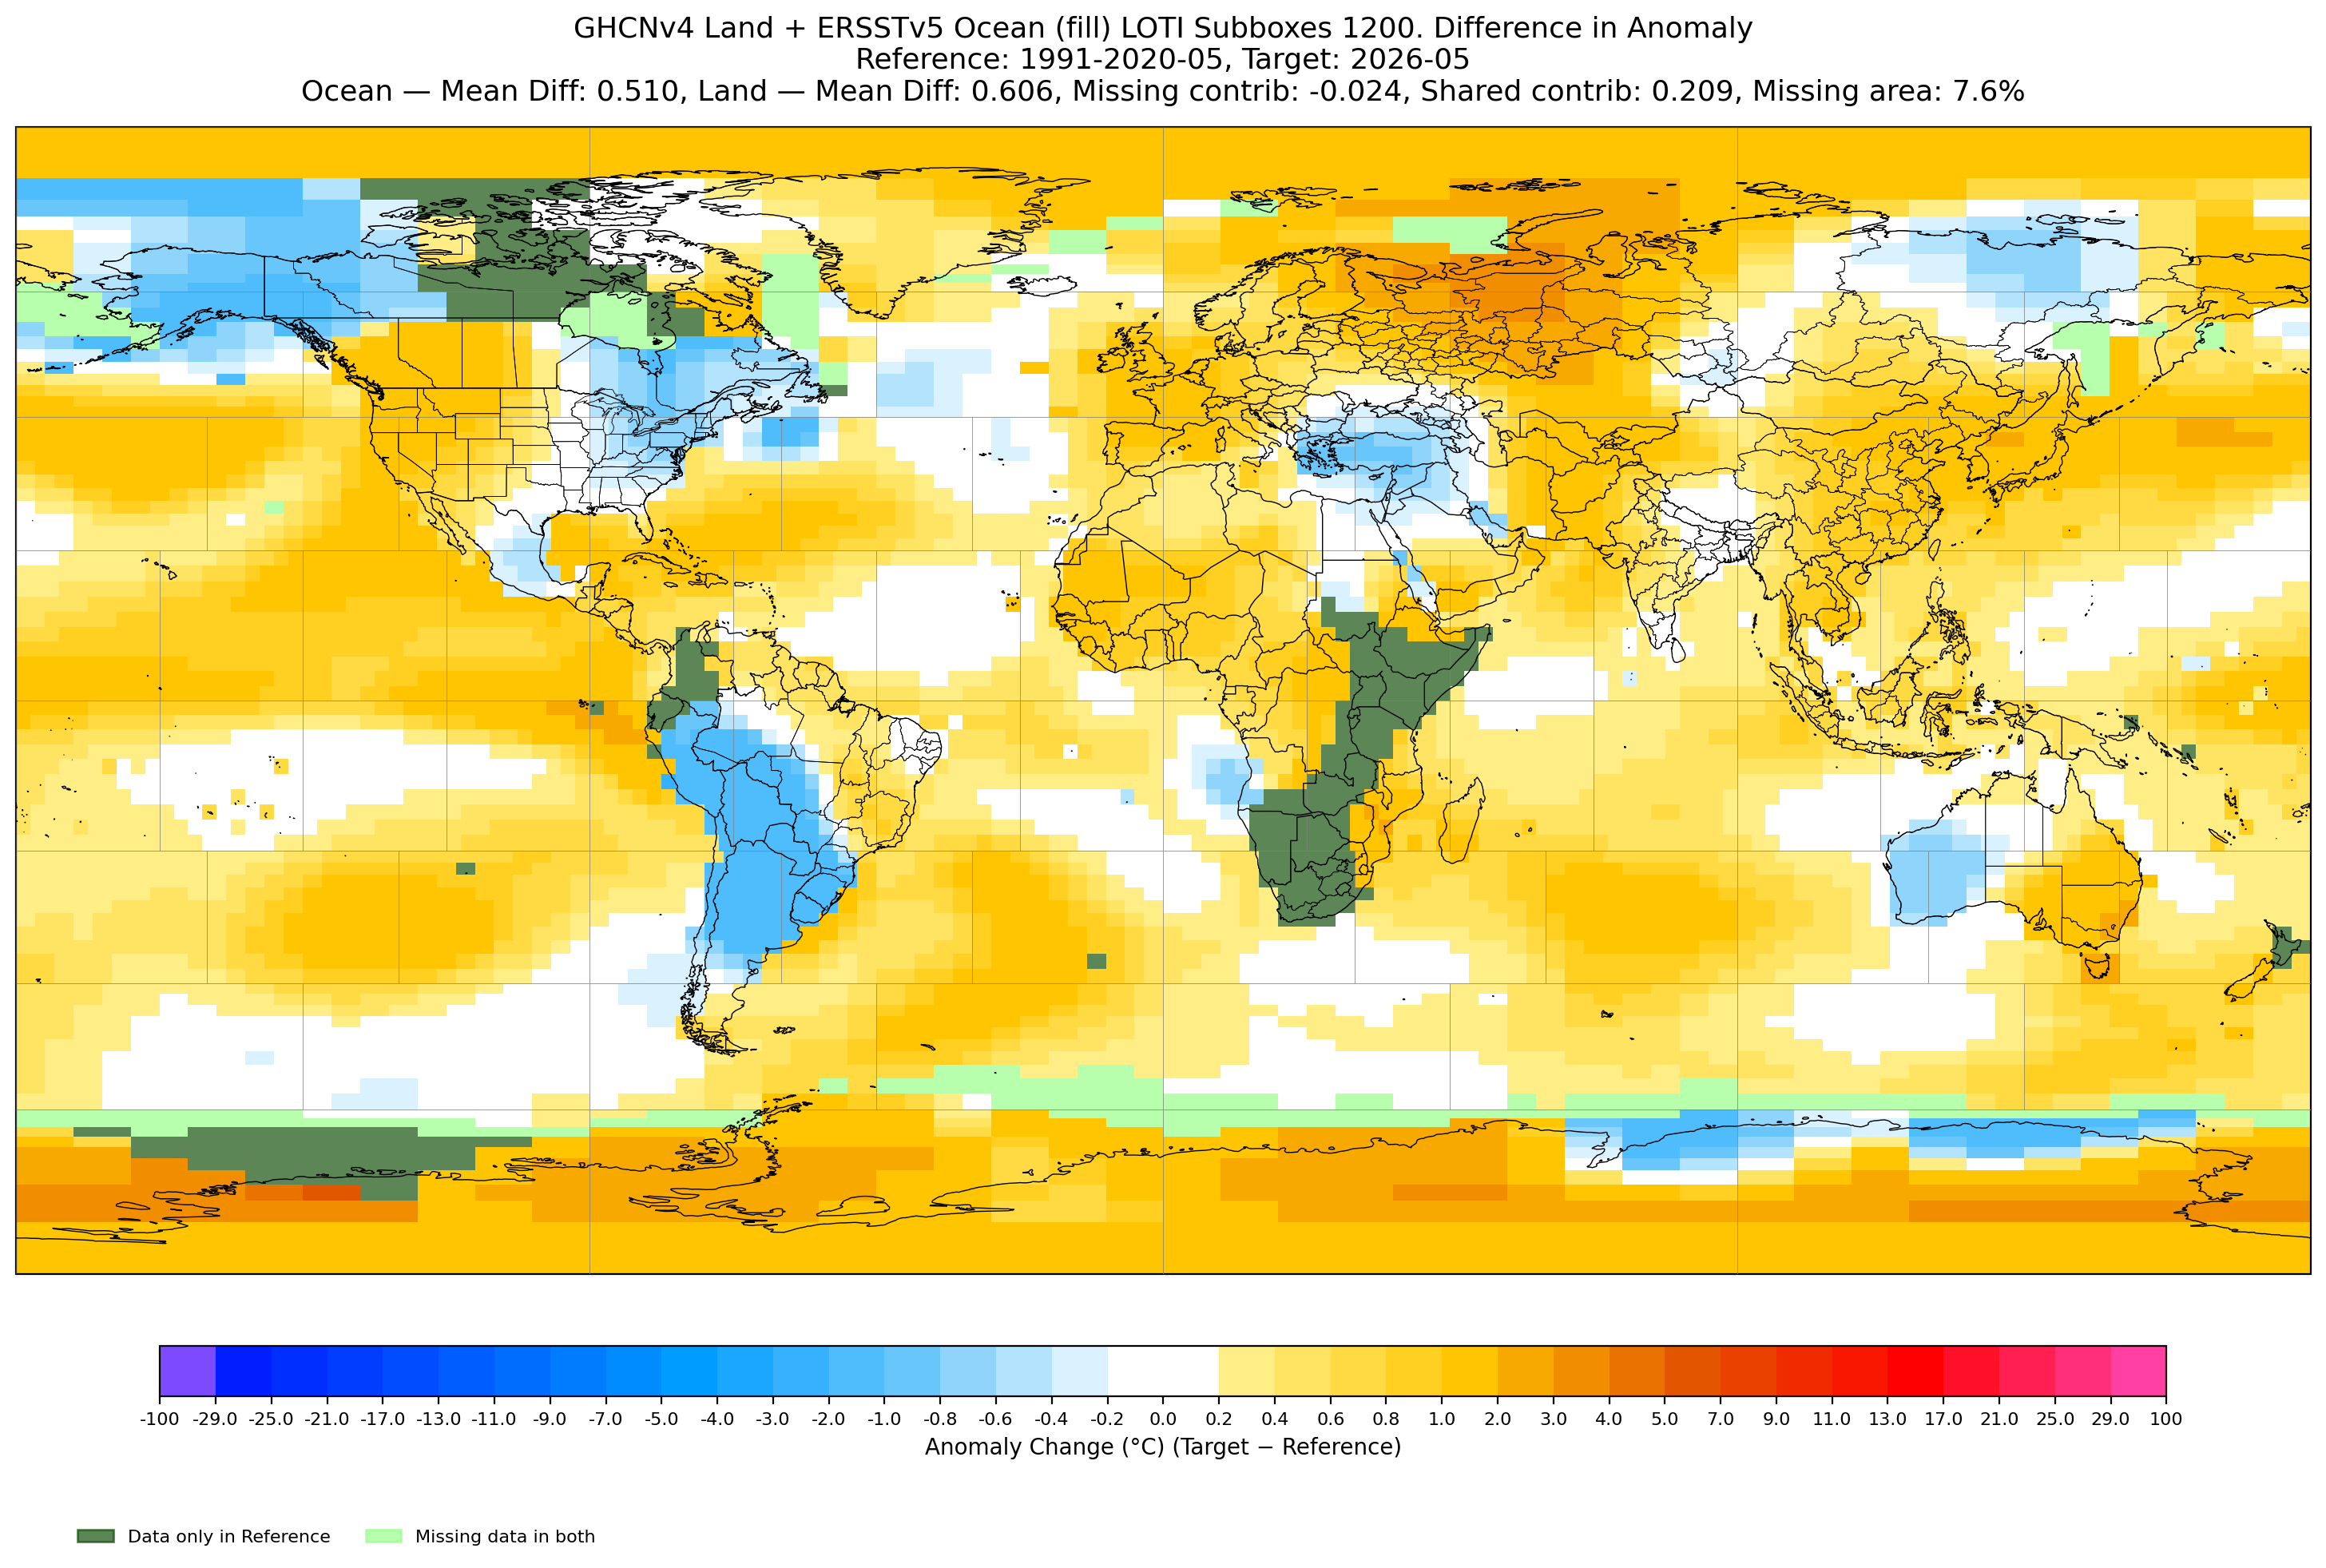
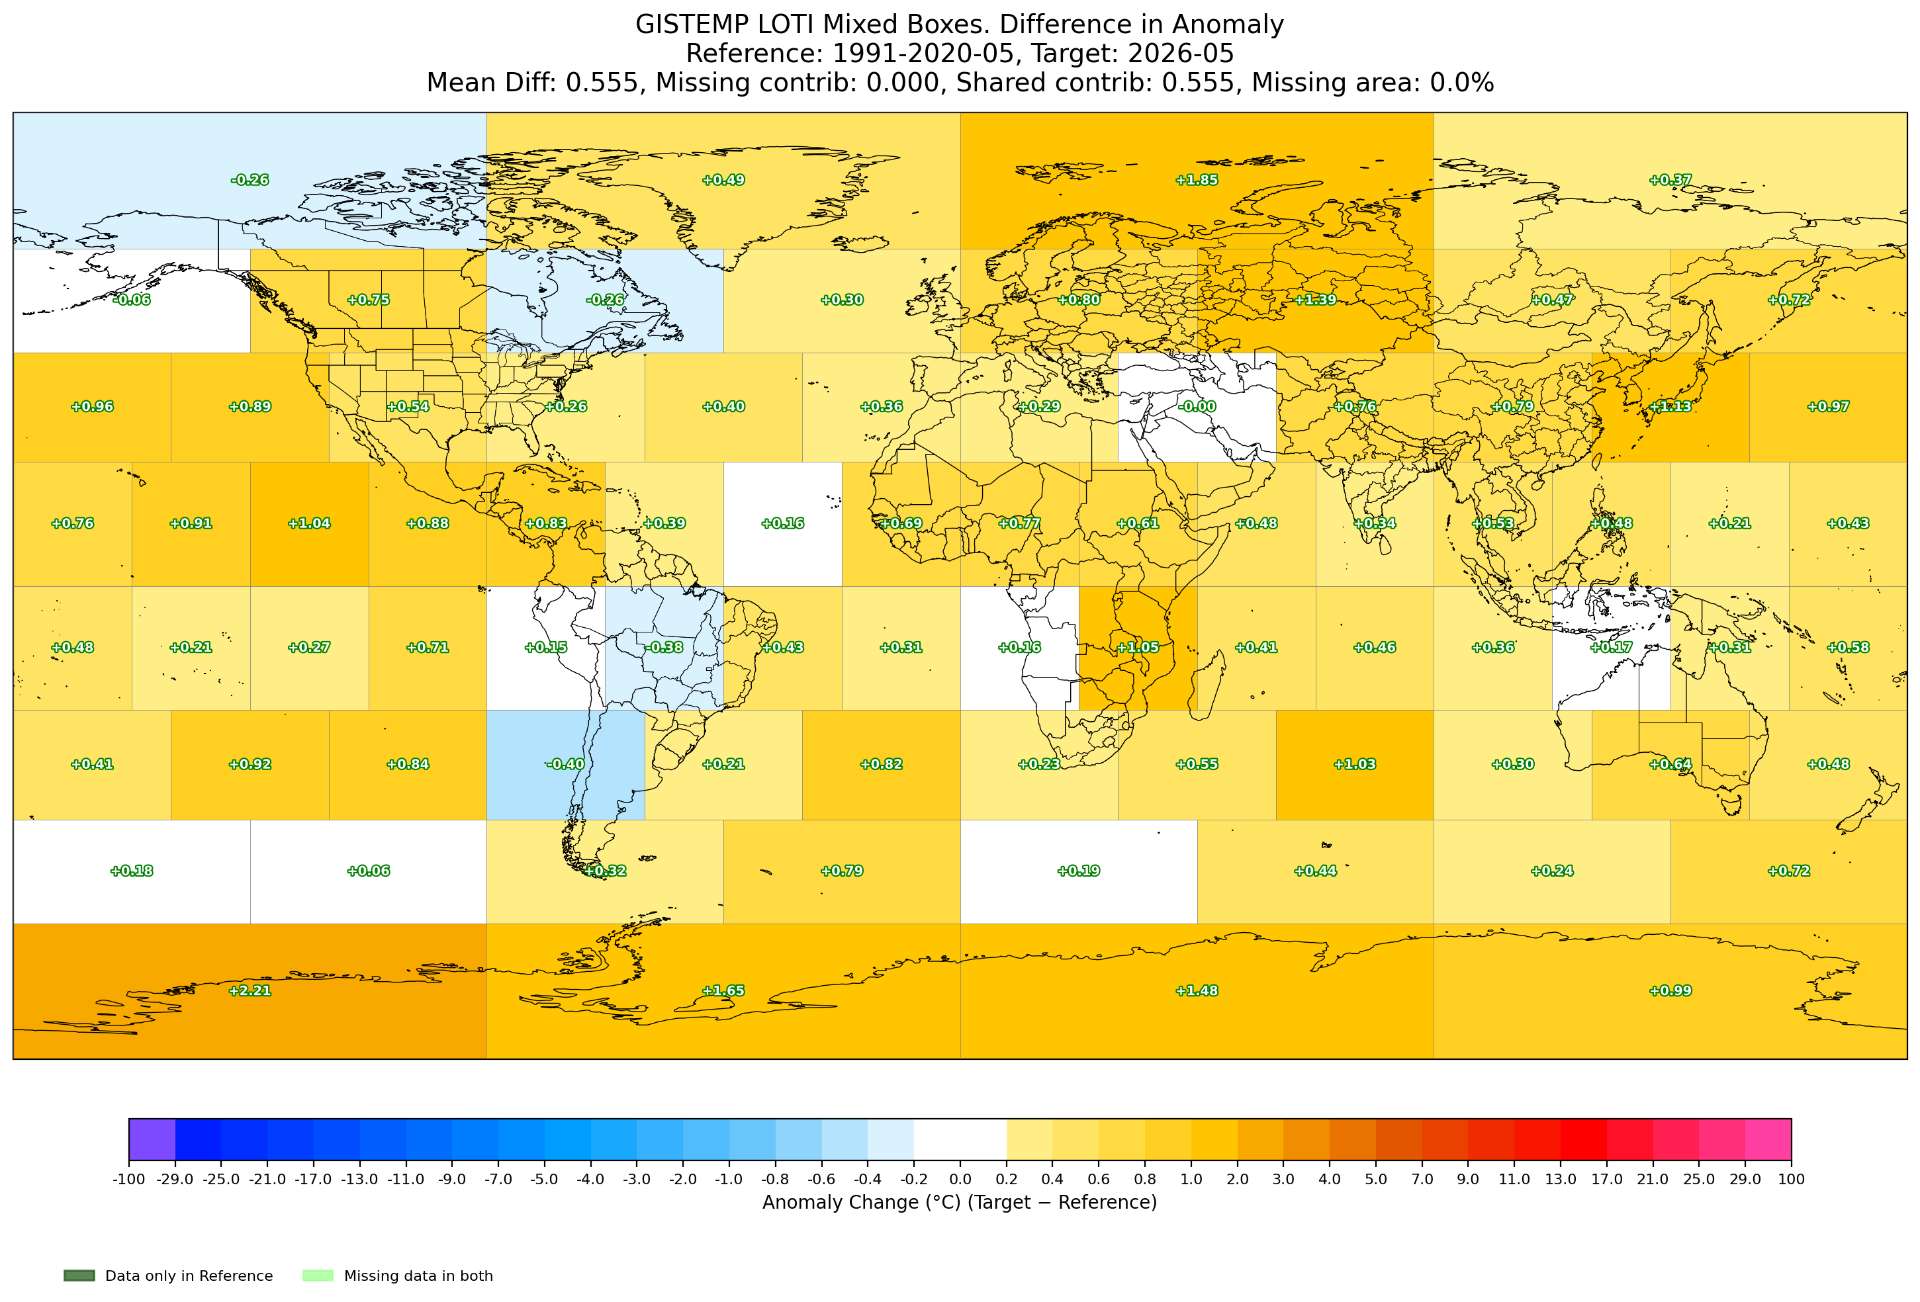
The Antarctica box is currently being infilled far too cool by a single station (Bellingshausen in the South Shetland Islands):
Elev. (m): 14.0, Station: AYM00089050, Name: BELLINGSHAUSEN_AWS
LAT/LON: -62.18/ -58.88, Value: -5.65, Anomaly: -2.43, Last30yrs -> mean: -2.95, min: -6.80, max: -0.45, std: 1.43
The Brazil box is also being poorly infilled so that will warm substantially too.
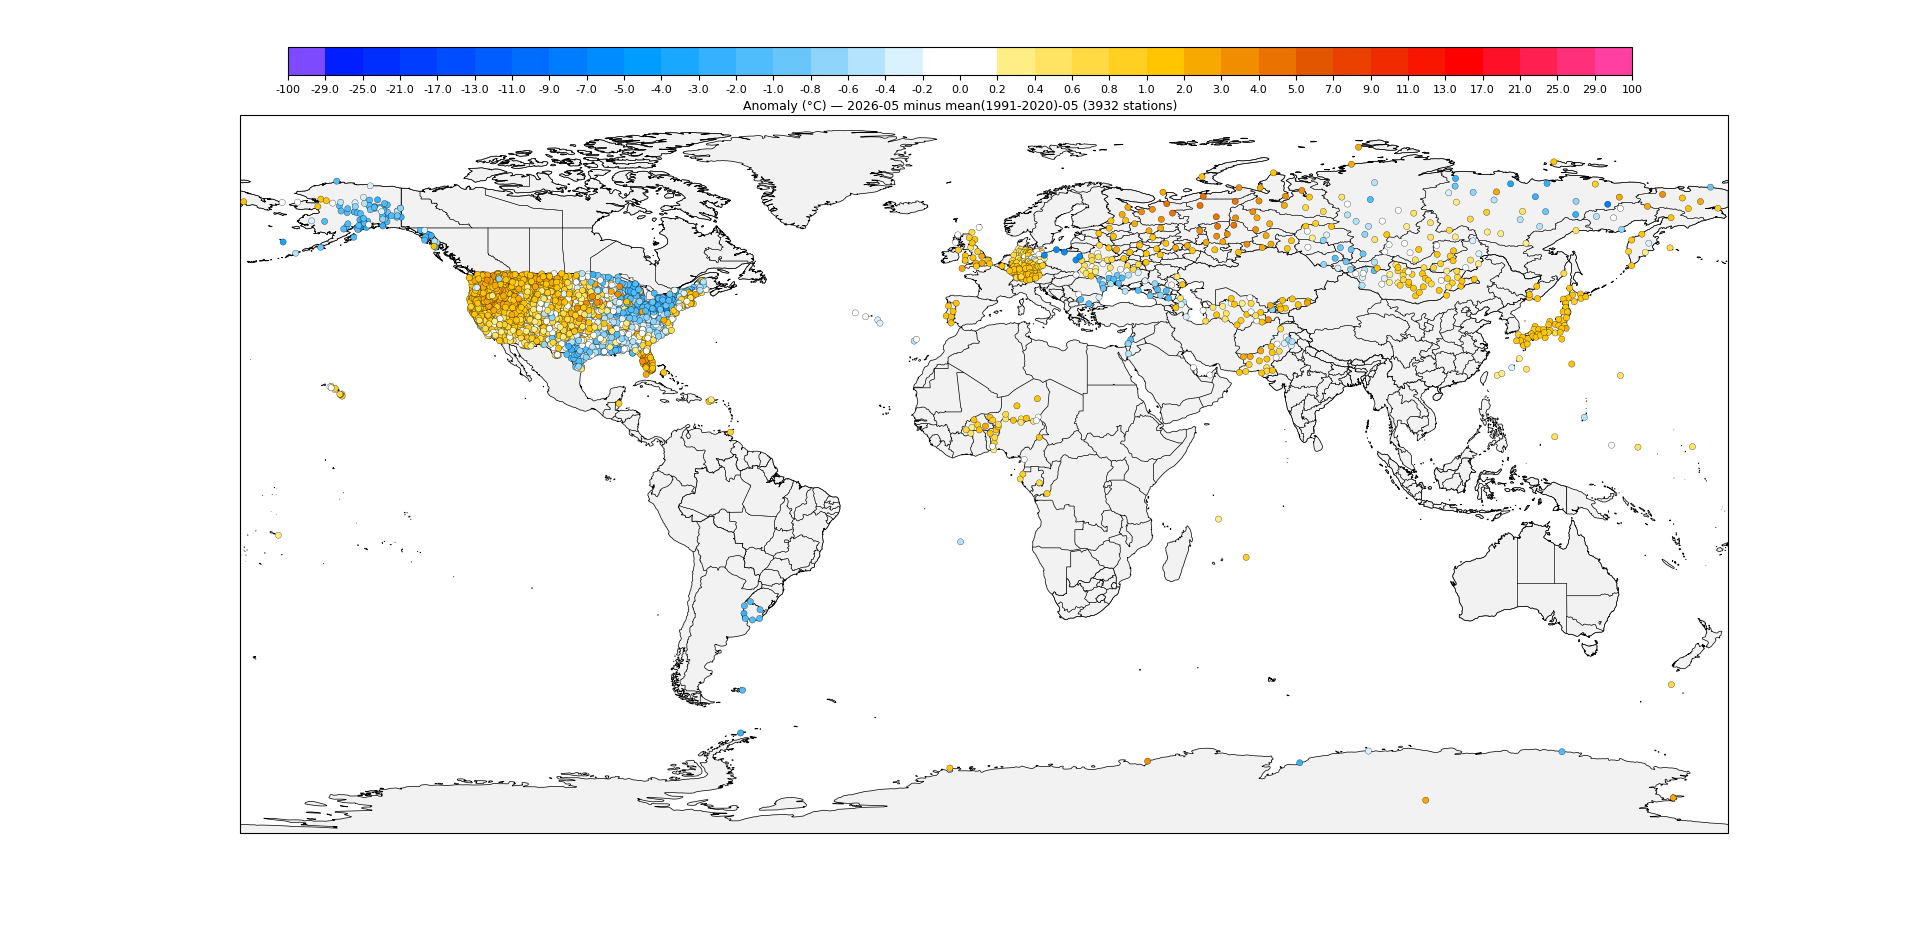
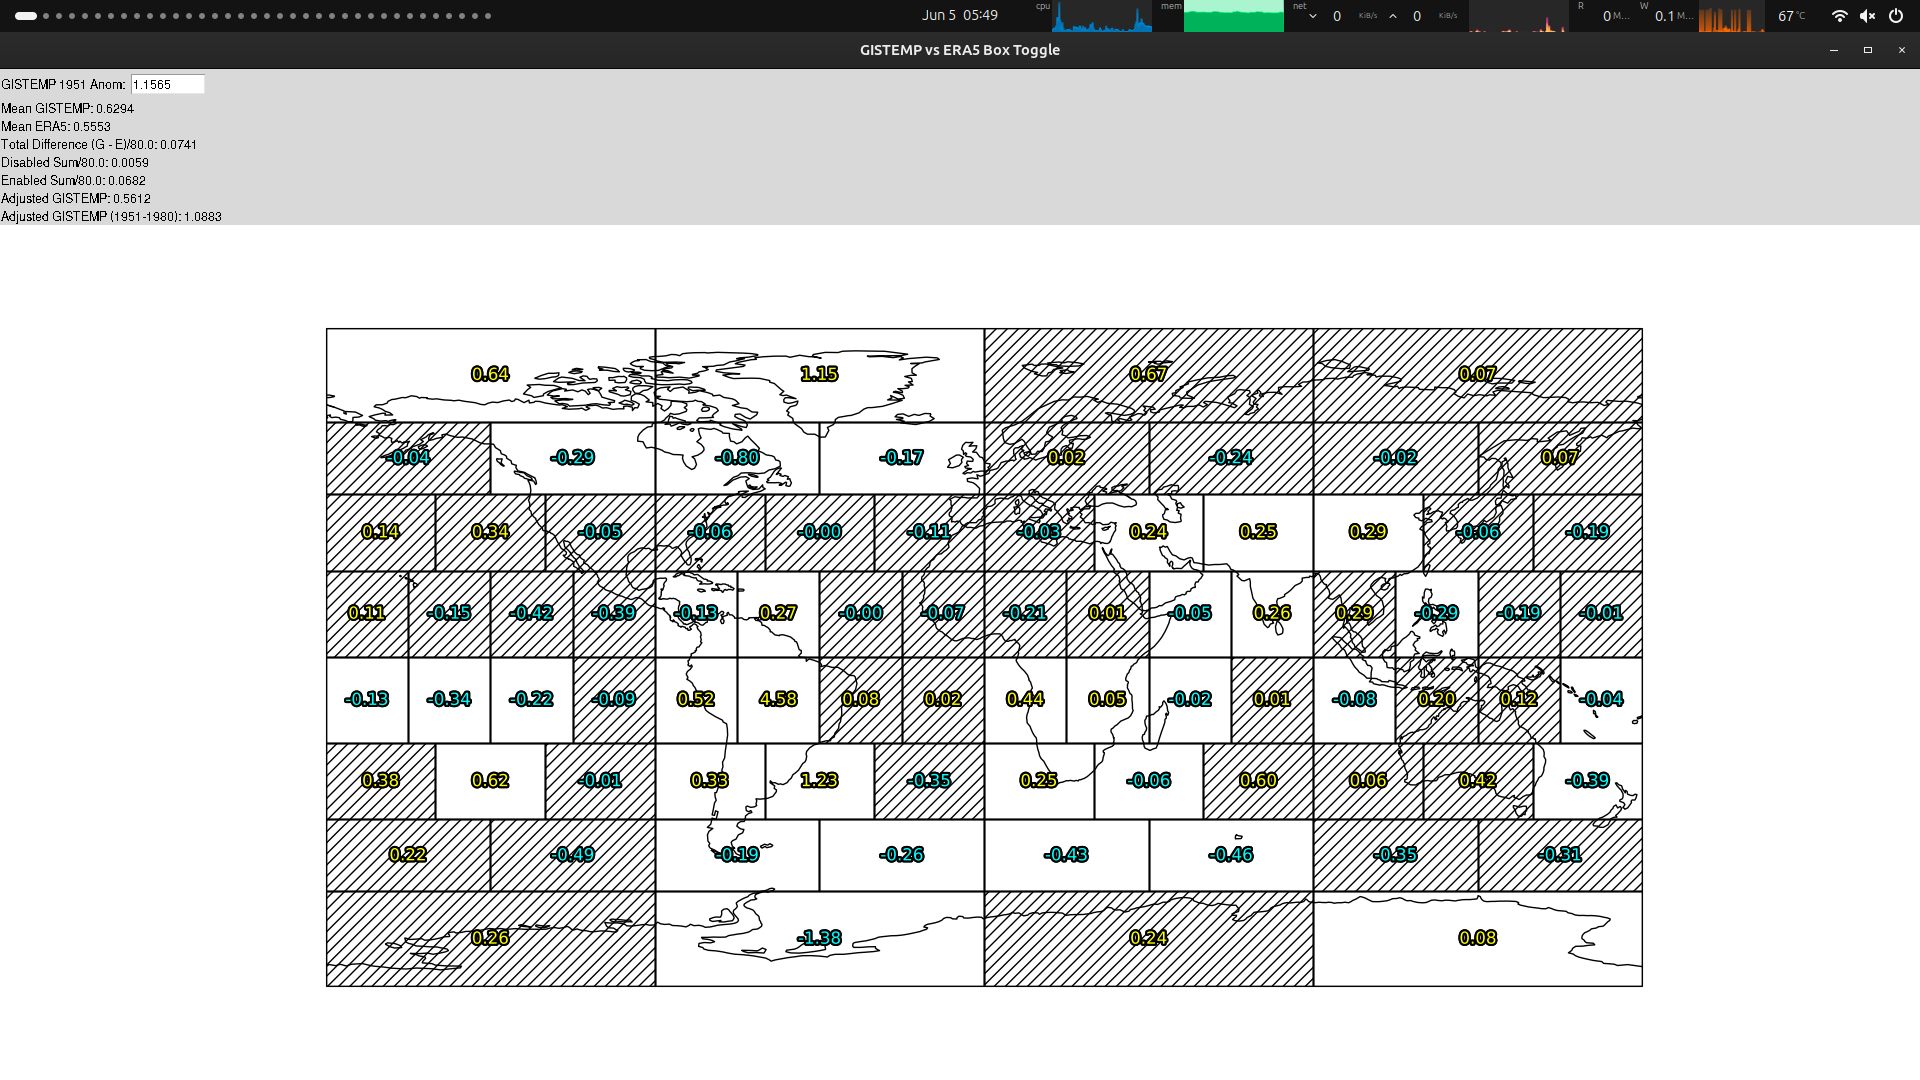
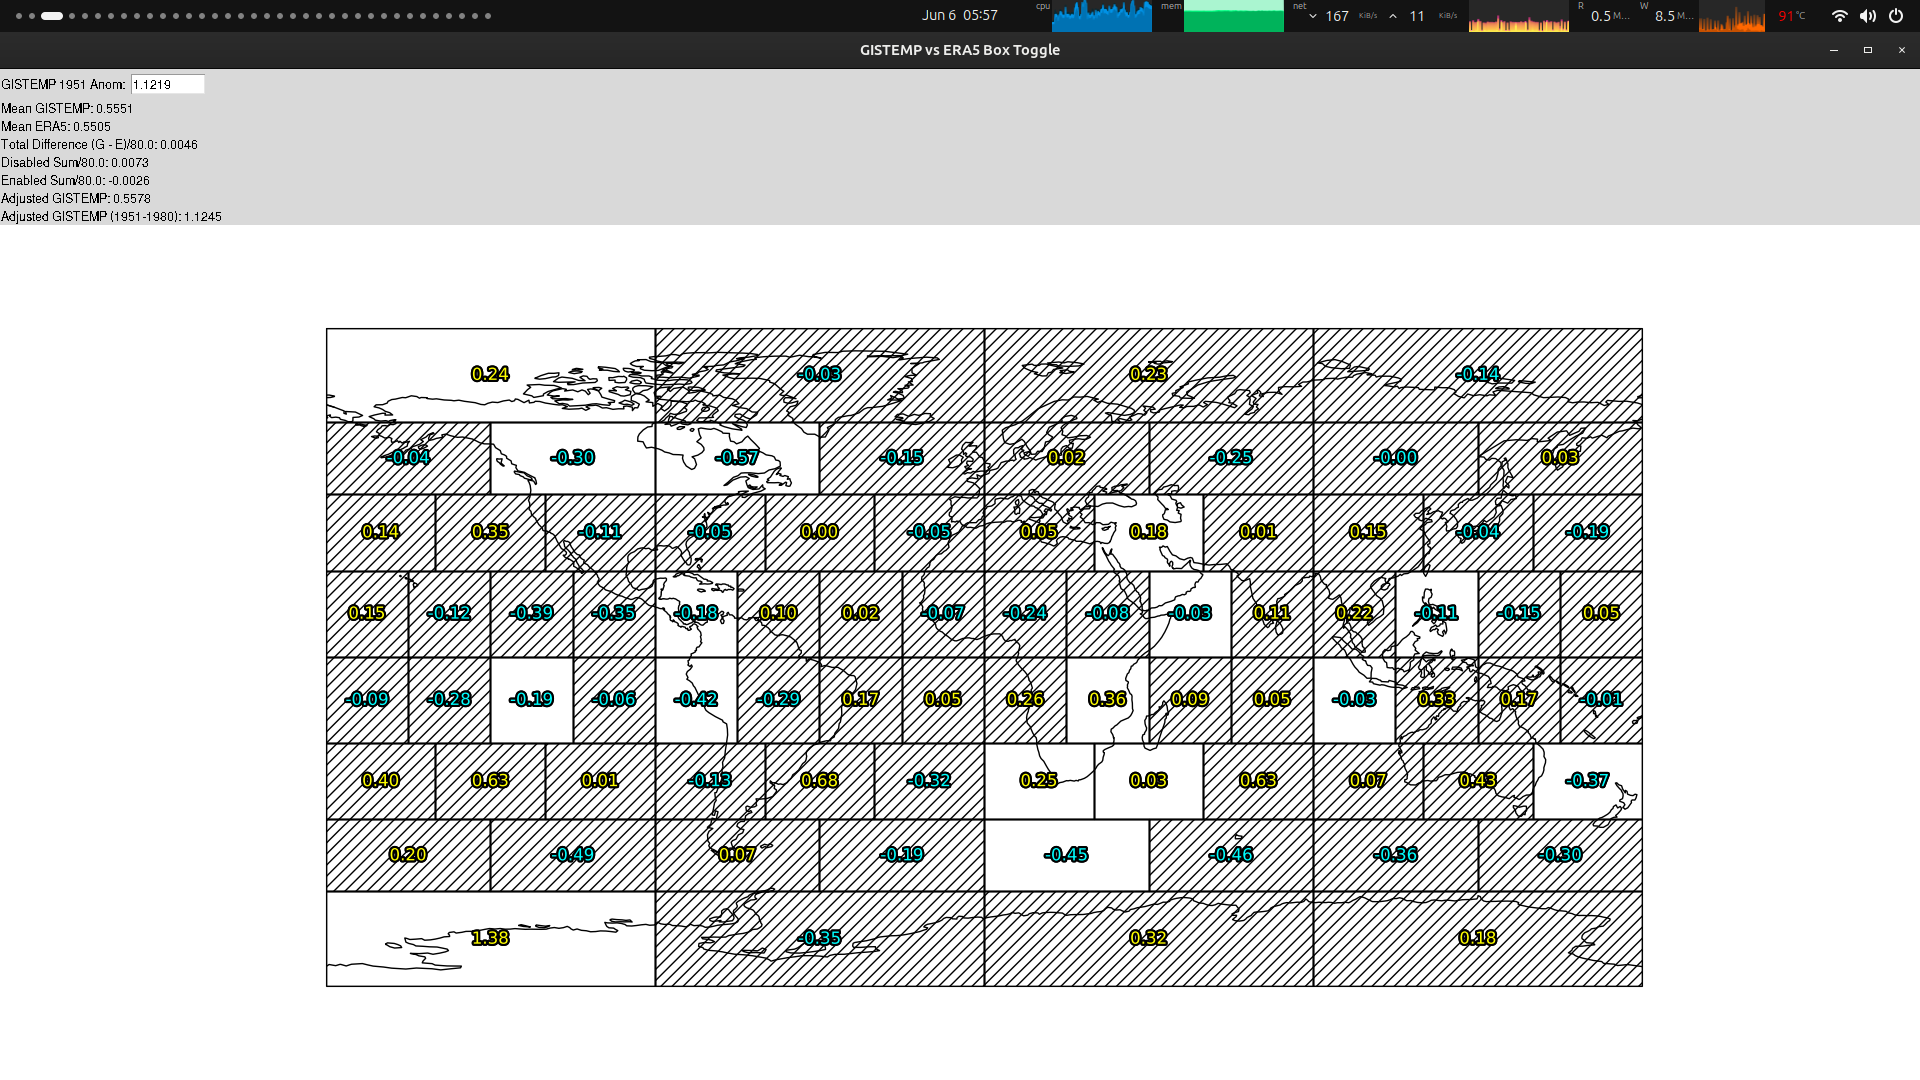
Given the release on the 10th (Wednesday), I think the data we have on the 8th (Monday) is what we will likely have... These are the stations from LAST month on that day:
Notably I've excluded the left most Antarctica box that ERA5 is cooler because I think its fairly well sampled at the moment from the single station I expect there to move it.
There are some other choices like whether some of the Nordic stations will bring it down in the Arctic slightly and same for Mexico (which we haven't gotten good coverage), whether we will get Rwanda/Uganda this month (haven't gotten it previously) which would warm it, but roughly there doesn't seem to be too much variability from the the base case.
Which again is half of the change expected from the boxes I expect more data (and not representative), which from the above comes to ~= +0.0439 / 2 ~= +0.022 C
Given we are at 1.0915 C, this puts my best guess at the moment at 1.1135 C.
This is based on the data expected to be available on June 8 (which would be labeled ghcnm.v4.0.1.20260607). This was nearly identical my prediction before yesterday's work that included ERSSTv5... (the three ERA5->GISTEMP models).
I'm very confident now it will end up in this bin, maybe <5% we end up in either bin on either side (the warm one being slightly more likely) -- I've kept a sizable position (that doesn't reflect my epistemic probabilities) in them in case there is a large revision upwards/downwards to existing stations....
ghcnm.v4.0.1.20260604:
115.648
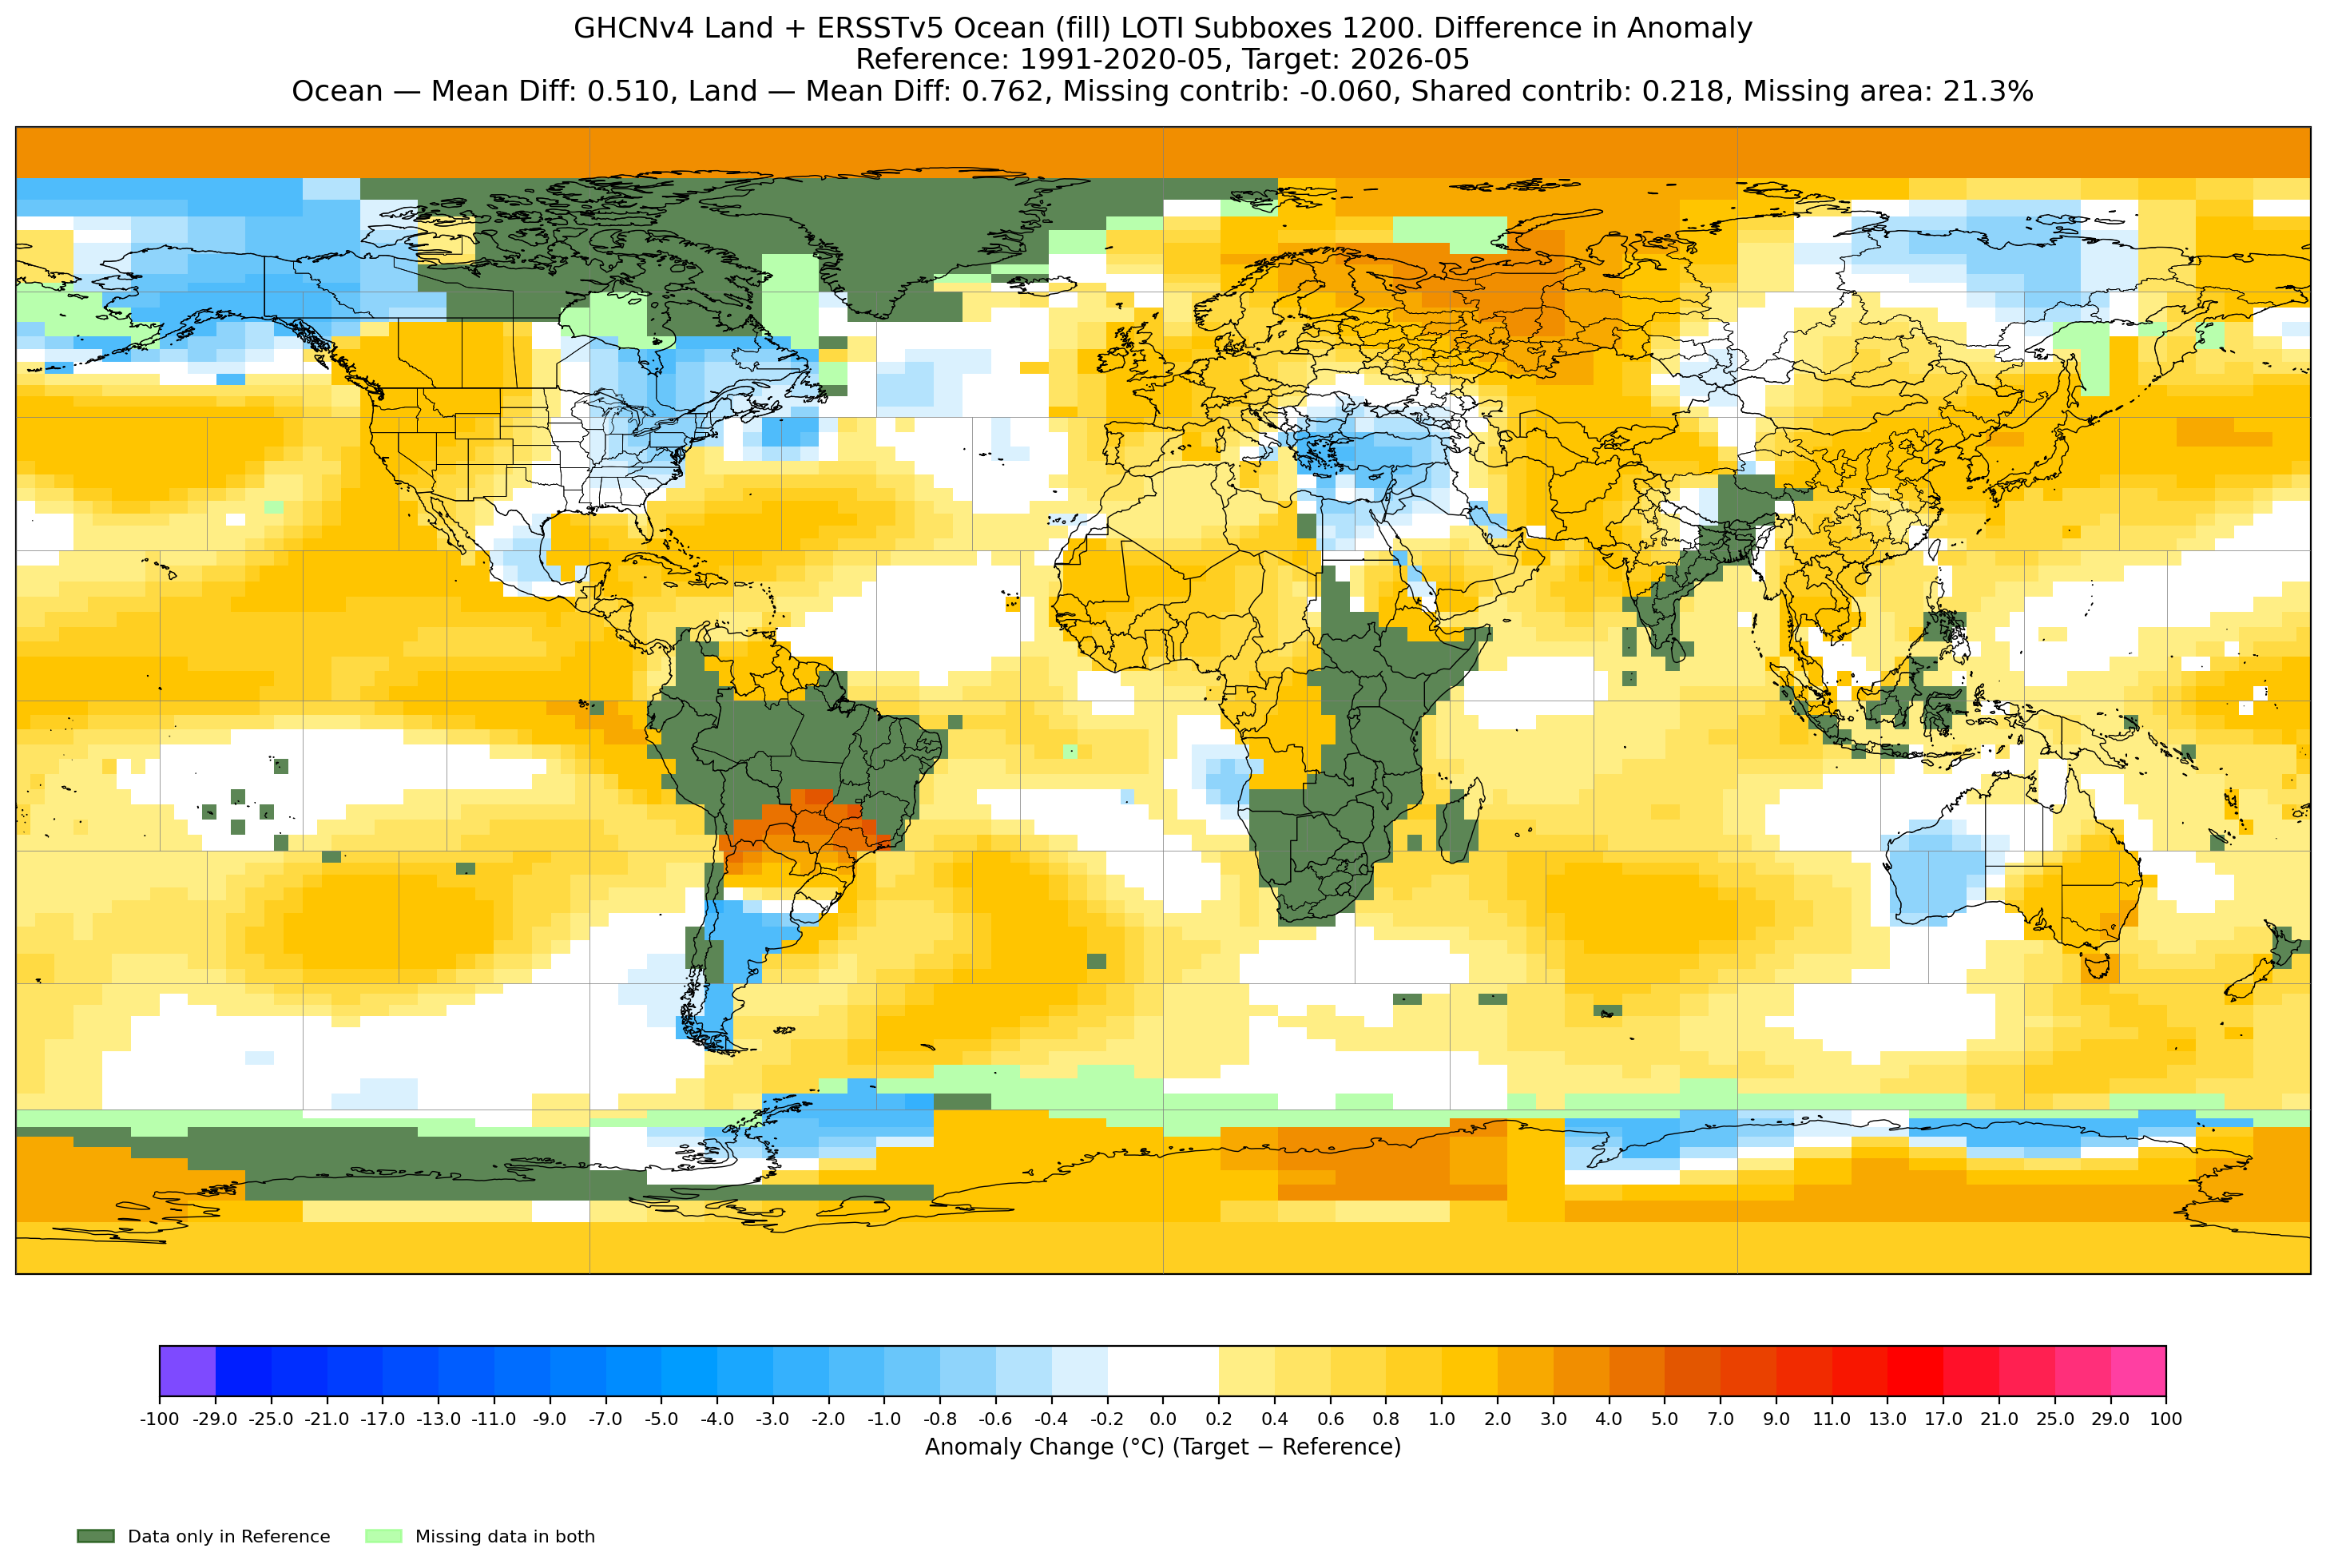
Paraguay is infilling the Brazil box far too warm -- it will come down again once we get Brazil.
We got one more Antarctica station that brought the box that was too cold much closer to what its final value will be.
We also got it looks like all of Australia.
The Poland stations got revised upwards but this only had a marginal change.
Vietnam caused quite a bit of infilling for SE Asia. Also new is Saudia Arabia, Algeria, and a few other West African countries' data.
Expecting about half the drop from the expected delta to ERA5 from the remaining data to come in yields 1.12 C:
1.1565 - (.0682 / 2) ~= 1.1224 C
ghcnm.v4.0.1.20260605:
112.189
ERA5 is finally done:
Got more of South America and those hot Paraguay stations have all been revised downwards. Also many other regions (notably SE Asia and 3/4 boxes for Antarctica). The bottom left most box for Antarctica though is now too warm.
The contributions left nearly all cancel out:
(edit, correction)
1.12189 - 0.0026/2 ~= 1.12059 C
ghcnm.v4.0.1.20260606:
112.931

We got a decent number of stations but definitely not all of Canada. Also a sample of Mexico came in, as well as New Zealand, many scattered island stations, more of SE Asia, and a few more in Europe (but not Turkey yet, which had a cold anomaly in ERA5 to a greater than what's represented at the moment).
No Elizabeth station yet (Antarctica), which is where the greatest degree of change remains. Most likely later tonight is the version of ghcnm that will be used on Monday for the official run on Wednesday, so based on past runs there is about 1/7 chance we won't get it by then. This alone won't change the bin it ends up in but will slightly change the final temperature. Also absent are South Africa, Turkey, Central America, the Phillipines.
Of these other data absent, the box for Marion Island (south of the South Africa box) is (GISTEMP/ERSST5 relative to ERA5) the coldest currently infilled (the ocean anomalies south of Marion Island from ERSST being quite a bit cooler than ERA5 t2m anomalies), and I note we haven't gotten any data from it since January:
SF0000689942025TAVG 910 P 910 P-9999 QP 730 P 910 P 525 P 520 P 535 P 360 P 500 P 910 P 660 P
SF0000689942026TAVG 840 3-9999 -9999 -9999 -9999 -9999 -9999 -9999 -9999 -9999 -9999 -9999
Given how much cooler GISTEMP is for that box relative to ERA5 I don't think we will see it become significantly warmer even if we get Marion Island given the ERA5 shows Marion Island well represented (this is contrary to the box representation above which implies it would warm ~ +0.003 C if we got it ((0.45 / 80) / 2).
If we get Elizabeth the expected change from now is -0.0234 / 2 = -0.0117 down to 1.1176 C, where as if we don't get Elizabeth station tonight the change is -0.0061 / 2 ~= -0.0031, down to 1.1262 C. So 1.12 C remains my expectation (as was the last two days).
ghcnm.v4.0.1.20260607:
112.055
A whopping 800 more stations, but no Elizabeth station from Antarctica.

We did not get Elizabeth but the main contributor to the change was South Africa, which modified 4 of its boxes bringing it down a bit more than -0.01C.
There were other minor contributions that brought it down (Turkey and Antarctica) as well as up (Central/South Asia) that largely canceled each other out (although net warming to a marginal degree but smaller in magnitude than the change from SA).
~
I accidentally neglected this month (a minor error, this time) to include the box that includes Namibia (should have expected it to change when SA came in), which would have slightly brought my estimations down a tiny bit more the last few days.
At the moment though the miss in my prediction from yesterday (where I did conditionalize on not getting Elizabeth was a 1/7 chance but we should end up closer to 1.13 than 1.12 C) arose mostly from actually that the SA boxes not only cooled their boxes (which I estimated they would make about half the way to ERA5), but 2 of them are currently even cooler than ERA5 suggests (the eastern ones), while the ones covering Namibia and Cape Town are slightly warmer than ERA5.
This continues to show South Africa and Antarctica will both continue to be some of the biggest wildcards when we expect to end up close to the bin edges in future months.
~
As the above is, NASA will probably end up using this ghcnm run...
So the official should be 1.12 C
(I have not detected any obvious erroneous stations this month with the various usual diagnostics I use).

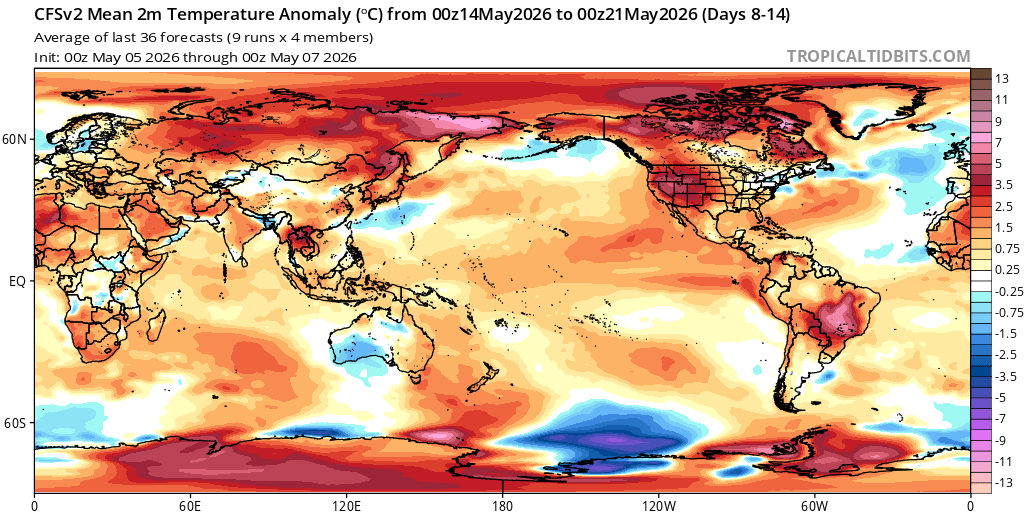
Notable temperature rise over first 14 days of May in medium range super ensemble forecast, as the rise (using a lin. reg.) for the first 14 days of May would be ranked 6th out of 87 years if the current forecast validates (a 0.64 C difference from May 14 to May 1).

ranking of May 1-14:
1968: 0.05661318681318699
2002: 0.054540659340659346
2003: 0.0510989010989007
2012: 0.04960439560439526
1980: 0.047881318681318605
2026: 0.04756657045929035
1960: 0.04687032967032967

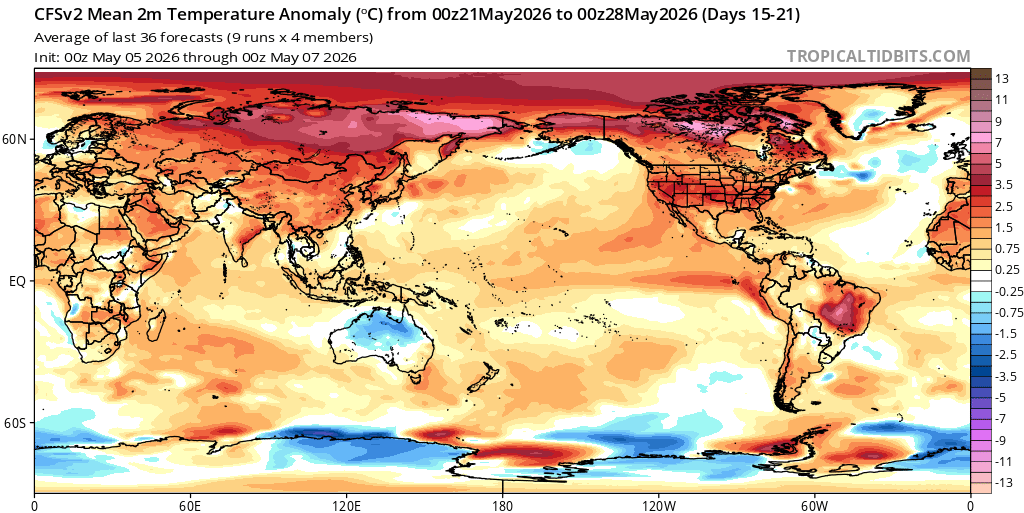
A week later, at this point the first week of May looks like it has validated and the second week forecast has gone even higher, with the slope over these two weeks ranking it 3rd out of 87 years (a 0.72 C difference from May 14 to May 1)...
1968: 0.05661318681318699
2002: 0.054540659340659346
2026: 0.05112604117877309
2003: 0.0510989010989007
2012: 0.04960439560439526
1980: 0.047881318681318605
After looking at the CFS weekly that appears to show a much less anomalous end of the month then the middle (especially Antarctica)..
It spurred me to then spend sometime looking at the long range GEFS from a couple days ago to see if it has a different opinion then the climatology or what appears that CFS might be showing (from just visually).
Rather than comparing absolute values, I compare the day-over-day changes between the final adjusted temps from the super ensemble (after adjusting for its long term biases), and the GEFS long range (from wednesday -- a couple days ago):
>>> (final_deltas - gefs_long_deltas).iloc[-9:]
valid_date
2026-05-23 0.016614
2026-05-24 -0.001179
2026-05-25 -0.003278
2026-05-26 -0.016506
2026-05-27 -0.005293
2026-05-28 -0.006945
2026-05-29 -0.013297
2026-05-30 -0.012357
2026-05-31 -0.009789
Technically for the 23rd we only have GEPS/GEFS (no EPS so I included it as reference; 24th onwards is the usual adjusted Prophet extrapolation after all adjustments).
Integrating the deltas requires a bit of code but then it comes out that GEFS long range is about +0.0239 C on average over what I already had for the last 8 days. This is actually a small contribution, that amounts to a suggestion of about +0.006 C for the month.
Given how much worse GEFS long range is compared to climatology usually, I'm going to still assume the climatology is a better judge at the long range, given that it doesn't amount to anything wildly different and the trend is roughly consistent (although a bit less steep than GEFS long range) (not anything too concerning to discount the Prophet extrapolation).
~
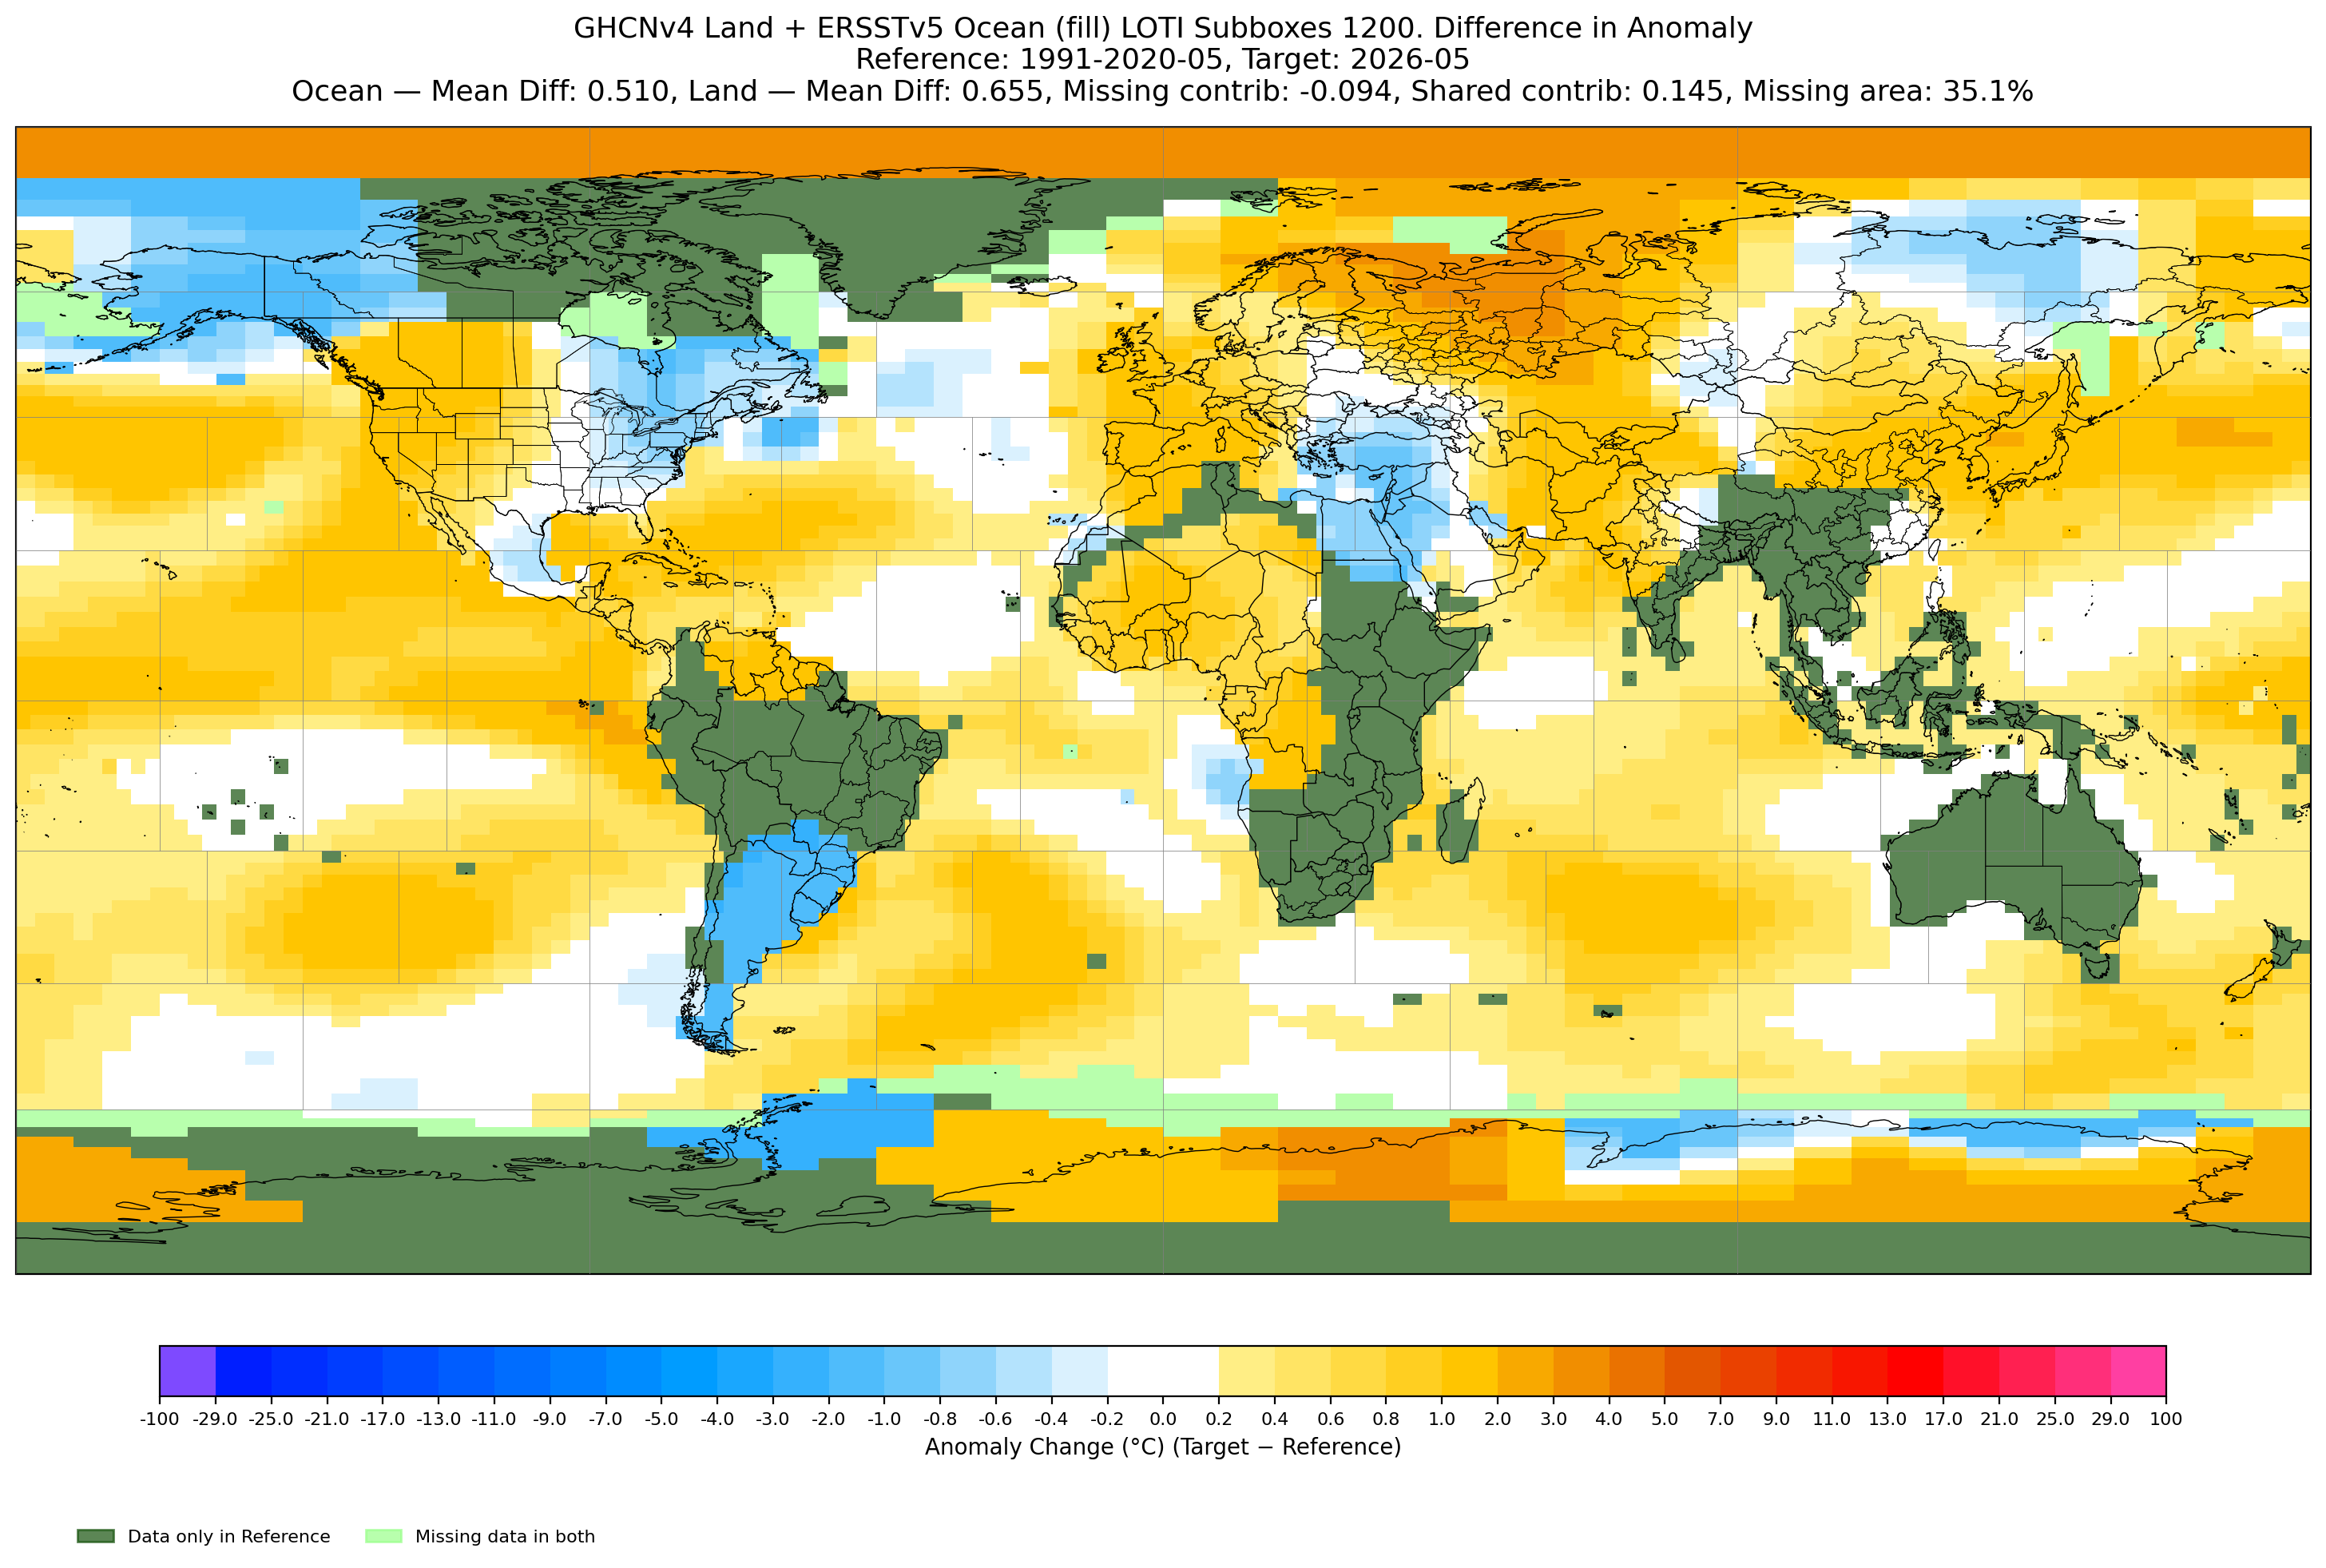
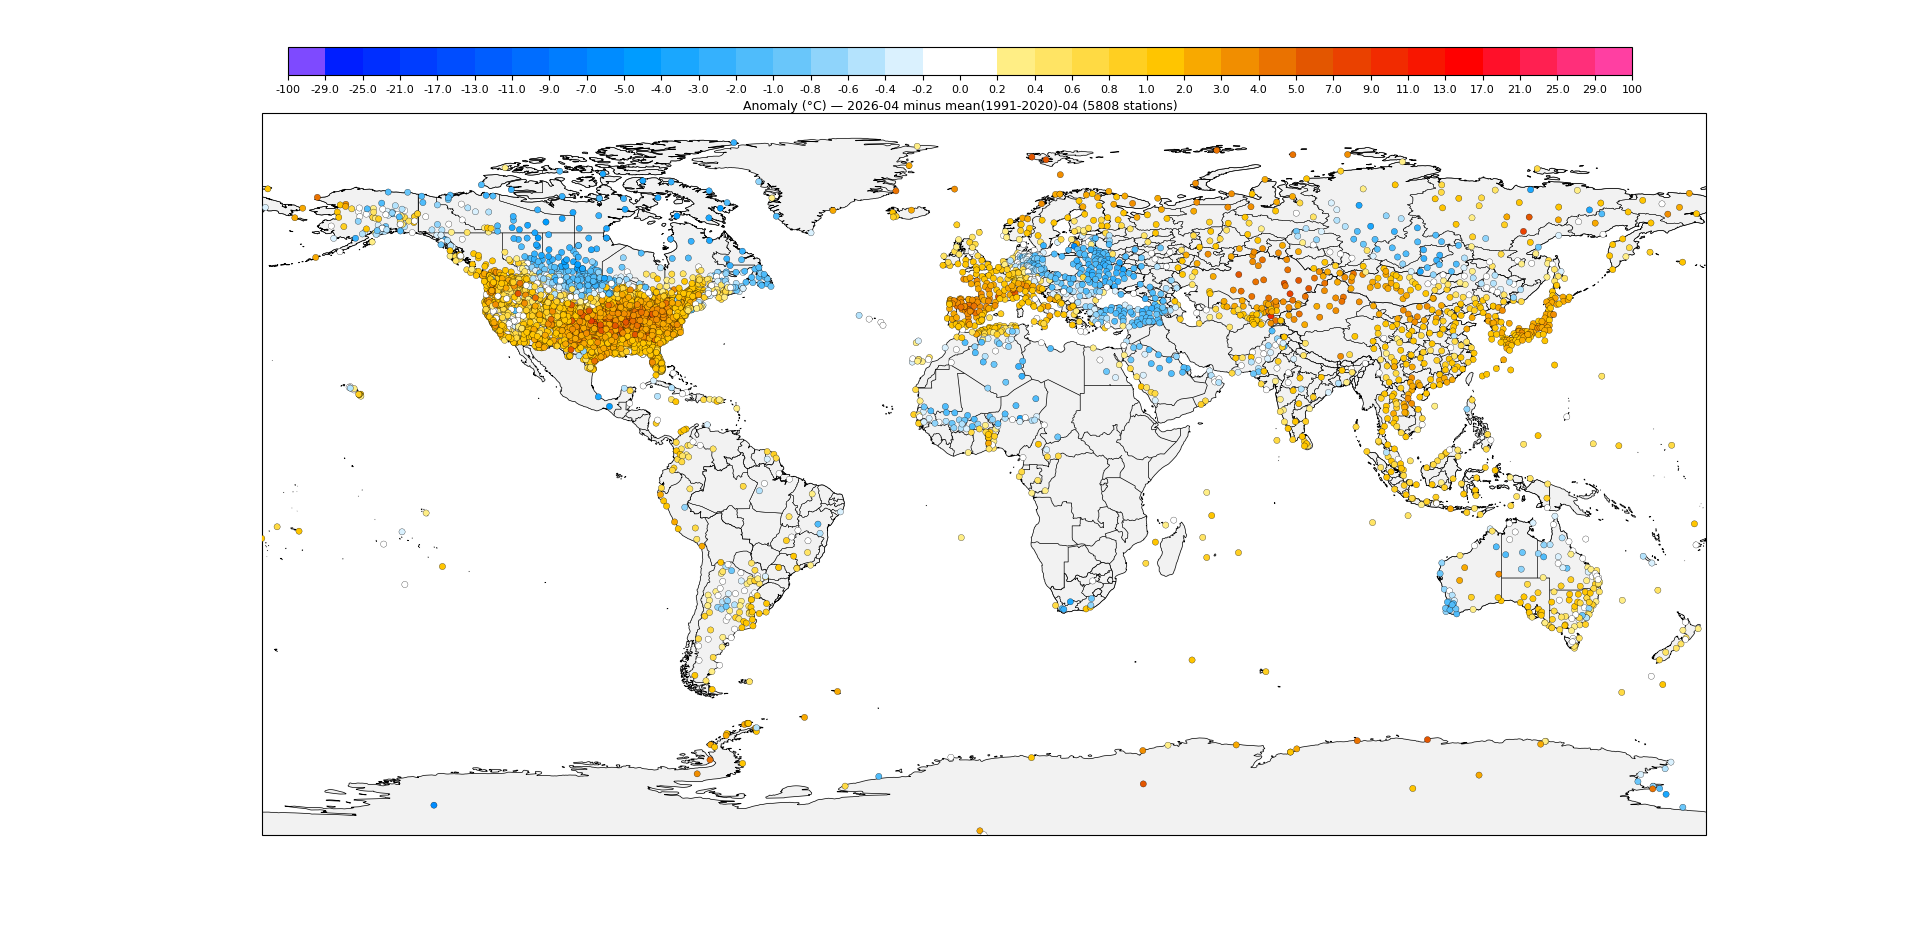
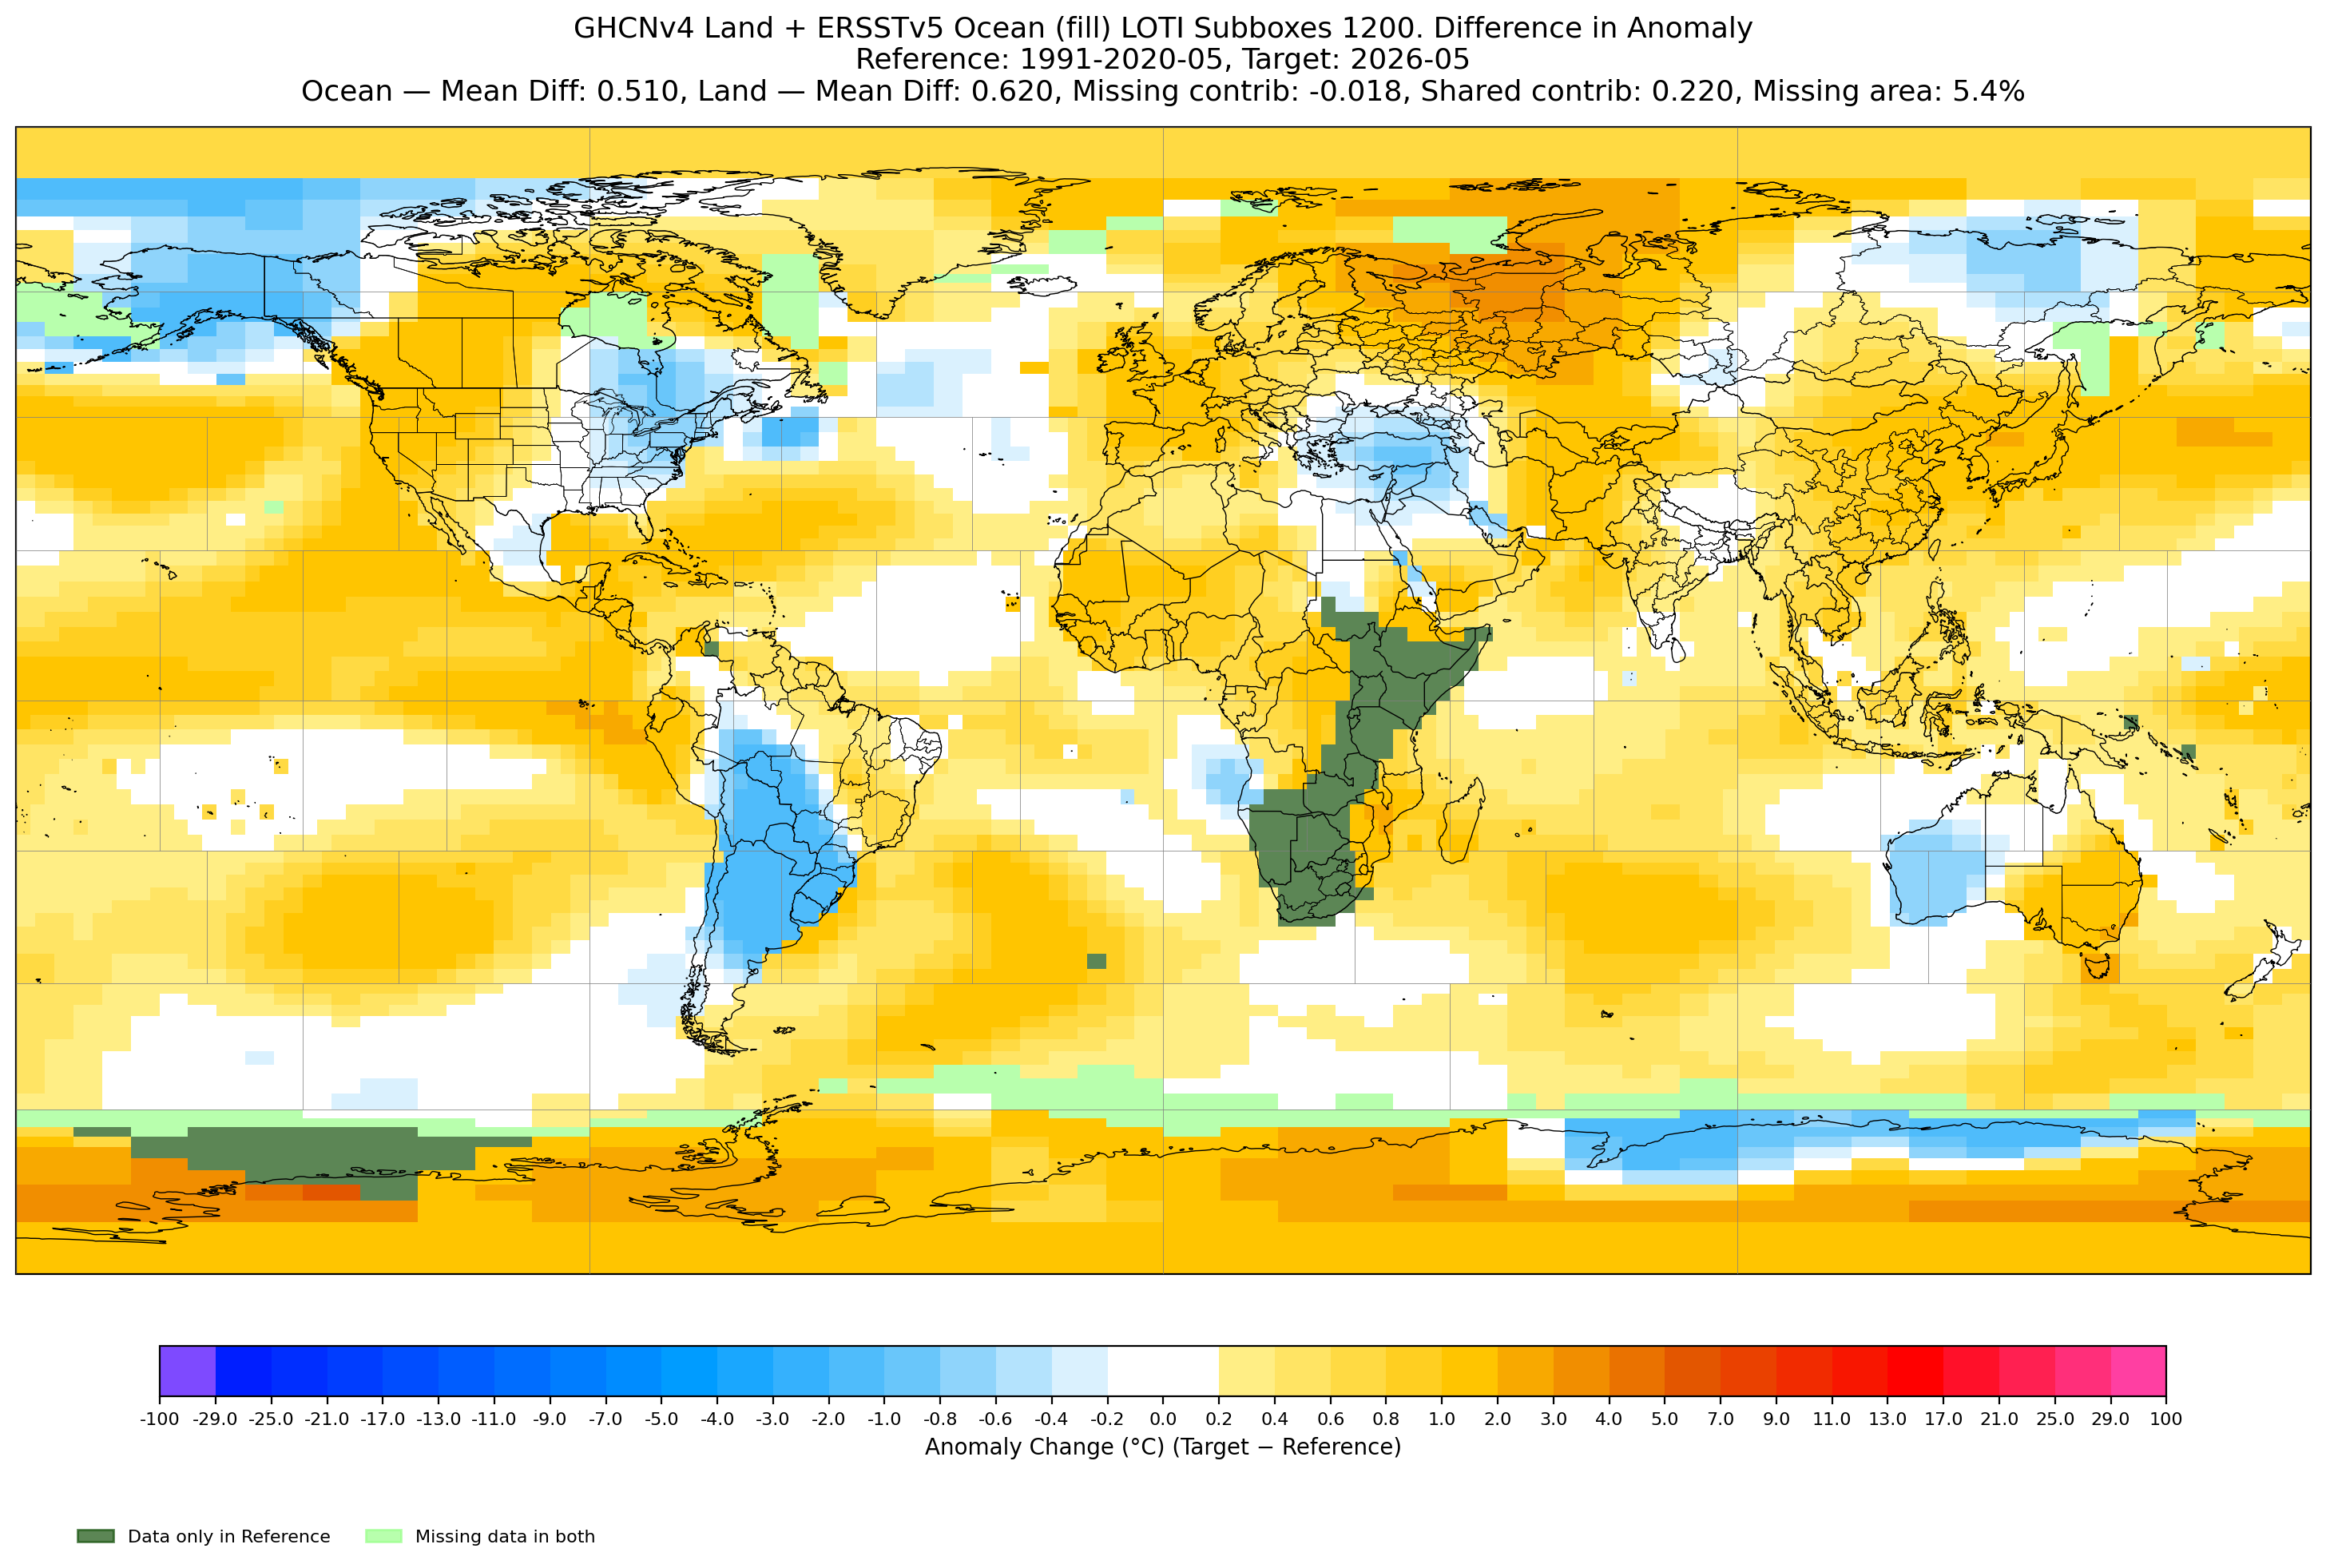
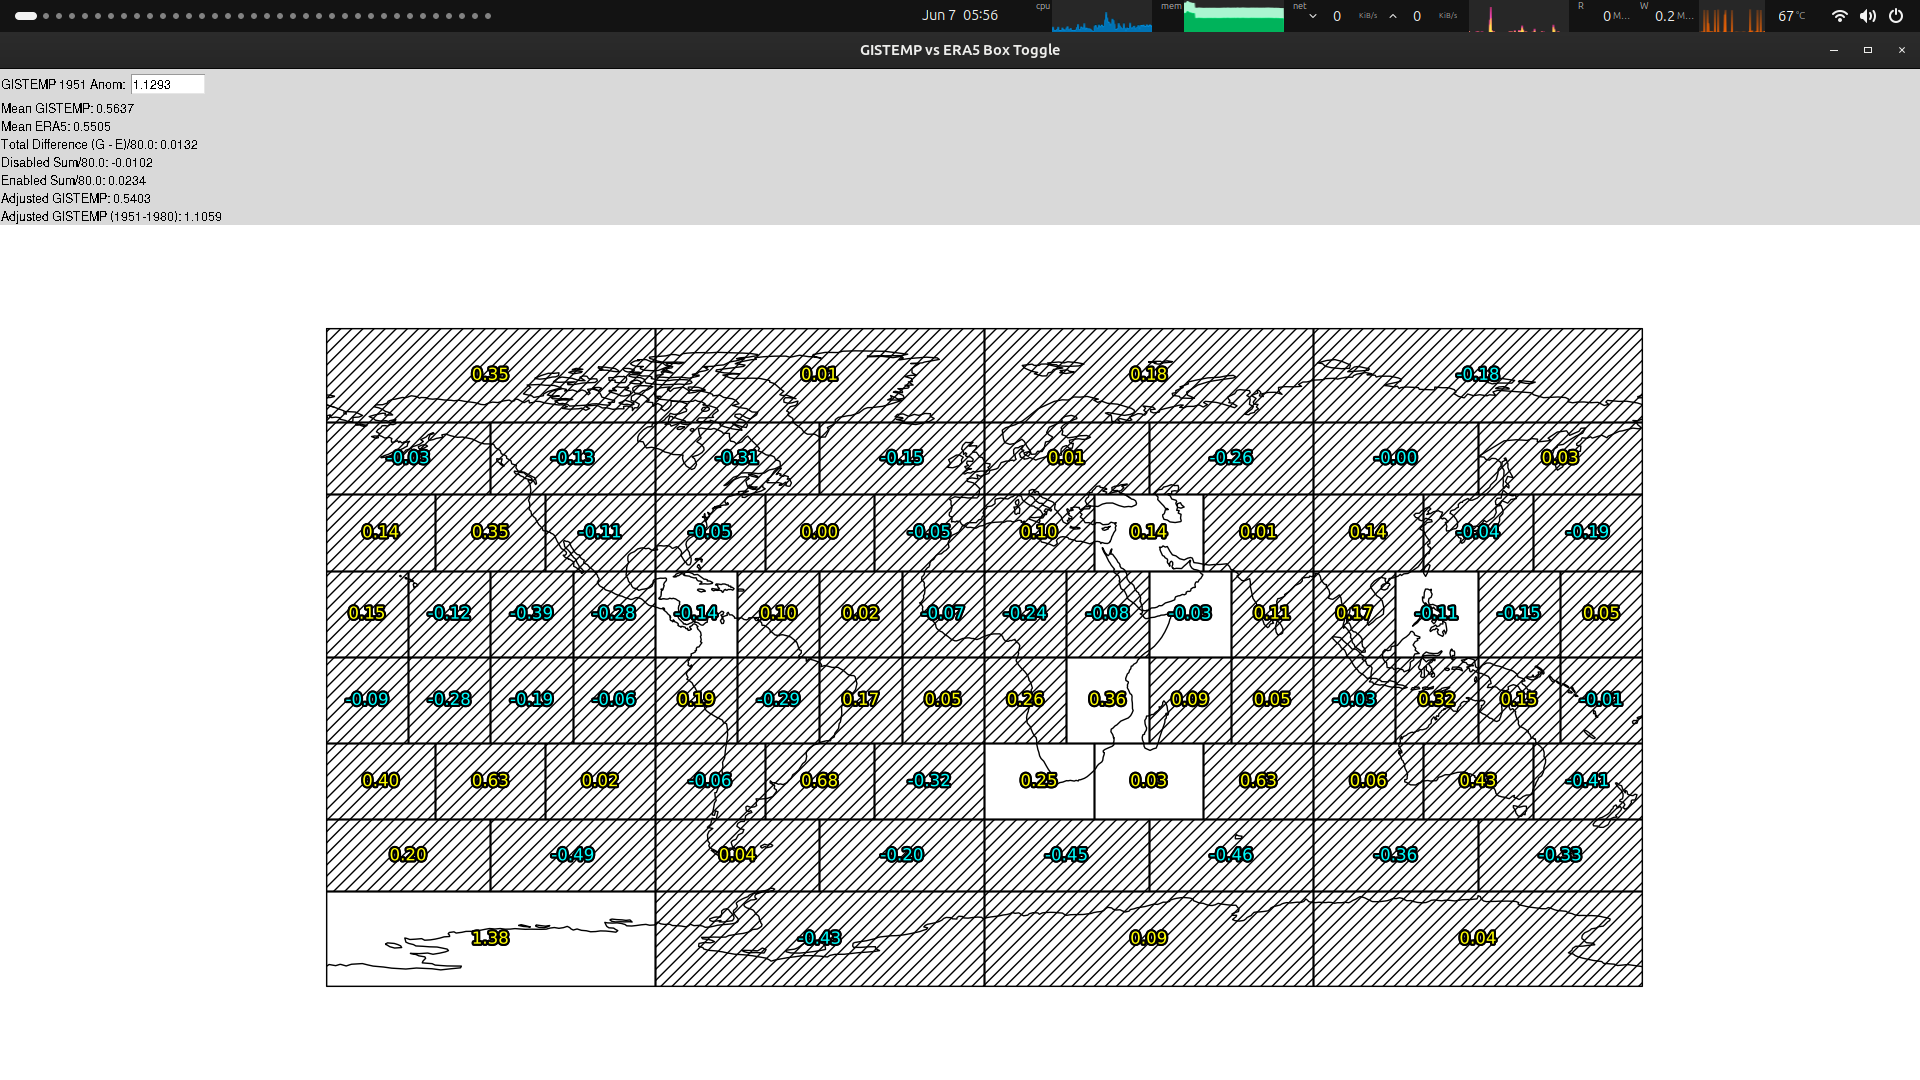
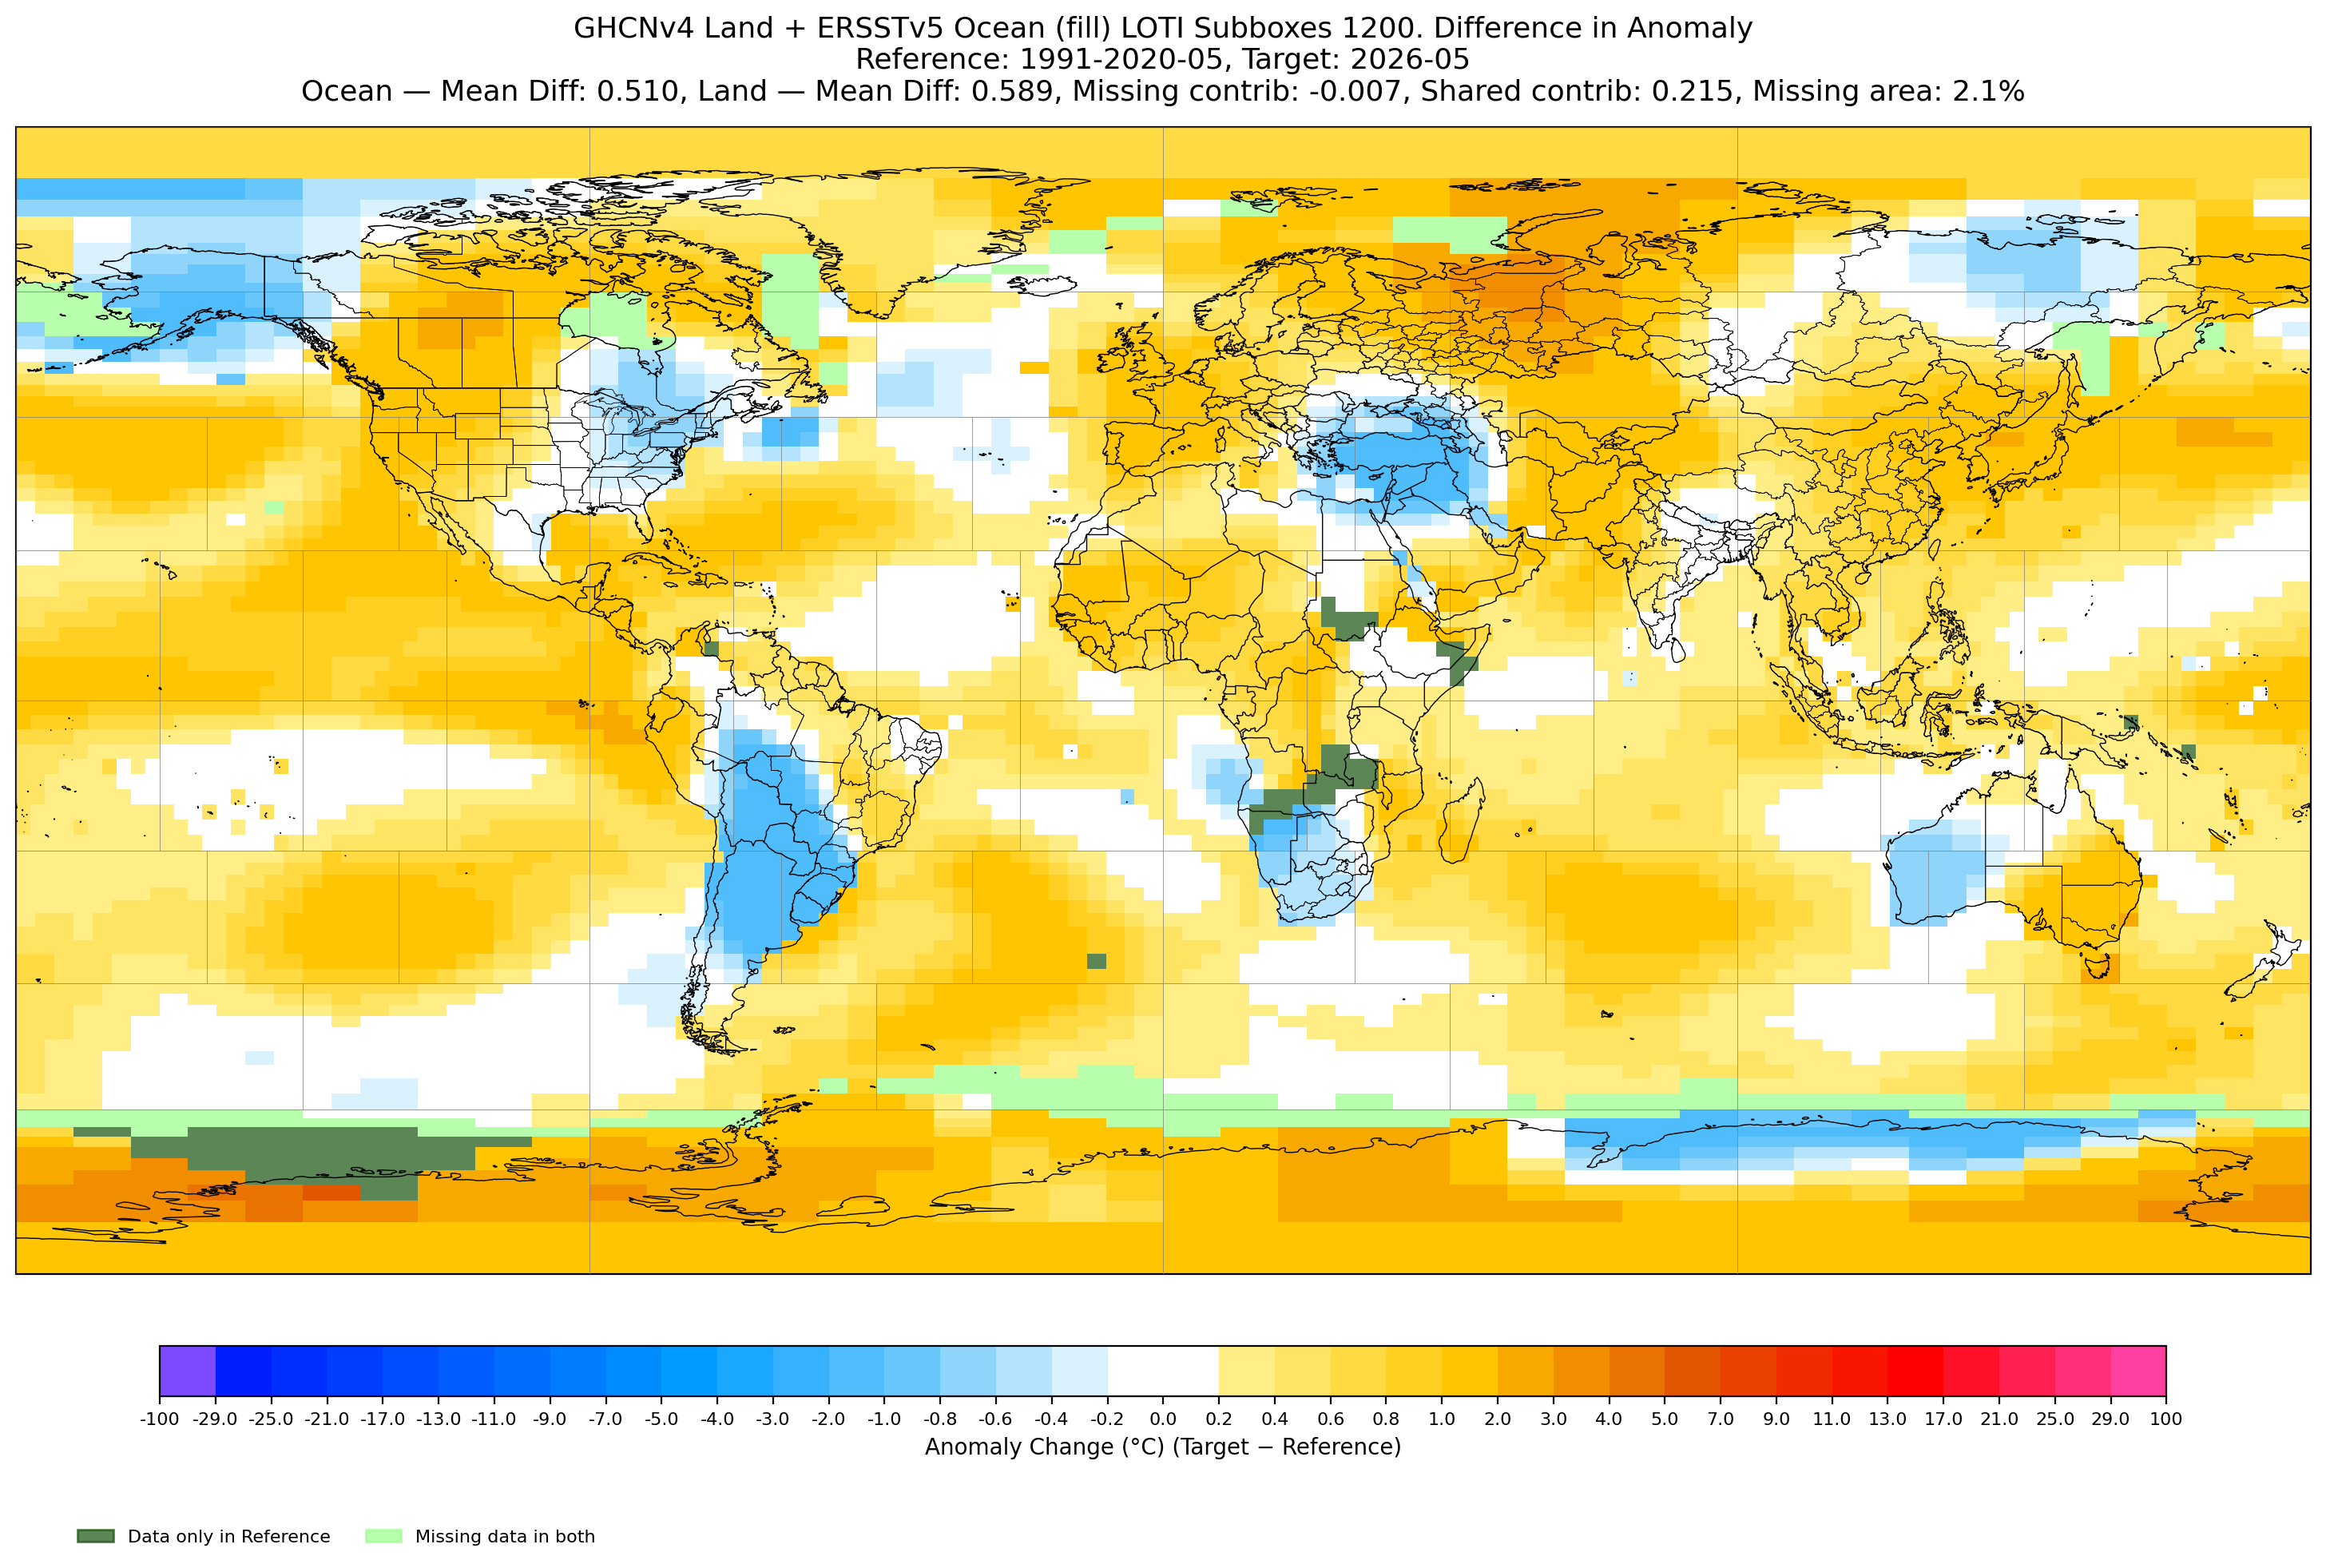
Comparing the mean subboxes from April 2026 and April 2024 from the latest gistemp run..
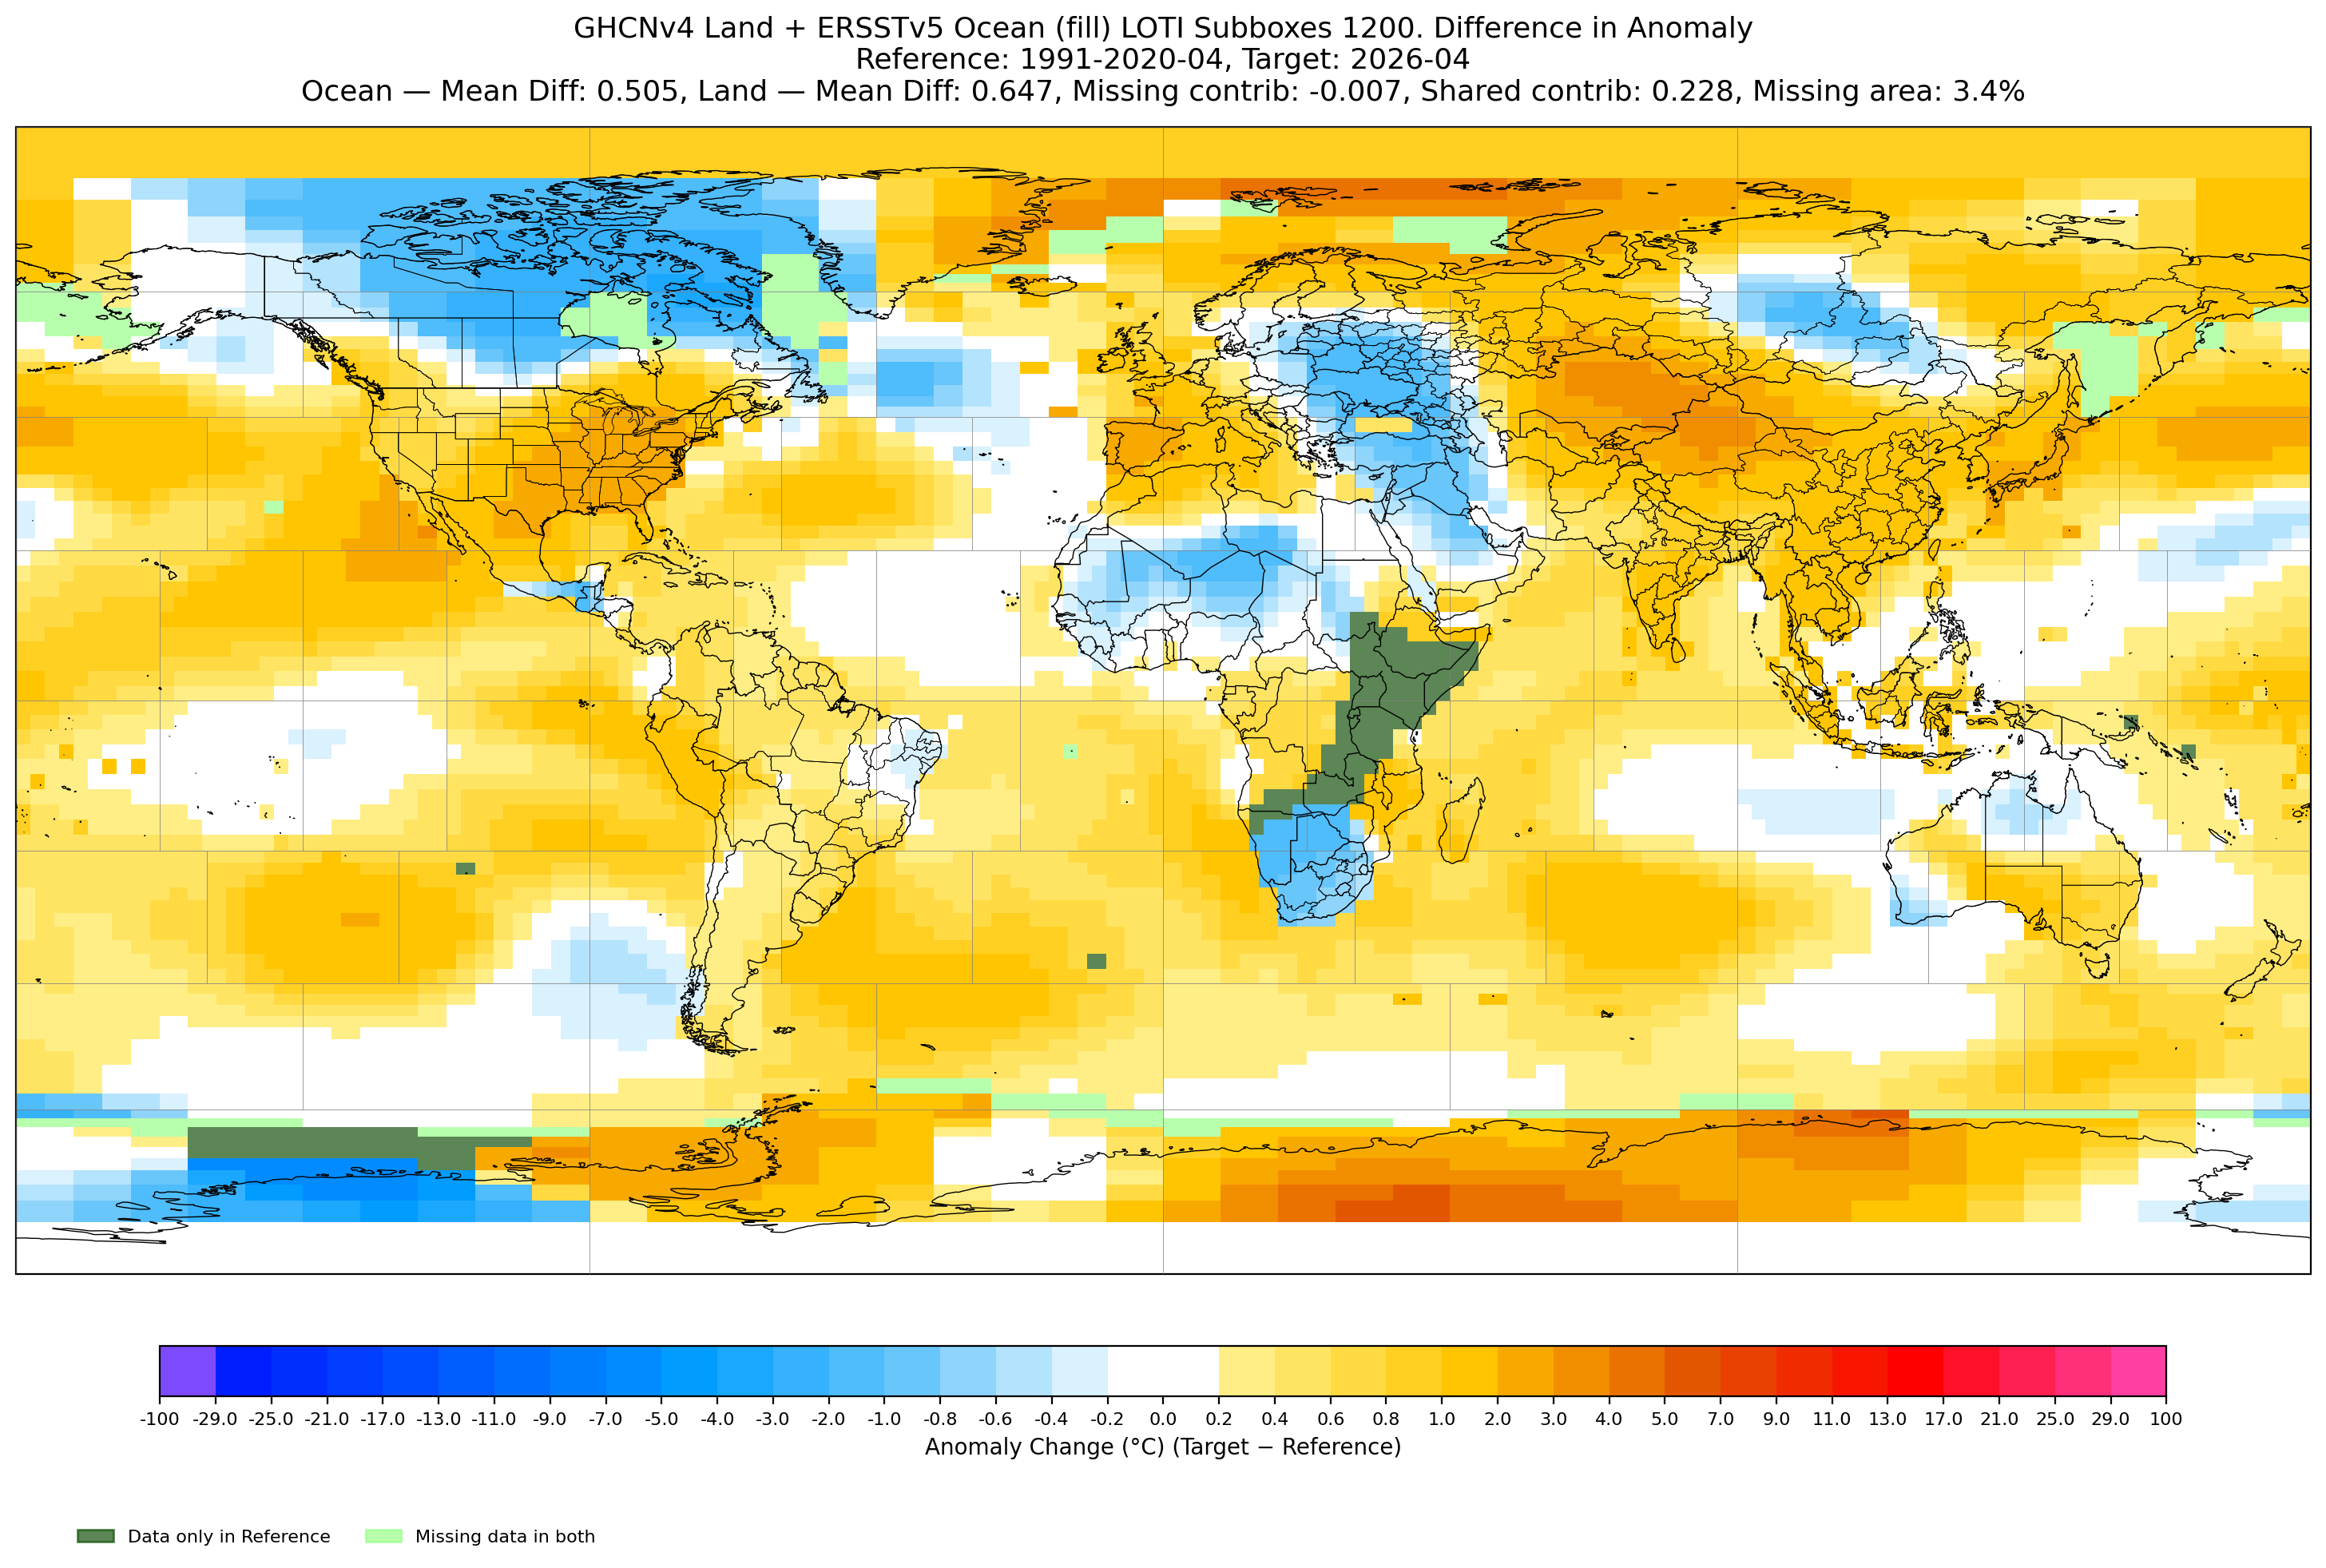
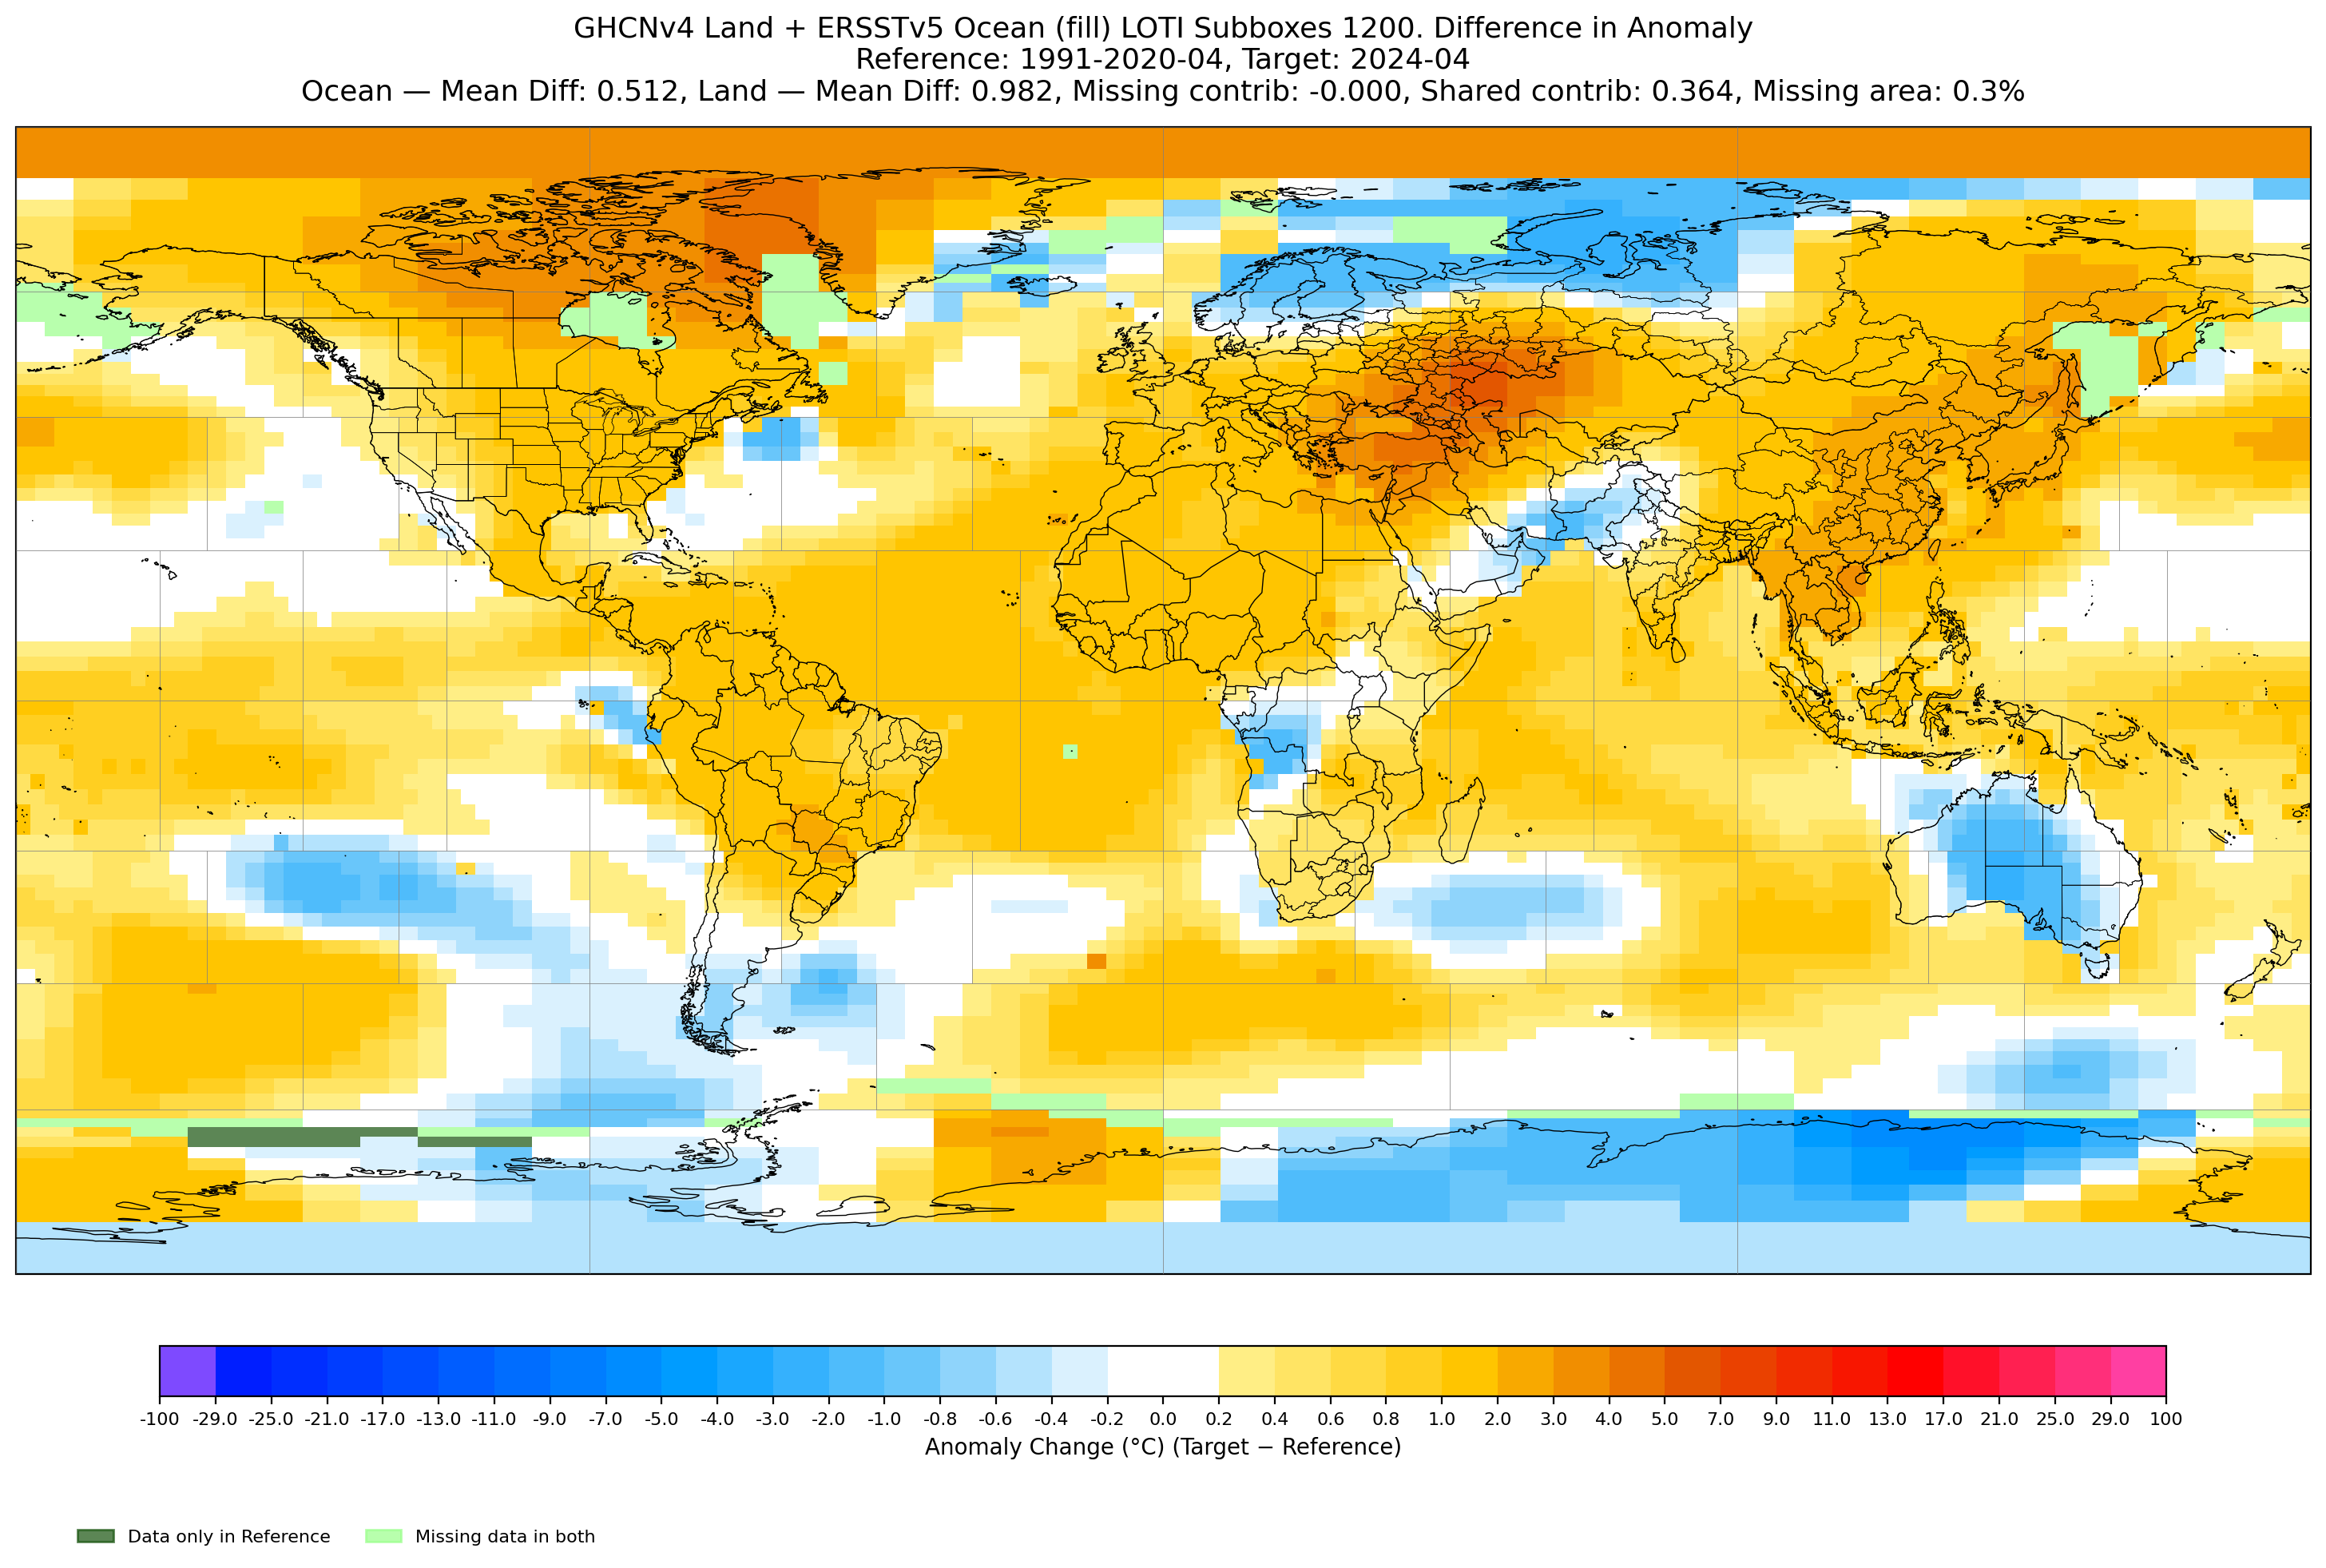
Using the mean of these subboxes (equally weighted), the ocean was only a tiny bit cooler in 2026 (-0.007), but the land anomaly was significantly cooler in 2026 than 2024 (-0.335 C). This makes it the best analog...
~
The first two weeks of May 2024's rise (slope of 0.02489) is roughly half of what 2026 is forecast to be, although there is a plateau and a slight drop in the forecast for 2026 for the 3rd week.
As I've had some poor performance mainly with the old, basic ERA5->GISTEMP model I developed a couple years ago (the p-value for the monthly model of May for instance is 0.09 given the 1940 offset start year, but using an offset of 1950 reveals a p-value of 0.54, resulting in needing to use the yearly model; so I need to to revisit this to come up less brittle scorer / revise the whole model).
For now I compare the ERA5 data directly from May: 2026 is forecast about 0.004C warmer than 2024 in terms of t2m (gistemp has 2024 as 1.1591 for reference). The old GISTEMP->ERA5 monthly model for May 2026 (offset 1940+) would put it unadjusted at 1.19 and the yearly model (1950+) at 1.21. Given the below I'm more tempted to investigate whether recent analogs are better...
Comparing ERA
>>> final_may['2t_adj']
valid_date_month
1940-05-01 14.745484
1941-05-01 14.654323
1942-05-01 14.653065
1943-05-01 14.632097
1944-05-01 14.663581
...
2023-05-01 15.656968
2024-05-01 15.913581
2025-05-01 15.792226
2026-05-01 15.918095
Comparing April as well:
>>> final_april['2t_adj']
valid_date_month
1940-04-01 13.756900
1941-04-01 13.554867
1942-04-01 13.558367
1943-04-01 13.589467
1944-04-01 13.731333
...
2023-04-01 14.682133
2024-04-01 15.031800
2025-04-01 14.962900
2026-04-01 14.885267
For the above, April ERA5 (2026-2024): 14.885 - 15.032 = -0.147
While for GISTEMP April it was (likely): 1.1773 - 1.31358 = -0.136
-0.136 - -0.147 ~= 0.011 C
This isn't bad.. (using 2024 as an analog for 2025, the value is even smaller at ~ -0.003)
What is it for May then for ERA5 (2026 - 2024) after all adjustments for 2026?
15.918095 - 15.913581 ~= 0.005
GISTEMP for May 2024 was ~ 1.159
Suggesting a May 2026 of 1.159 + 0.005 = 1.164 C
This is below what I get (without adjusting for own past forecast errors) with the old GISTEMP->ERA5 model of 1.189 C (and a yearly model using a 1950+ offset of 1.214 C).
Given the other recent delta analog models I've been using has performed better recently I'm leaning towards this other, ad-hoc calculation using 2024 as an analog for another week until the medium range ensemble covers the end of the forecast, or until I do some actual statistical tests to see which works better.
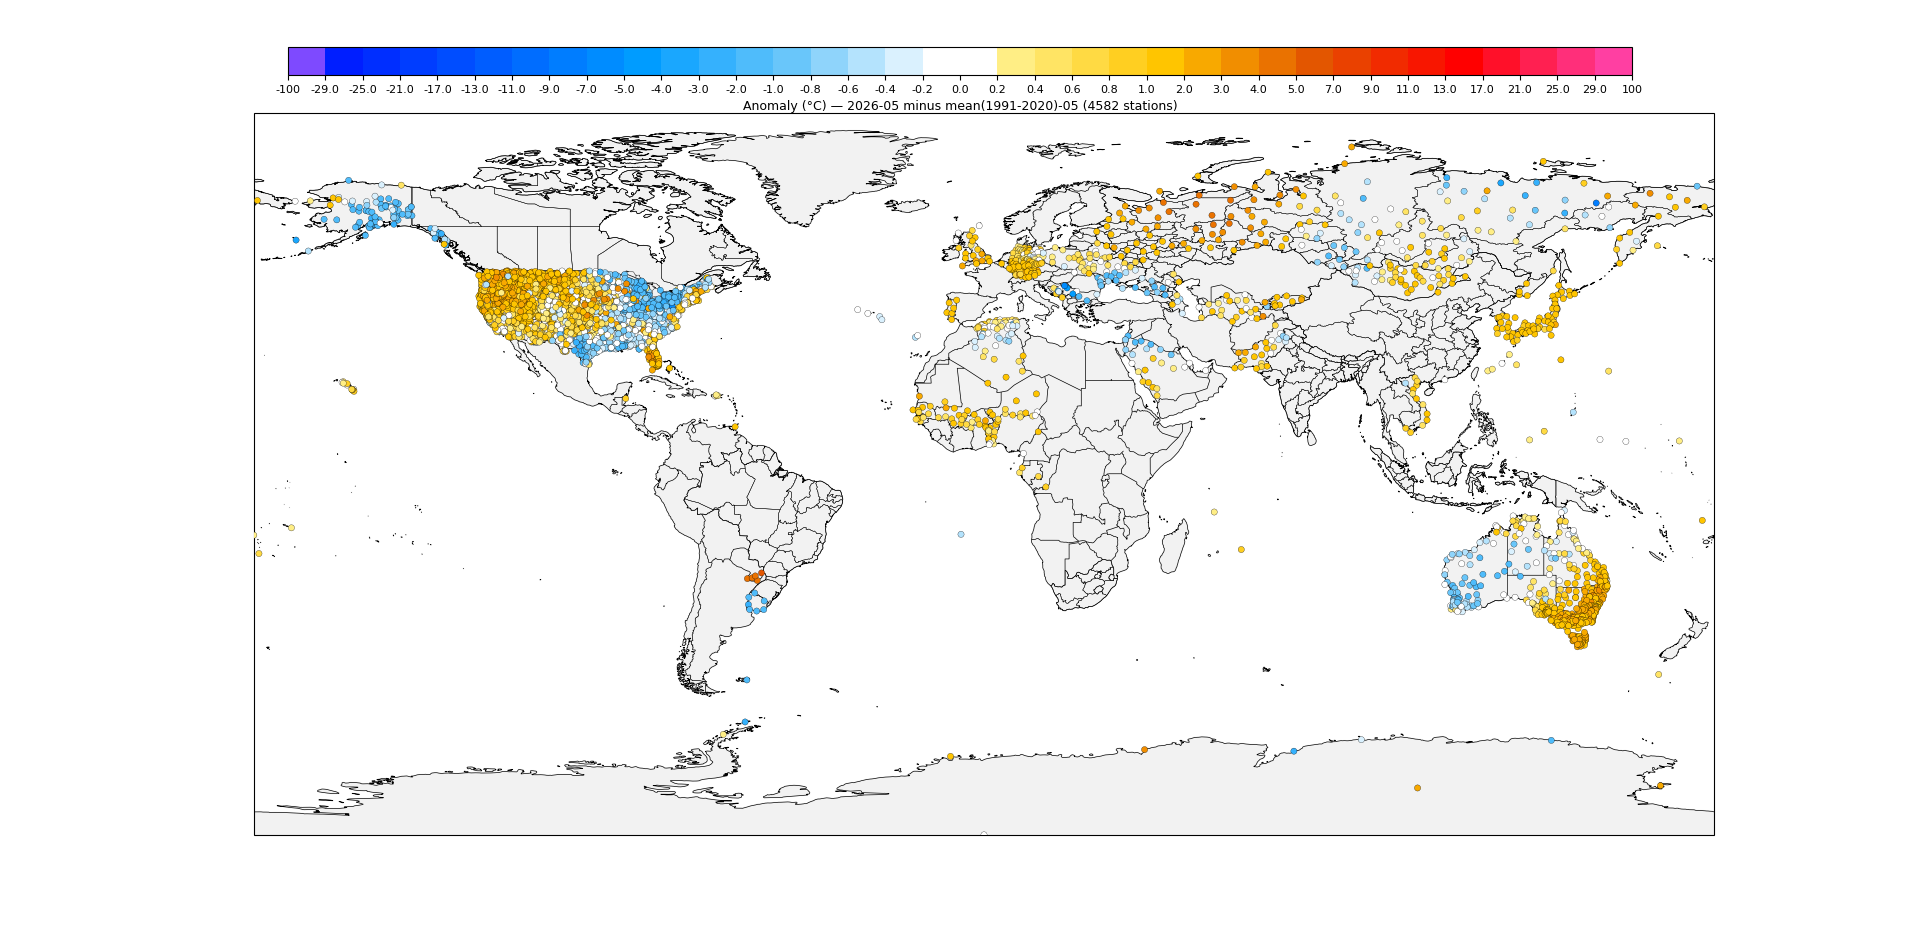
Here is the partial anomaly for May thus far (it will warm up since its missing the last 7 days and its normalized to the month's value, so it will be an underestimate mostly )
The dip in the middle of the month has gotten deeper.
~
Spent some time today working on a couple things:
1) a new ERA5->GISTEMP program that selects from a variety of analog models, with the best selected for each month (with varying start cutoff years from which to choose the best performing model):
local_linear: 4 / 12 months
local_quadratic: 4 / 12 ""
delta_analog: 2 / 12 ""
huber_local: 2 / 12 ""
This provides a better center prediction than the old ERA5->GISTEMP model. I'm not sure if it's better than the other delta analog I came up with for post mid-month that uses gridded data -- I will have to check the variance when we get the data.
2) After this I reworked the variance estimation from the forecast prediction using the past recorded forecast errors I have collected (not using a hindcast method; so it's historical/empirical) to provide much more plausible variances (before it was far underconfident far out and I had to judge subjectively).
3) Combining these with the recent (hindcast) forecast errors from (1) I have a new pipeline (it seems sane and it passed several diagnostics):
Point estimate adjusted by prediction error mean (unadjusted by own past forecast errors): 1.1428
Point estimate adjusted by prediction error mean (adjusted by own past forecast errors): 1.1731
End of month type (no forecast error variance)
Std. dev.: 0.0363
Bin Probability (%)
<1.095 1.6
1.095-1.145 20.4
1.145-1.195 50.7
1.195-1.245 24.9
1.245-1.295 2.3
>1.295 0.0
With empirical forecast error variance:
(ERA5->GISTEMP model variance, forecast predictive variance): 0.0013, 0.0014
Total predictive variance: 0.0027
Total predictive std: 0.0520
Std. dev.: 0.0520
Bin Probability (%)
<1.095 6.7
1.095-1.145 22.8
1.145-1.195 36.8
1.195-1.245 25.3
1.245-1.295 7.4
>1.295 1.0
I've shifted my bets from now on to this new adjusted foreast for now.
New ECMWF upgrade (r50) rolled out today (although I think perhaps from the 06Z run than the 00Z run which I waited for), so there might be some larger jumps tomorrow when I update)..
Values for end of month continue to slightly drop...
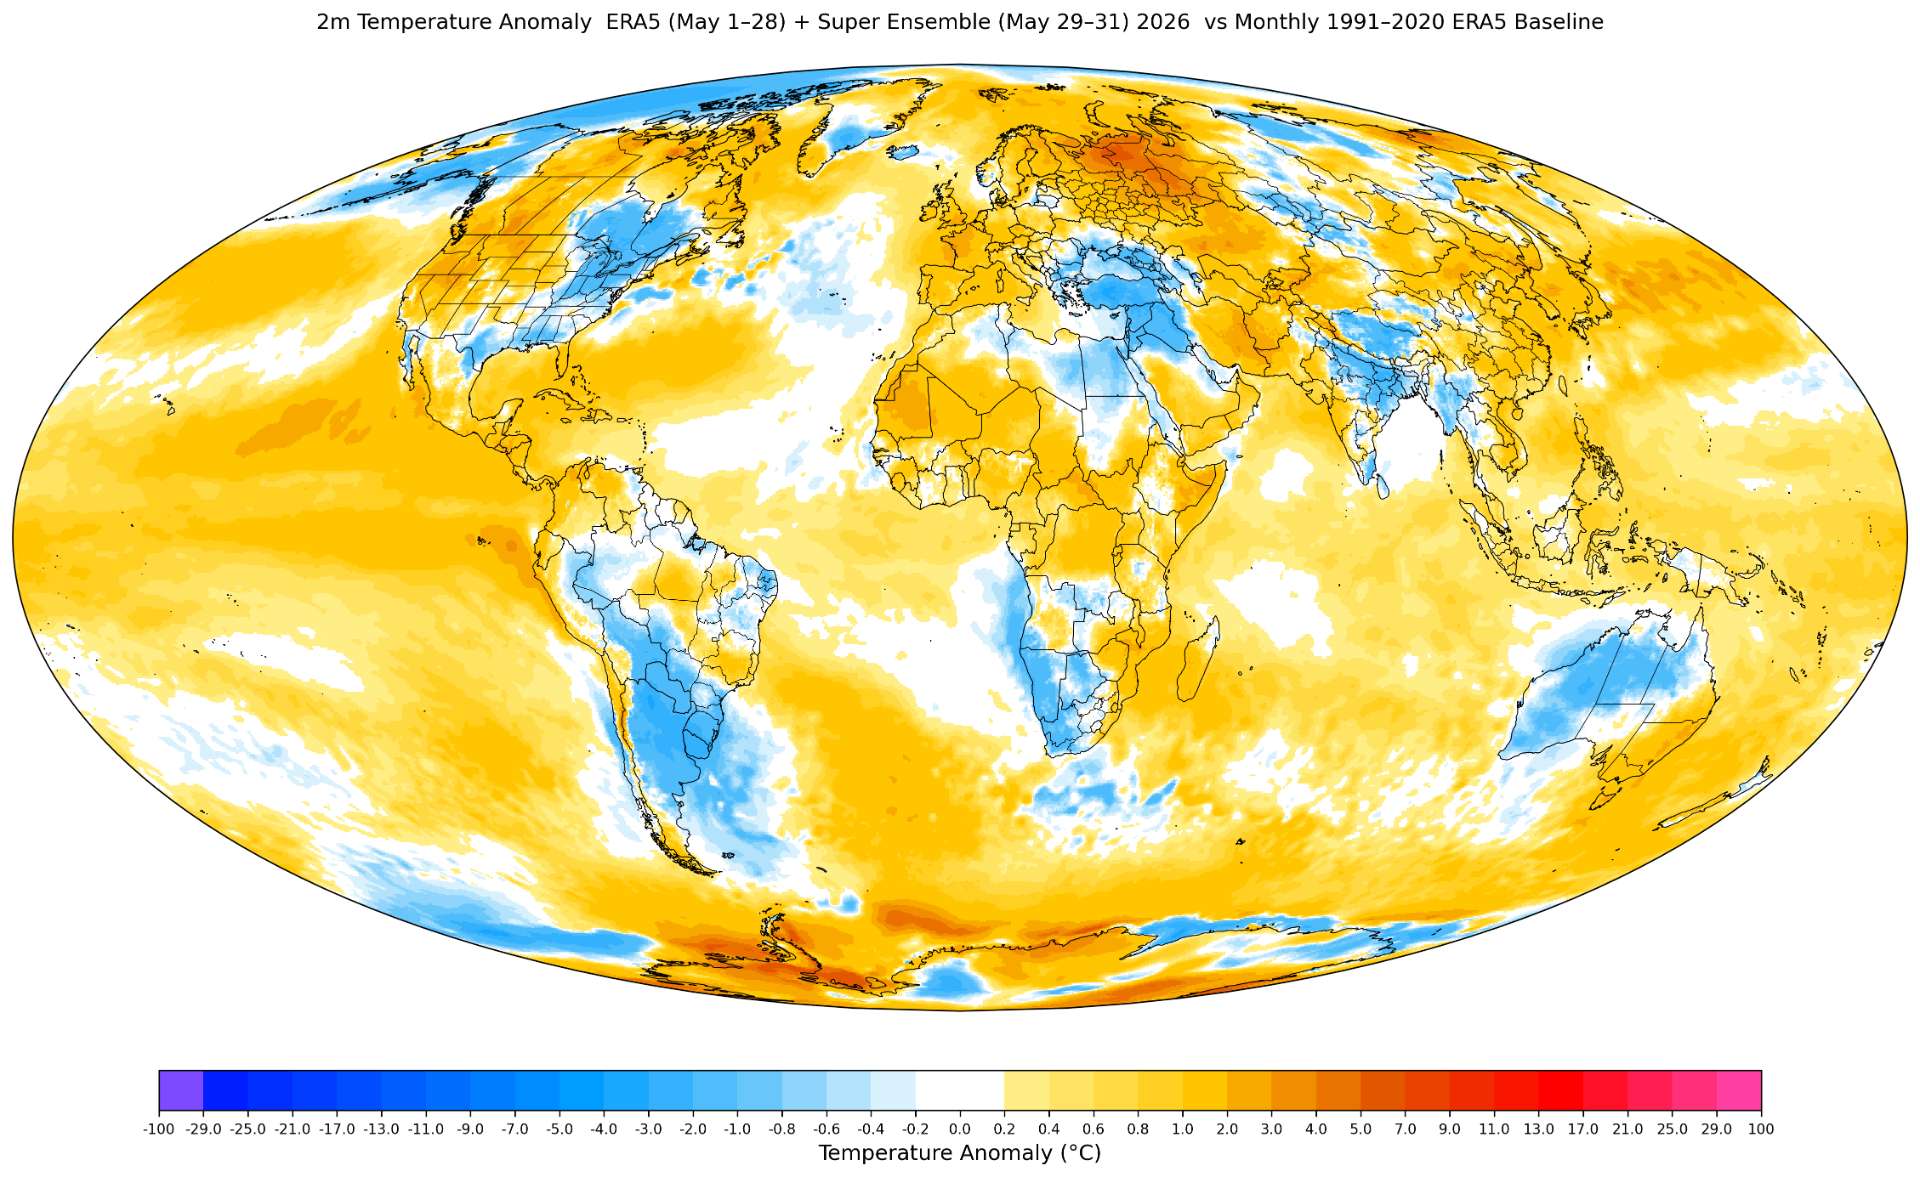
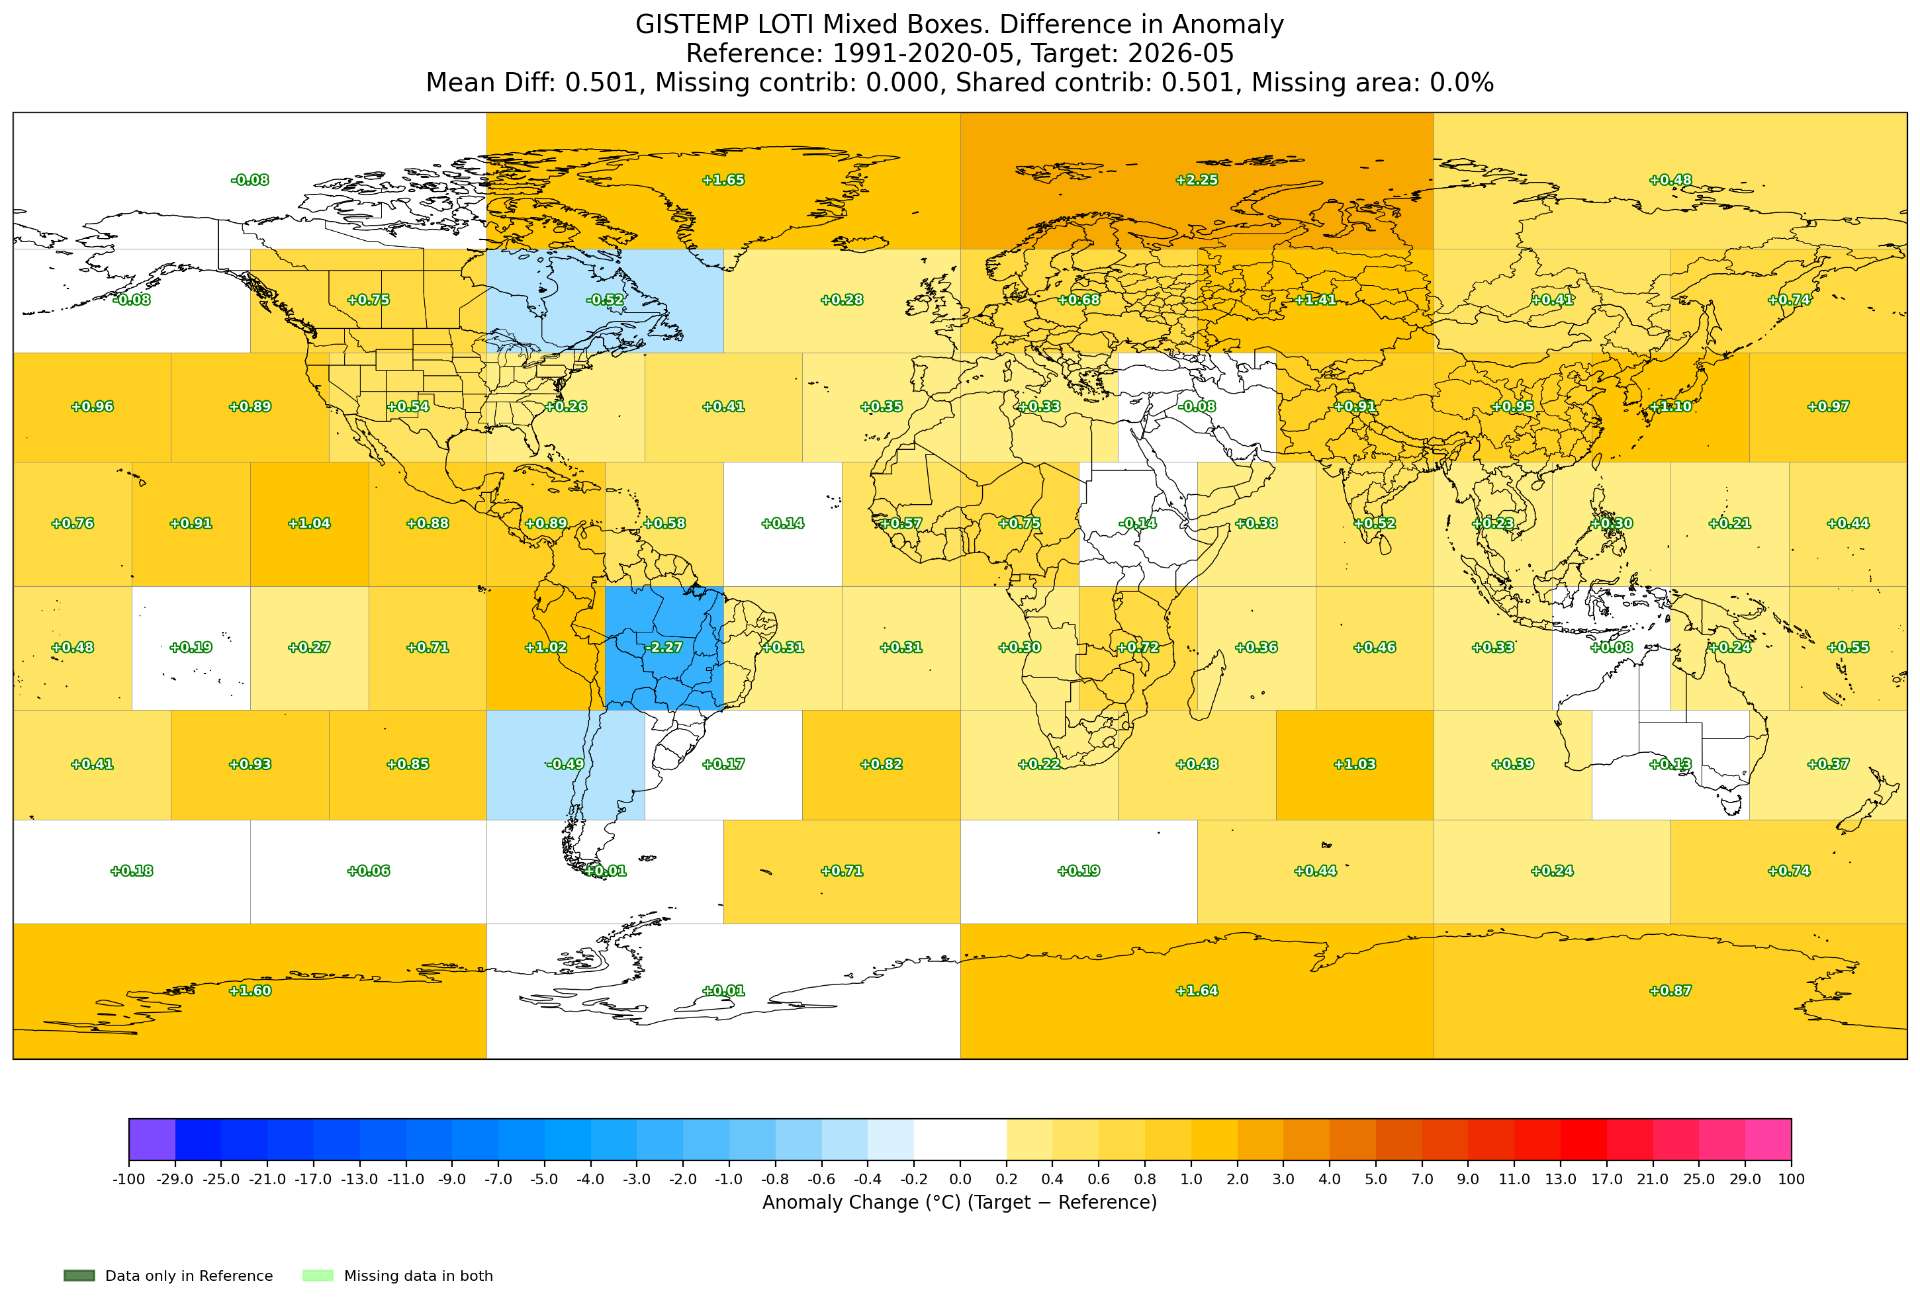
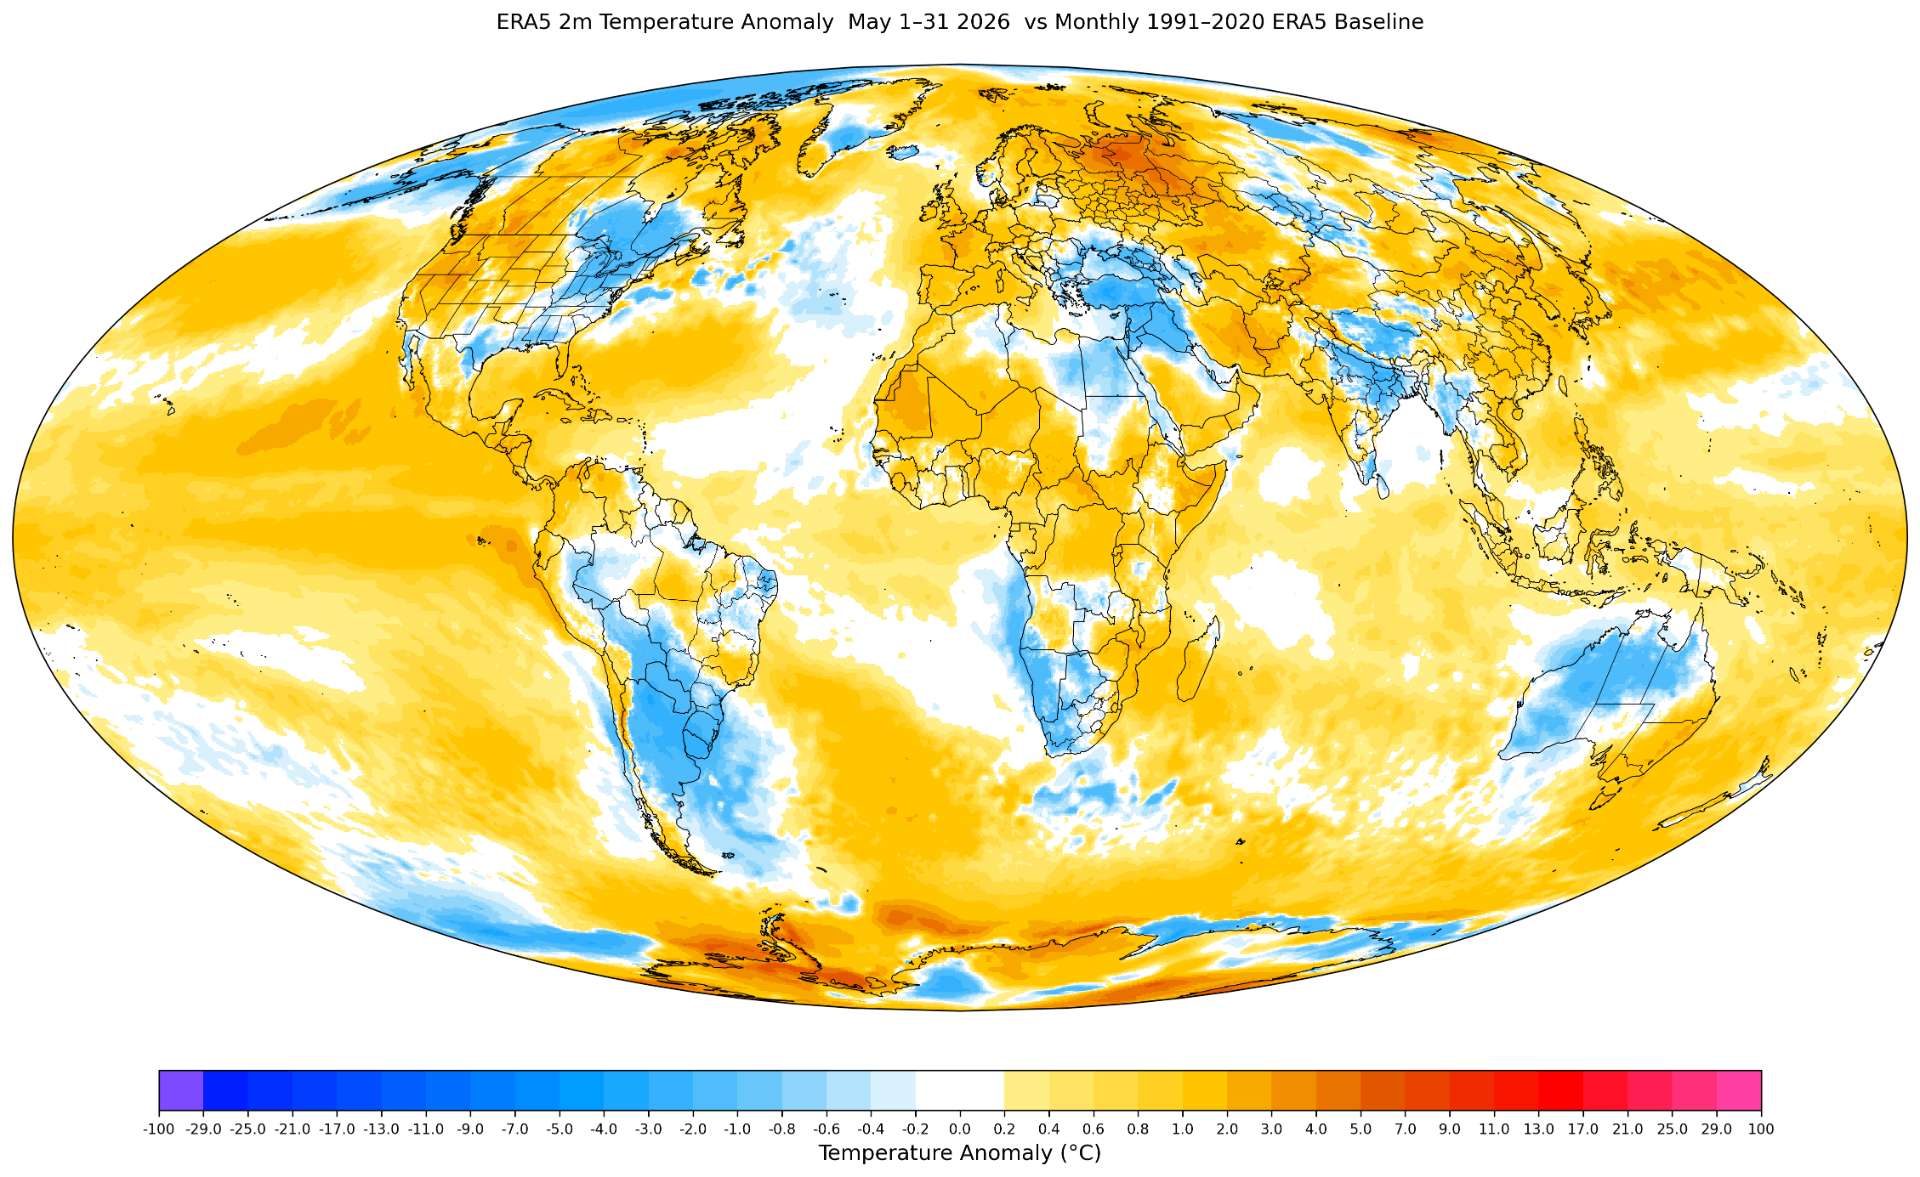
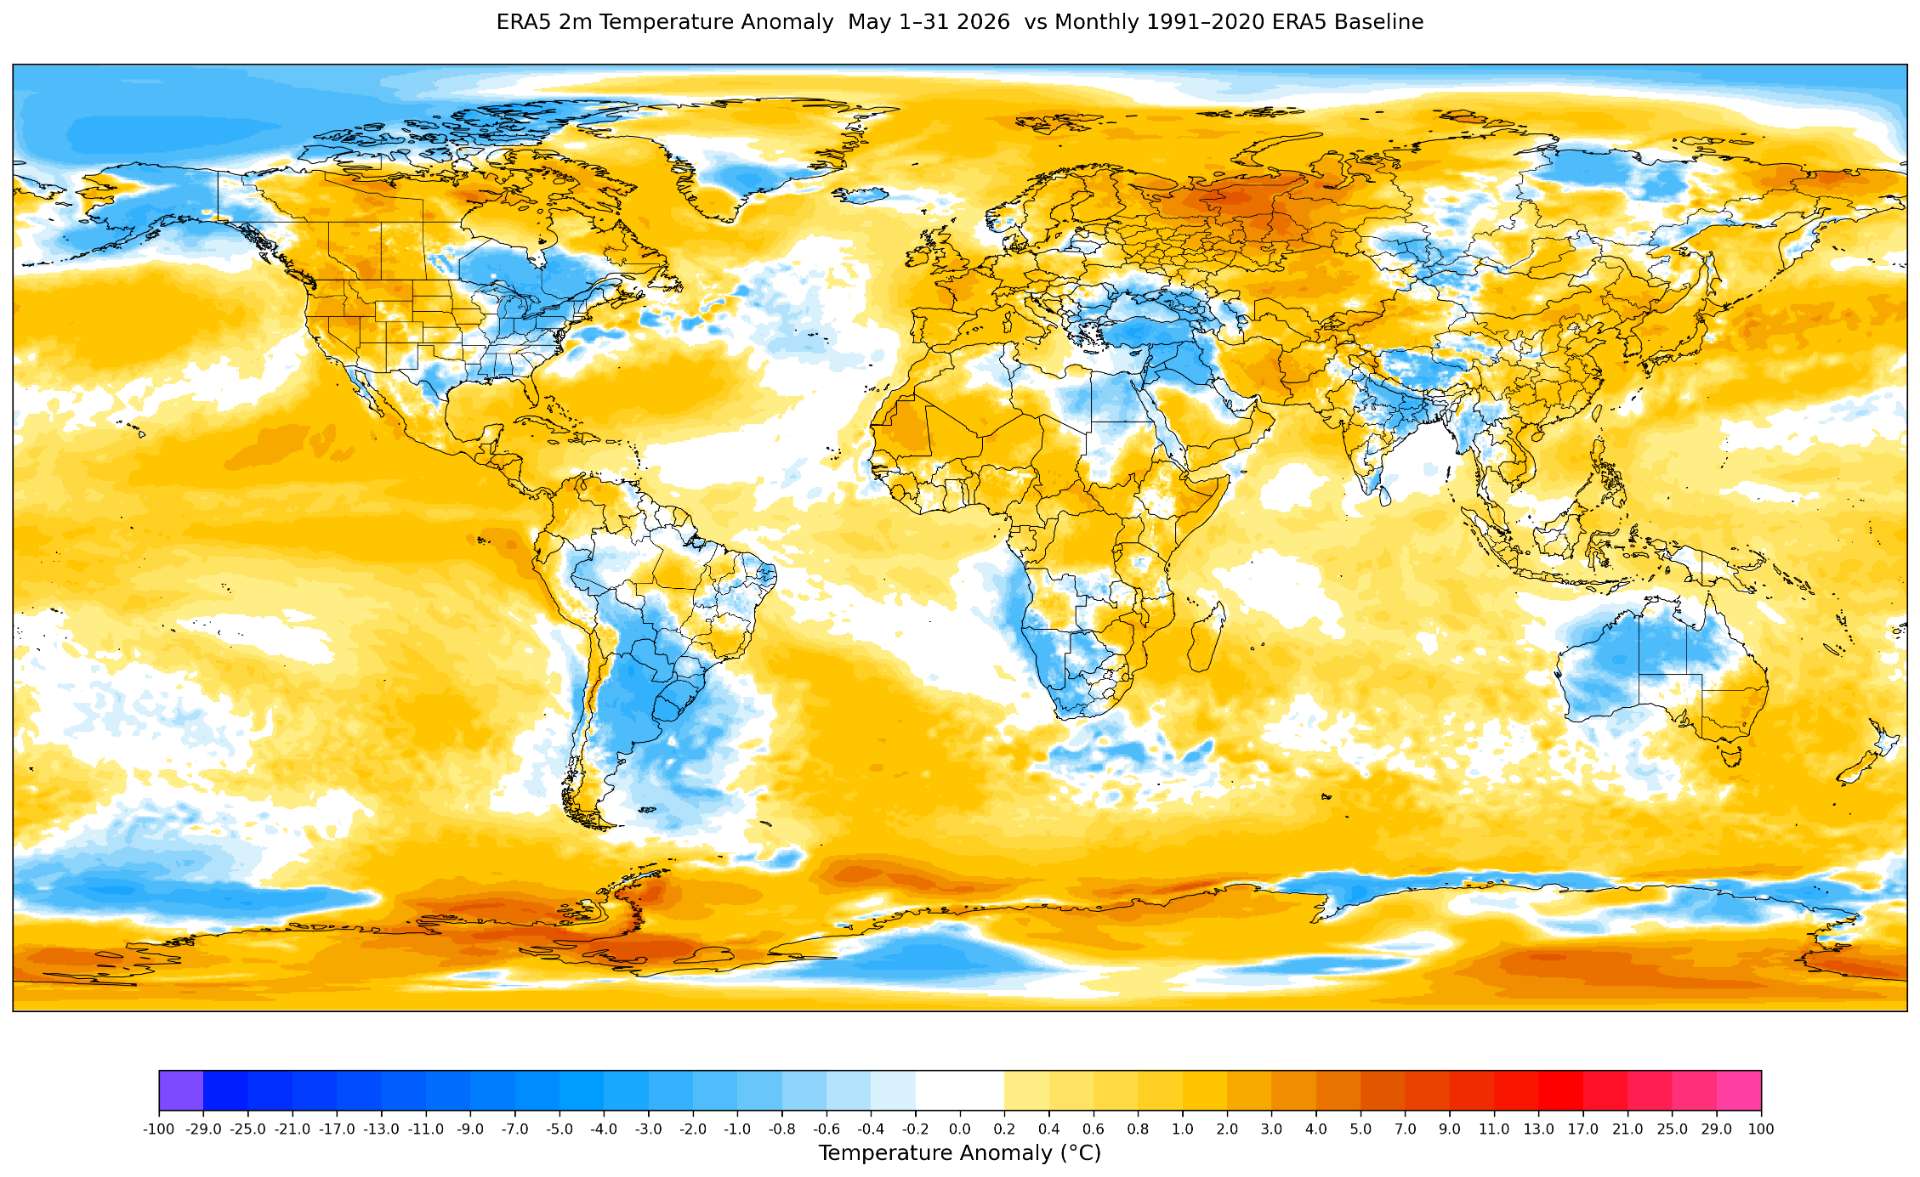
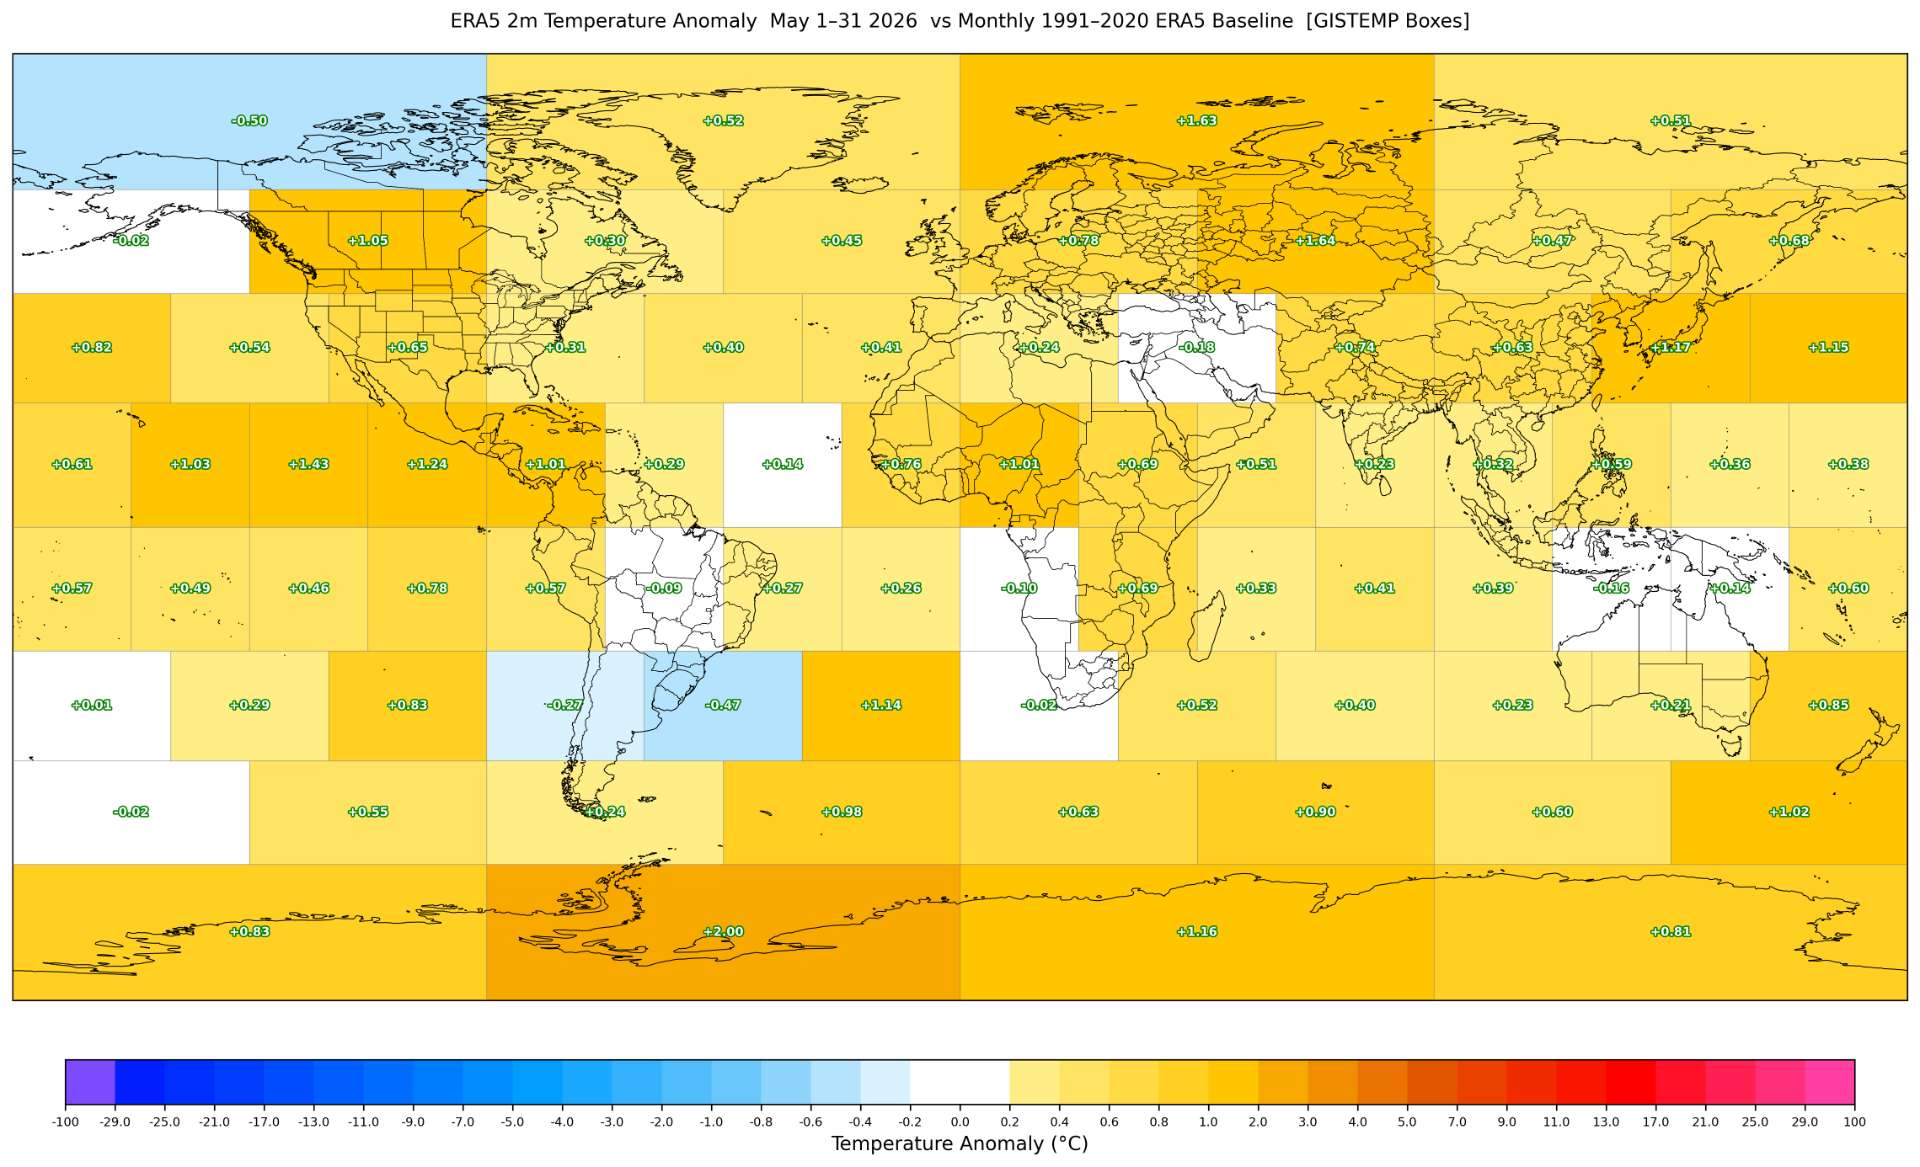
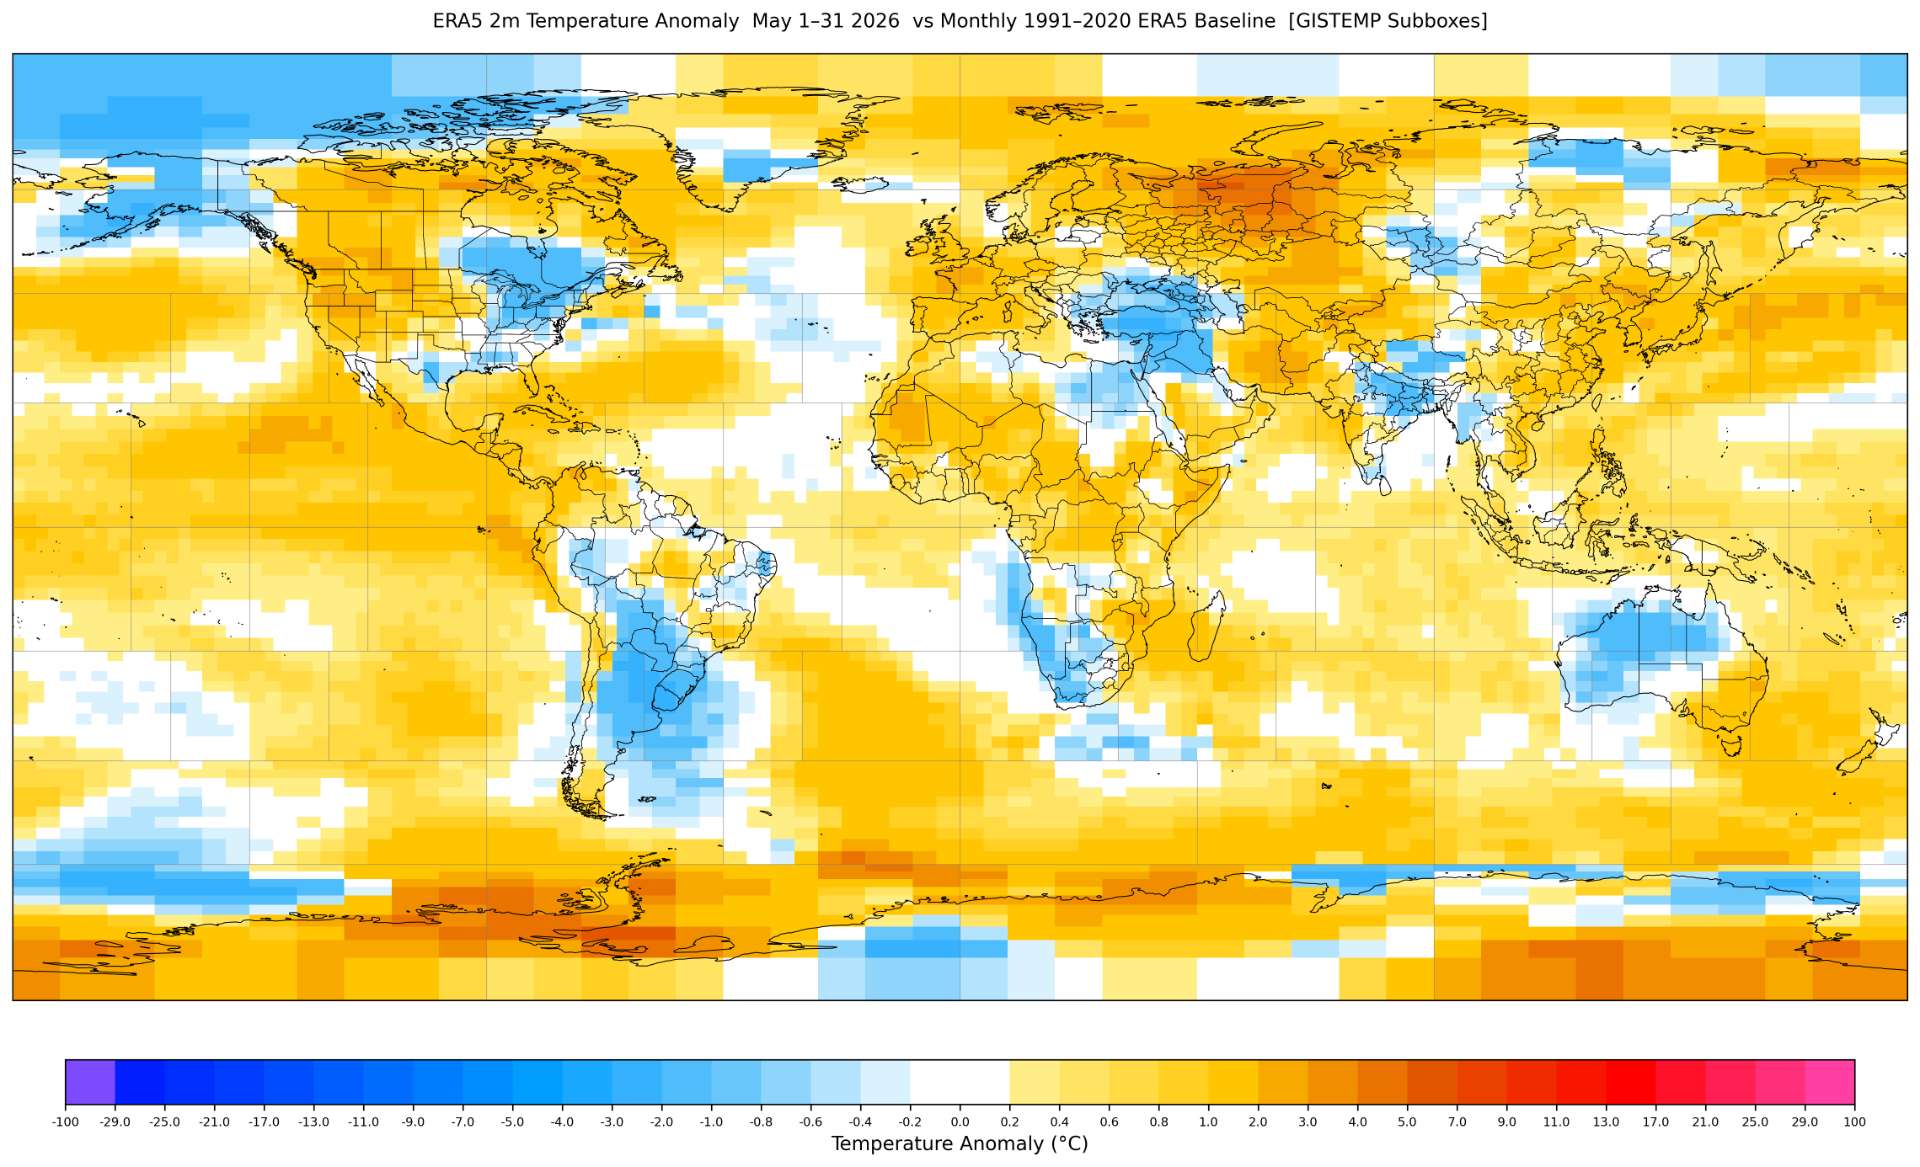
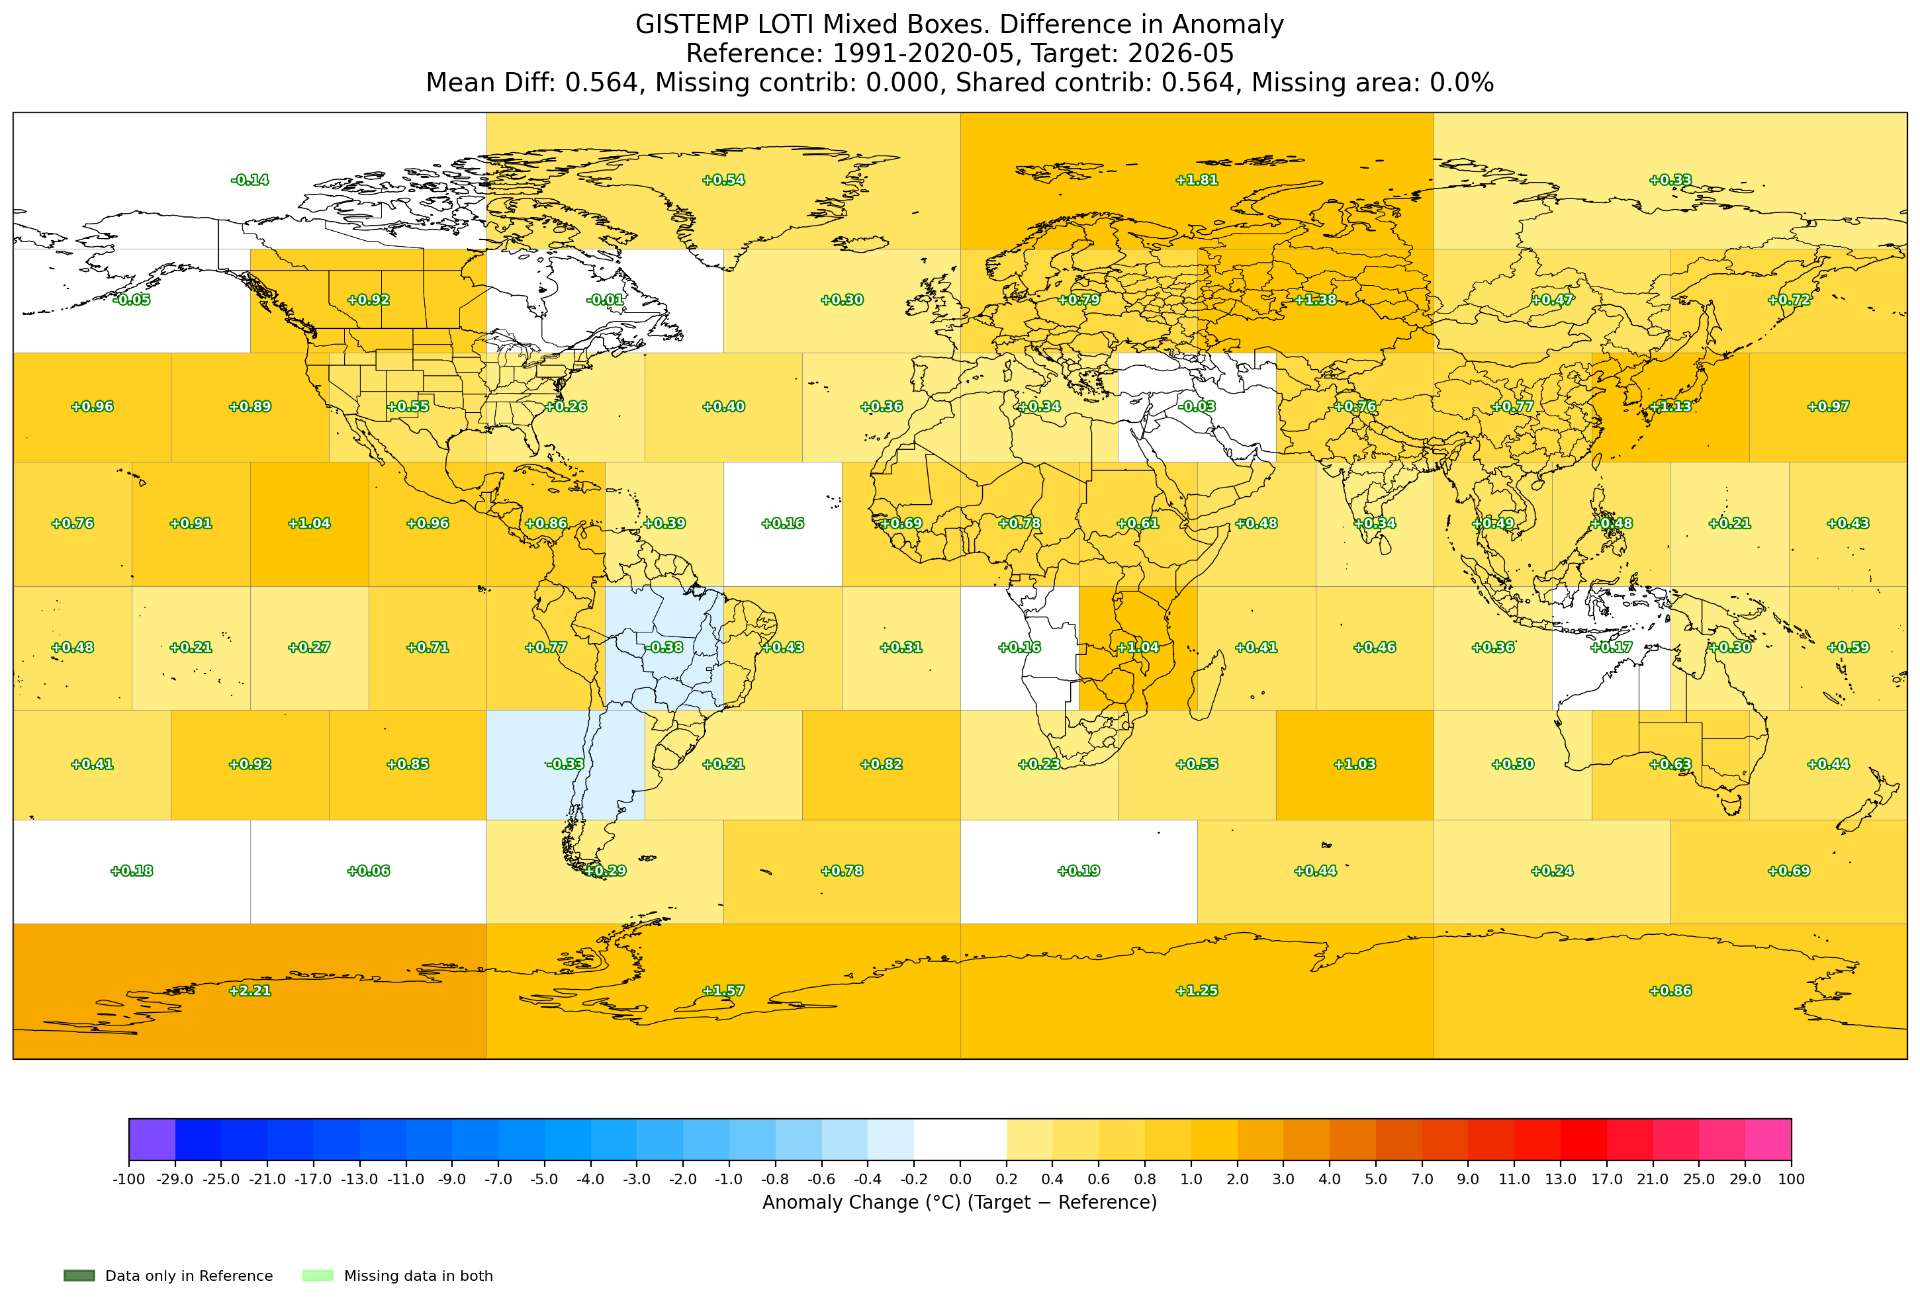
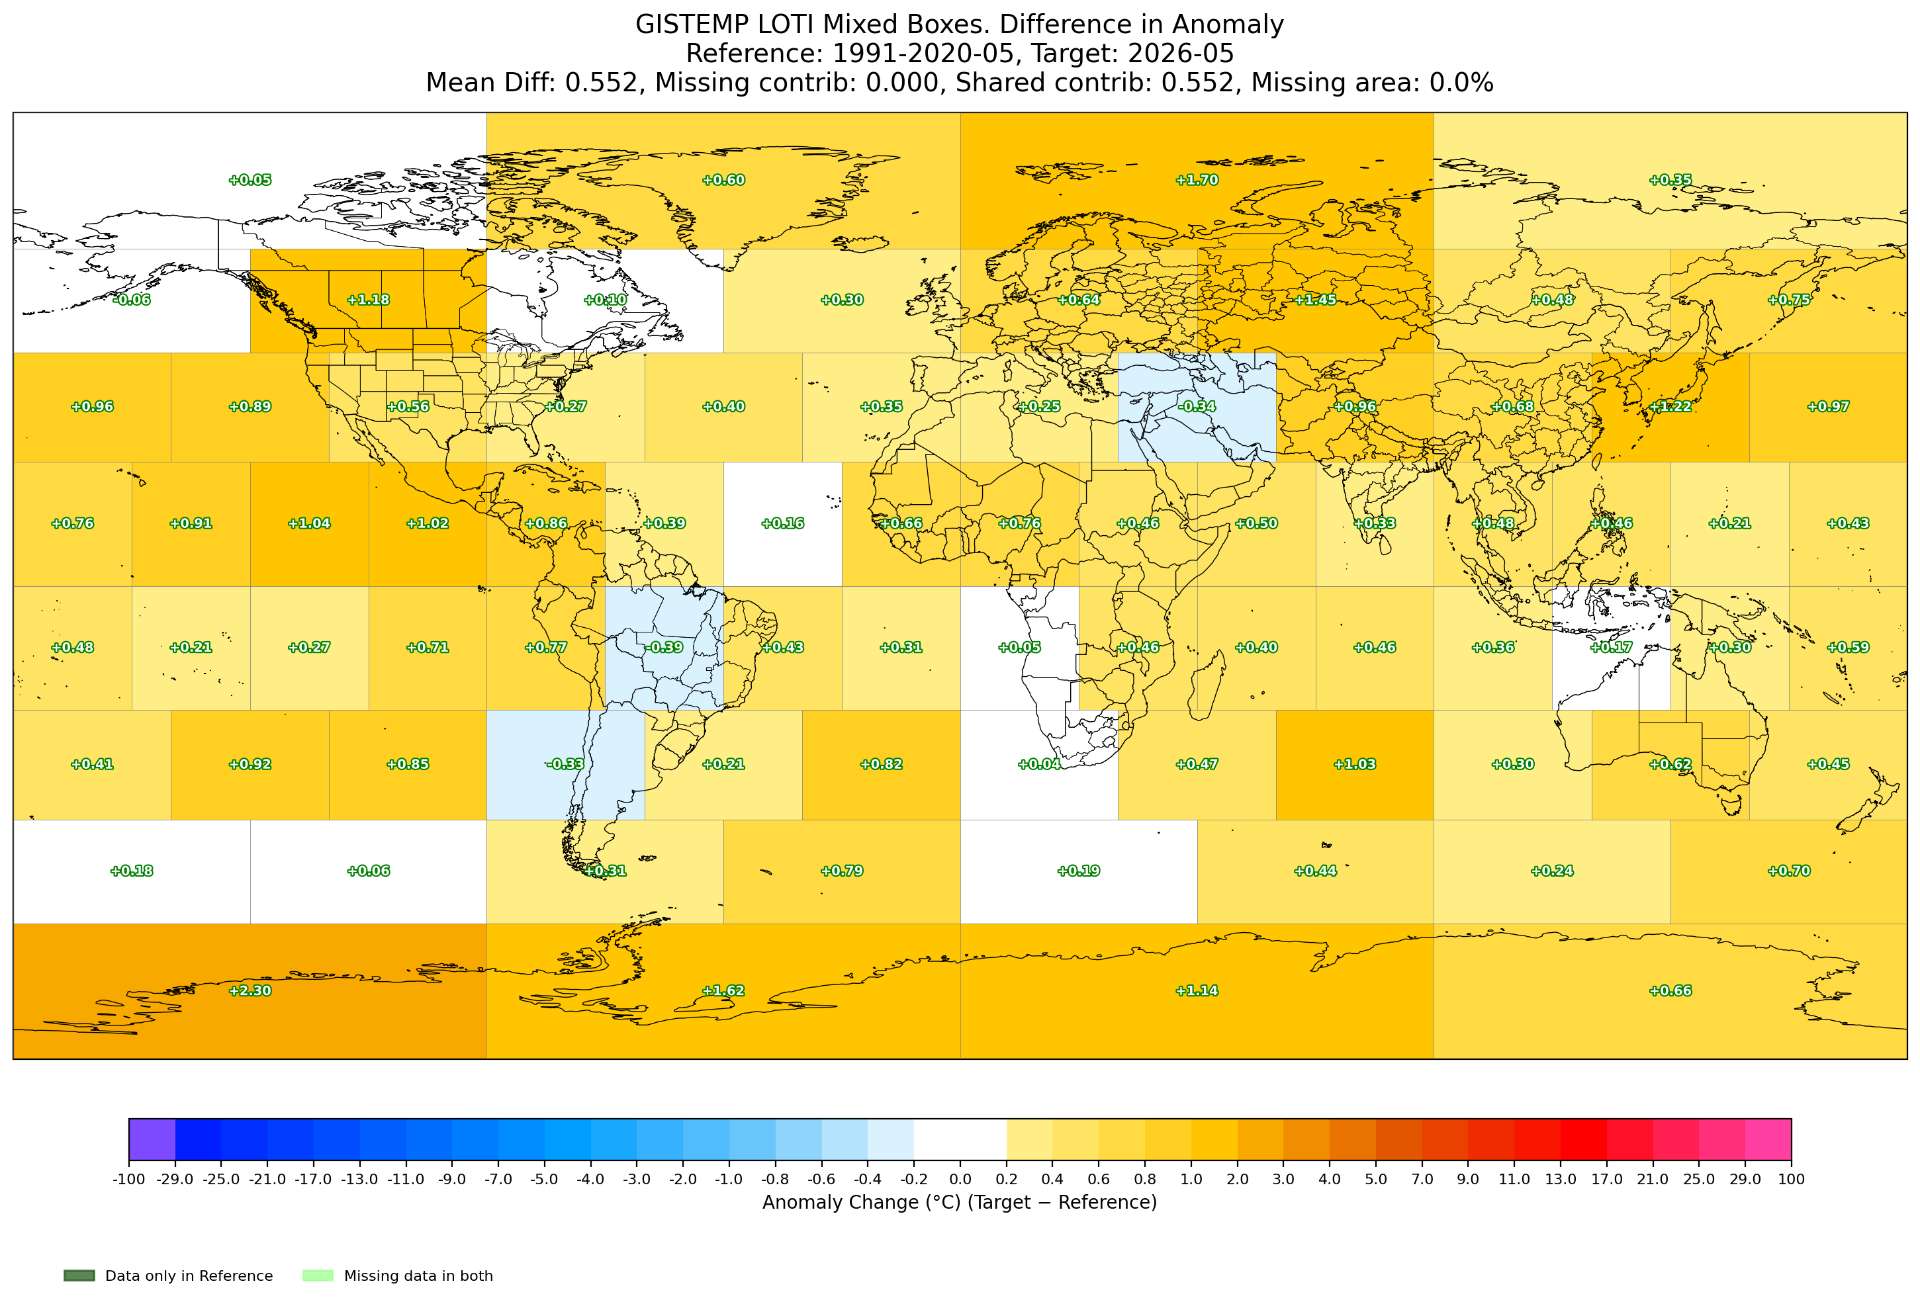
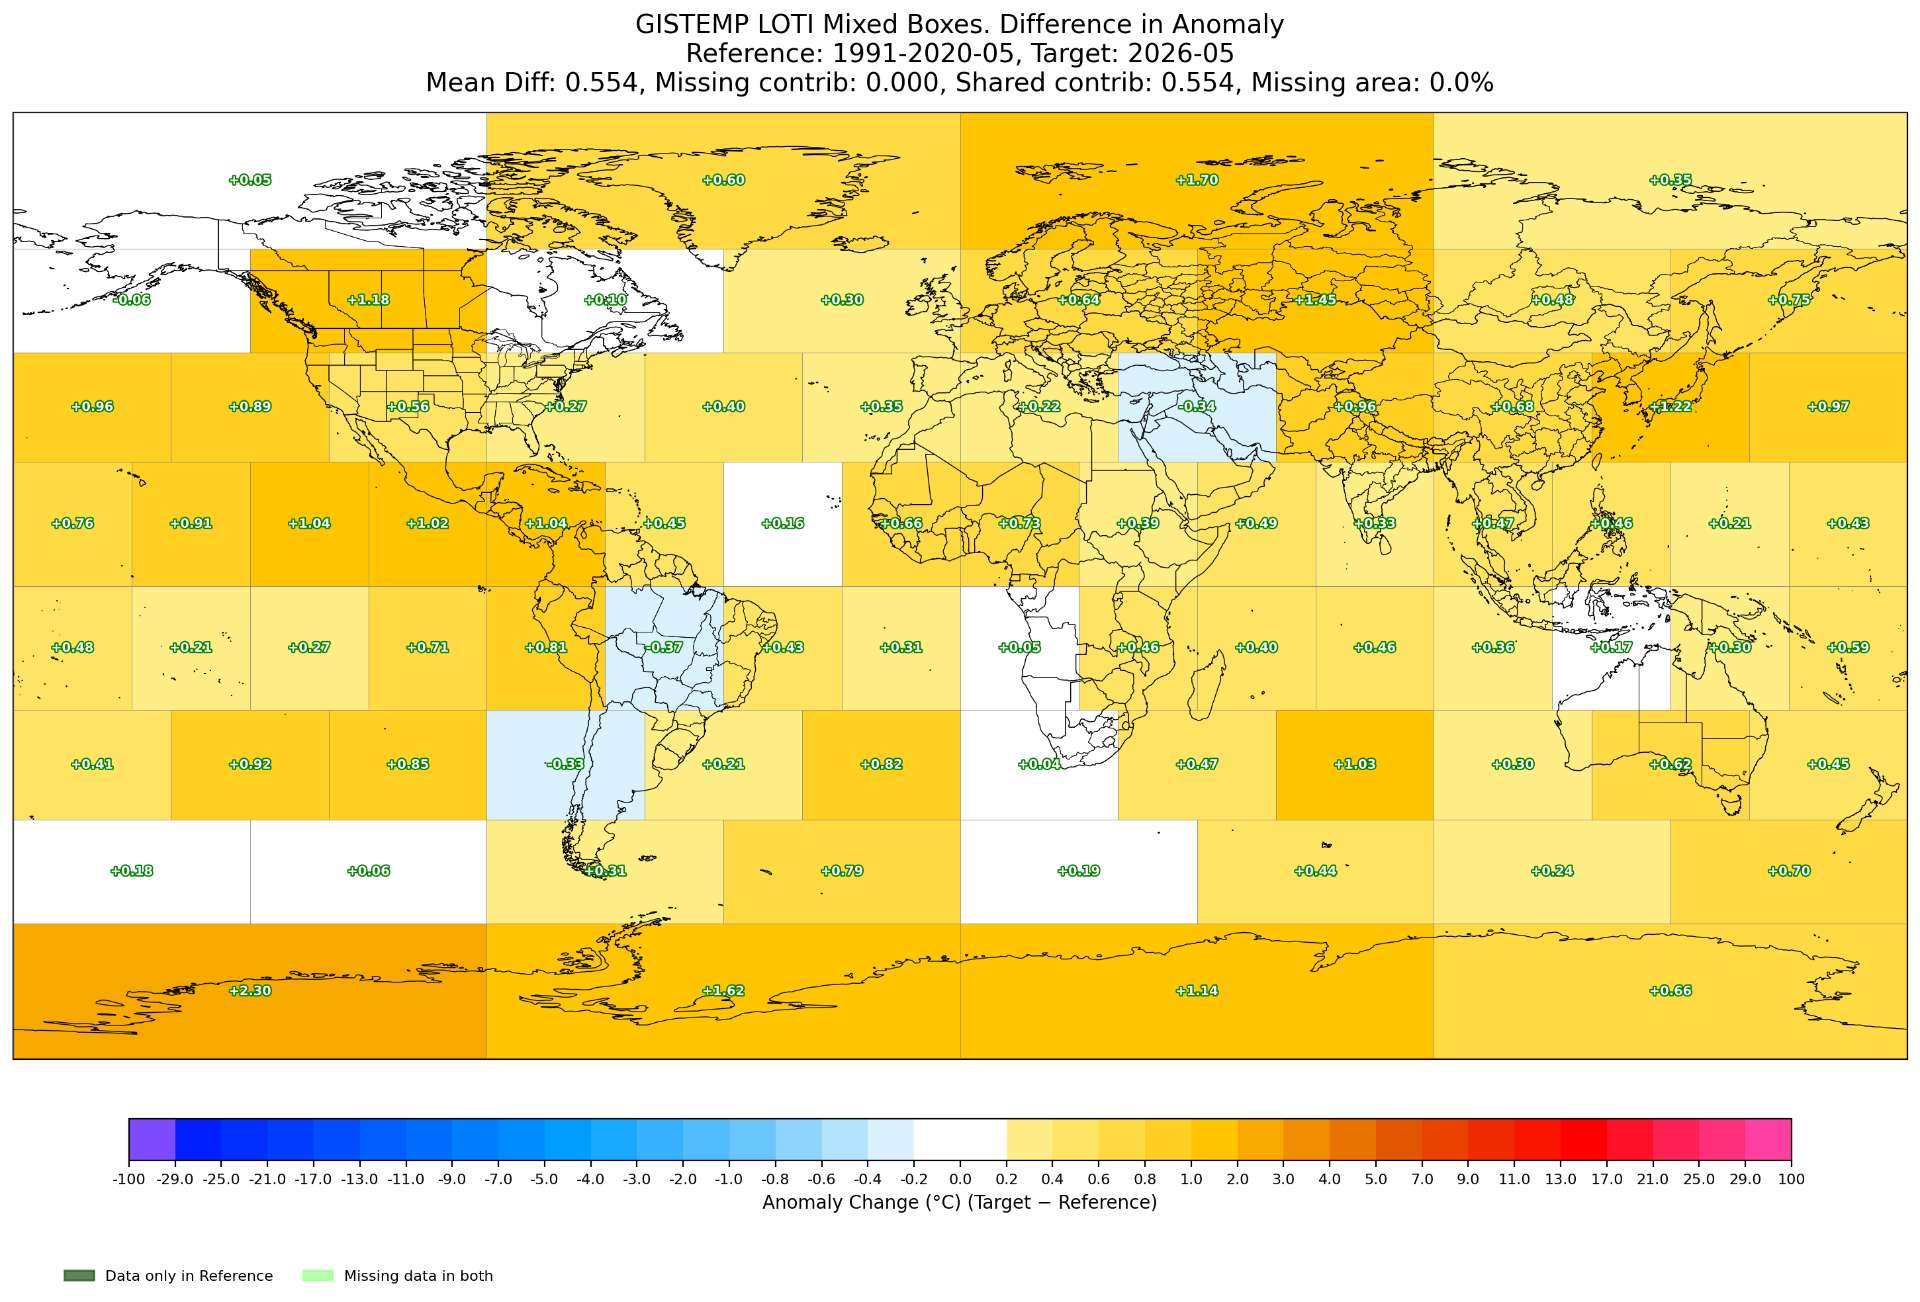
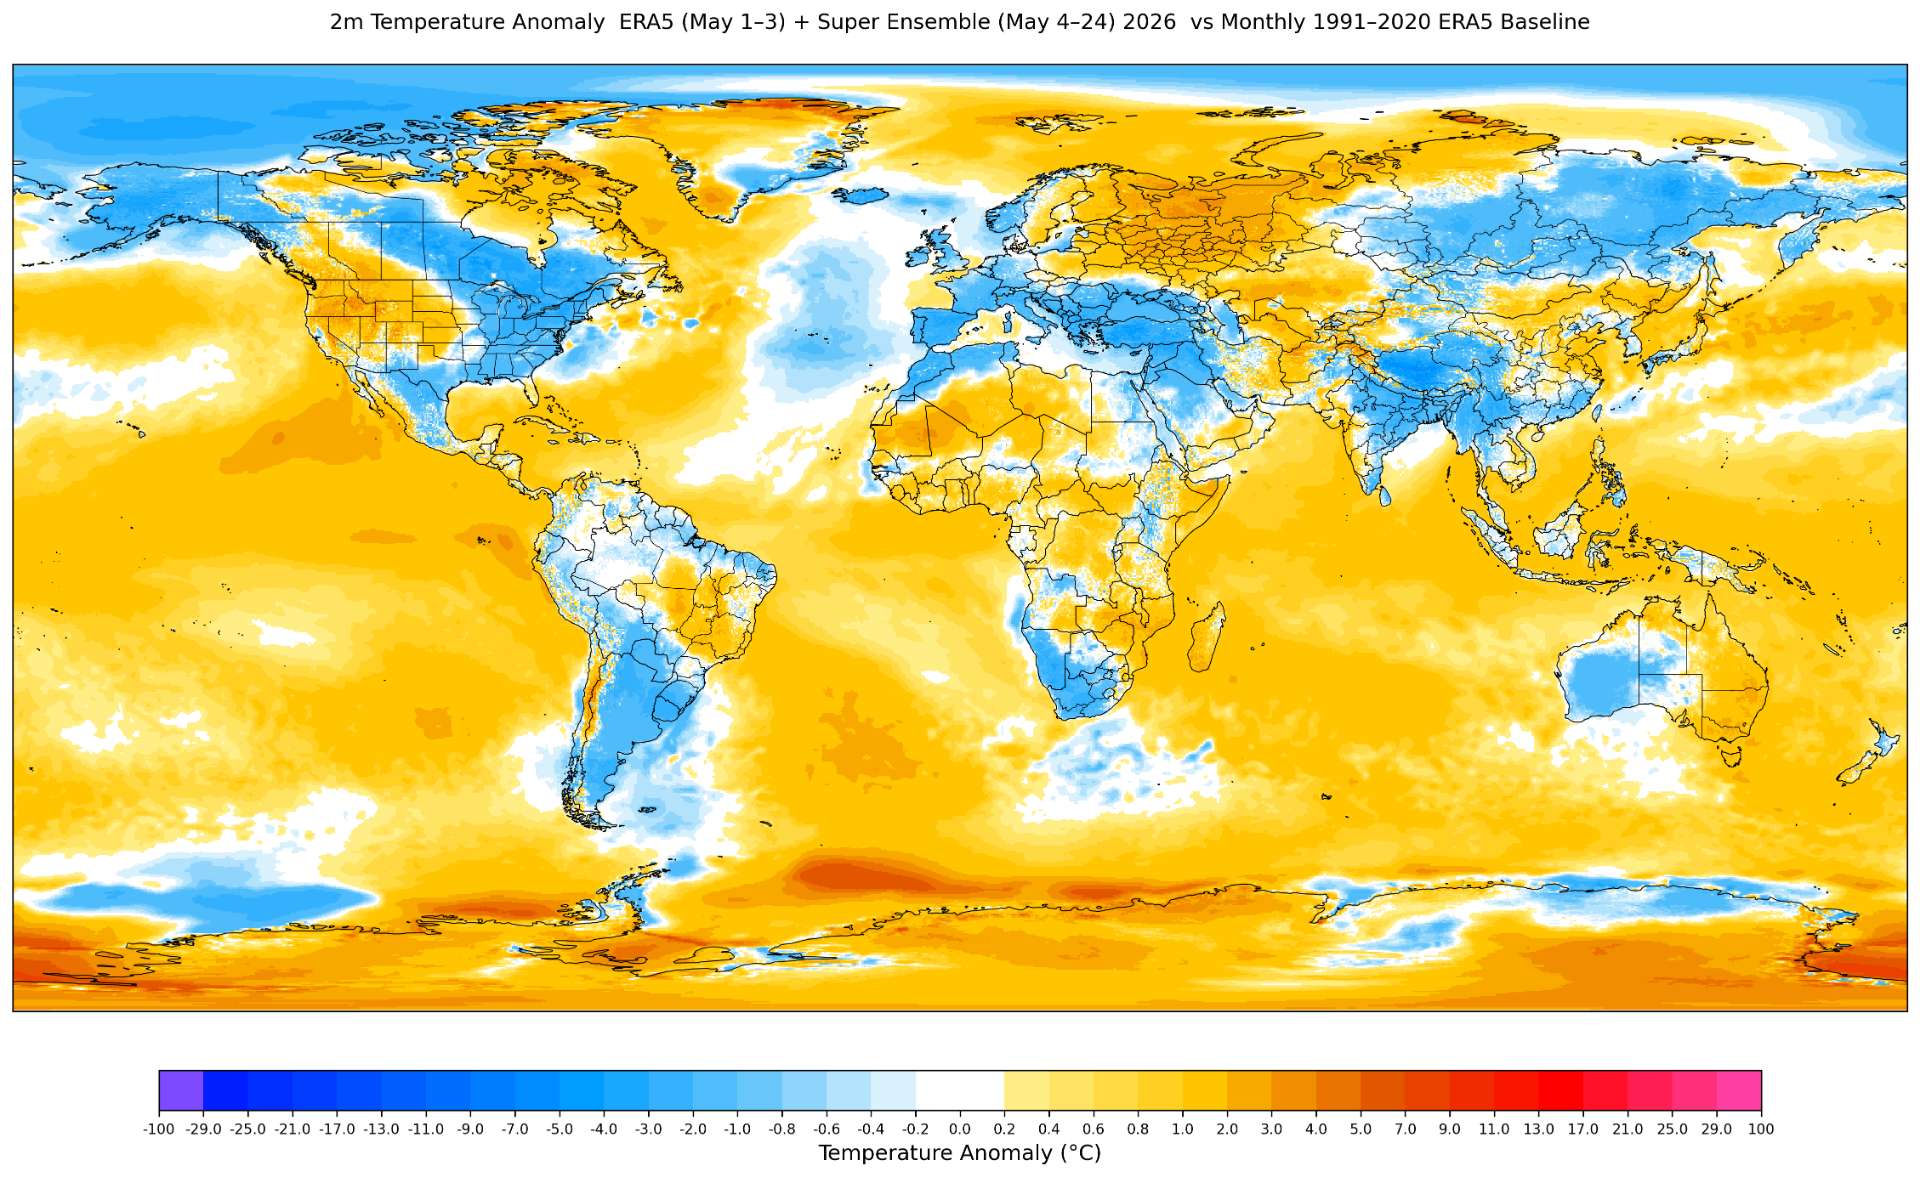
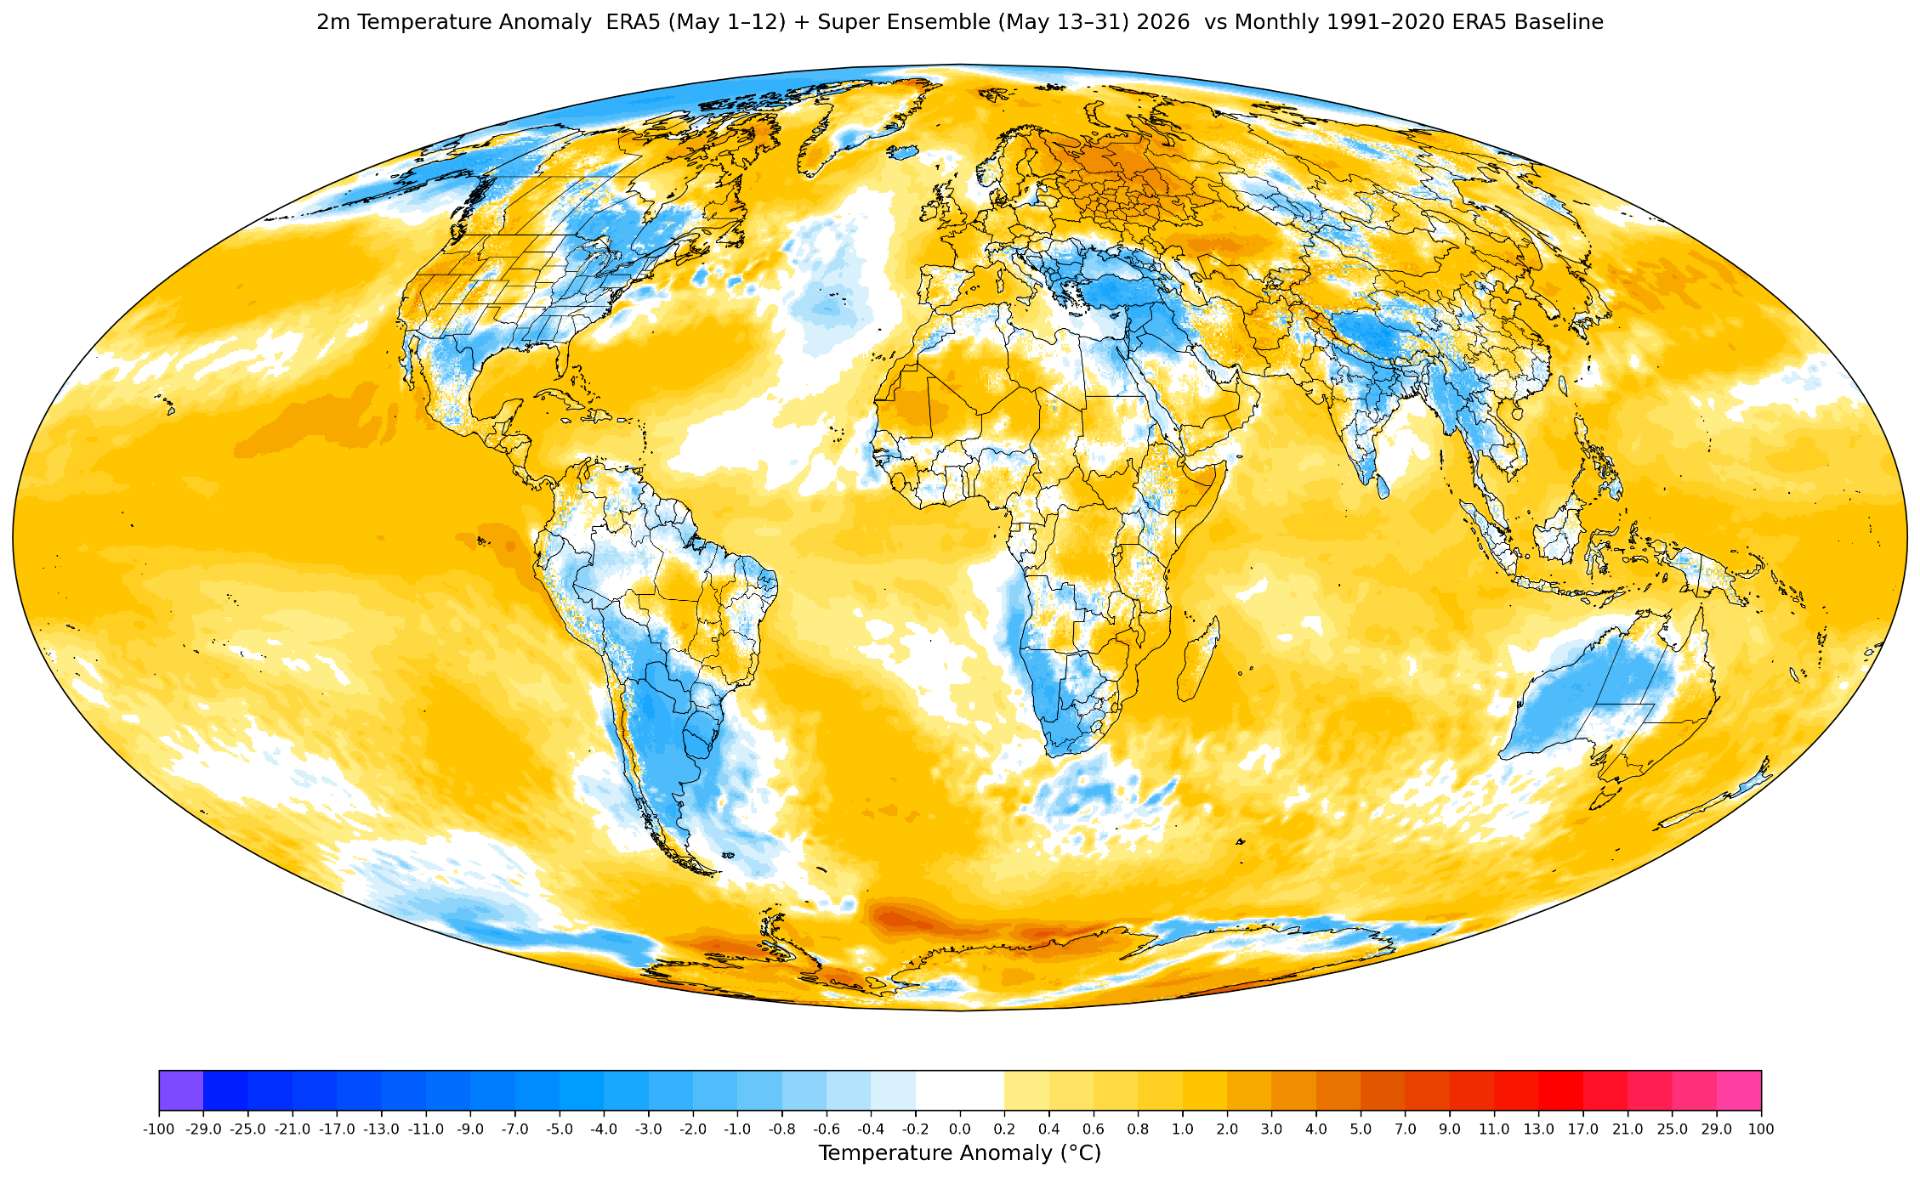
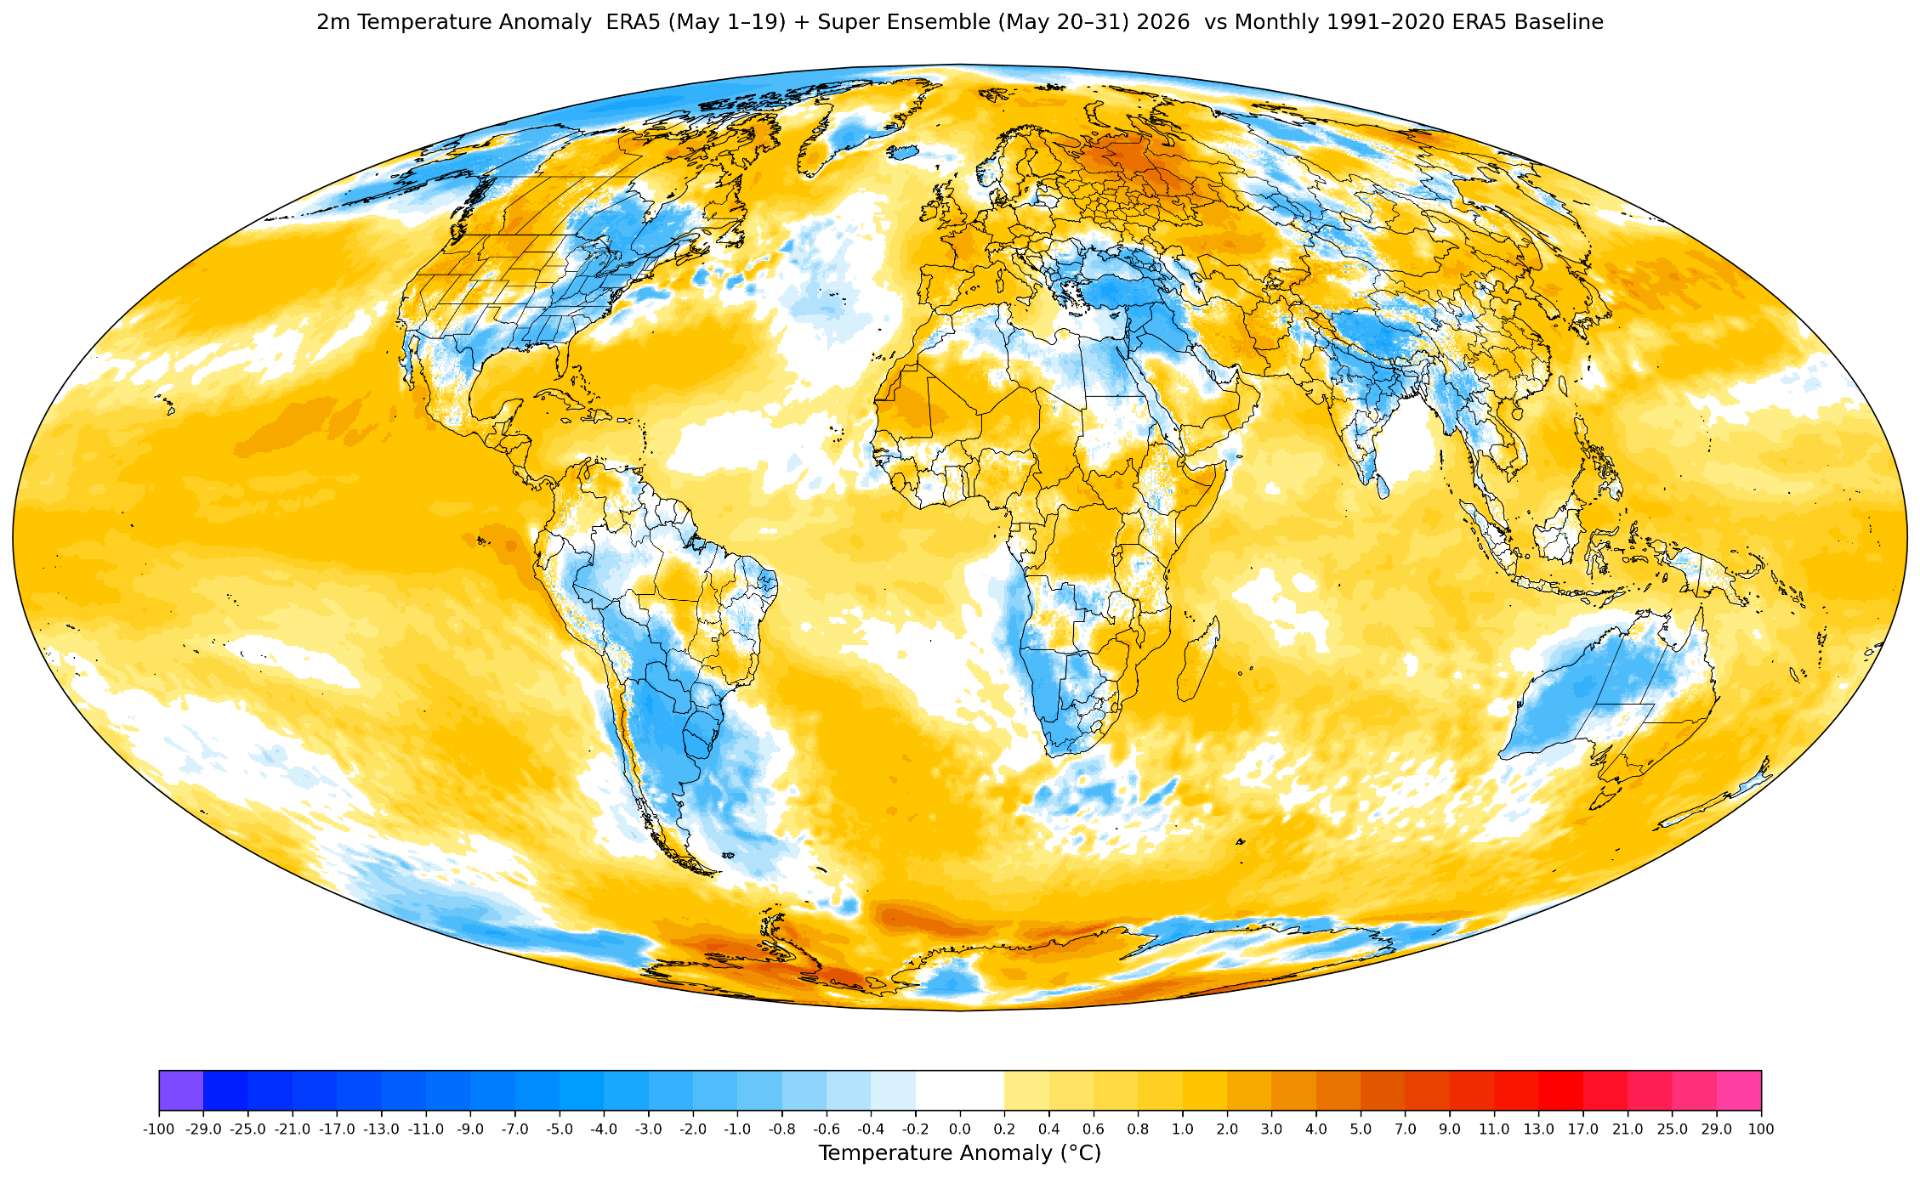
My best estimate of what spatially the current outlook looks like for the month (the end of the month is still smoothed quite a bit spatially by the super ensemble, and it could change in a few days, but for the moment there doesn't appear there will be any obvious localized extreme anomalies for the month as a whole):
Now have 3 different estimate methods to combine (I.e. the old one I used last year, delta method useful for only latter half of month, and the more recent analogs method), adjusted by recent residuals yields the three center point predictions (with the analogs method having the best performance): 1.1314, 1.1699 1.1202
Weighting them I get a center point prediction of 1.1341 C currently.
As I currently have an oversized position in the 1.15-1.20 bin relative to the 1.10-1.15 bin, I haven't updated too strongly in those bins, but I'll try to remember from today to start putting a relatively large buy limit order for 1.10-1.15 at my probability estimate for it.
(For the moment I only think the lowest bin and the top two bins are about the right probability at the moment).
Placed a buy order for 1400 mana @ 40% for 1.10-1.15 in case anyone wants to sell some mana for immediate profit (my best probability estimate at the moment for that bin anyway).
Bots are driving me nuts as I have an even more asymmetric position now.
Not much changed since yesterday, with only a marginal nudge downwards, as I get a 1.1314 C center point prediction from weighting the three predictors as mentioned above (after all adjustments).
My last predictor that was in the 1.15-1.20 bin finally dropped a bit with the latest update into the lower bin so now all three are in the 1.10-1.15 bin. This puts the point prediction after all adjustments at ~ 1.11C
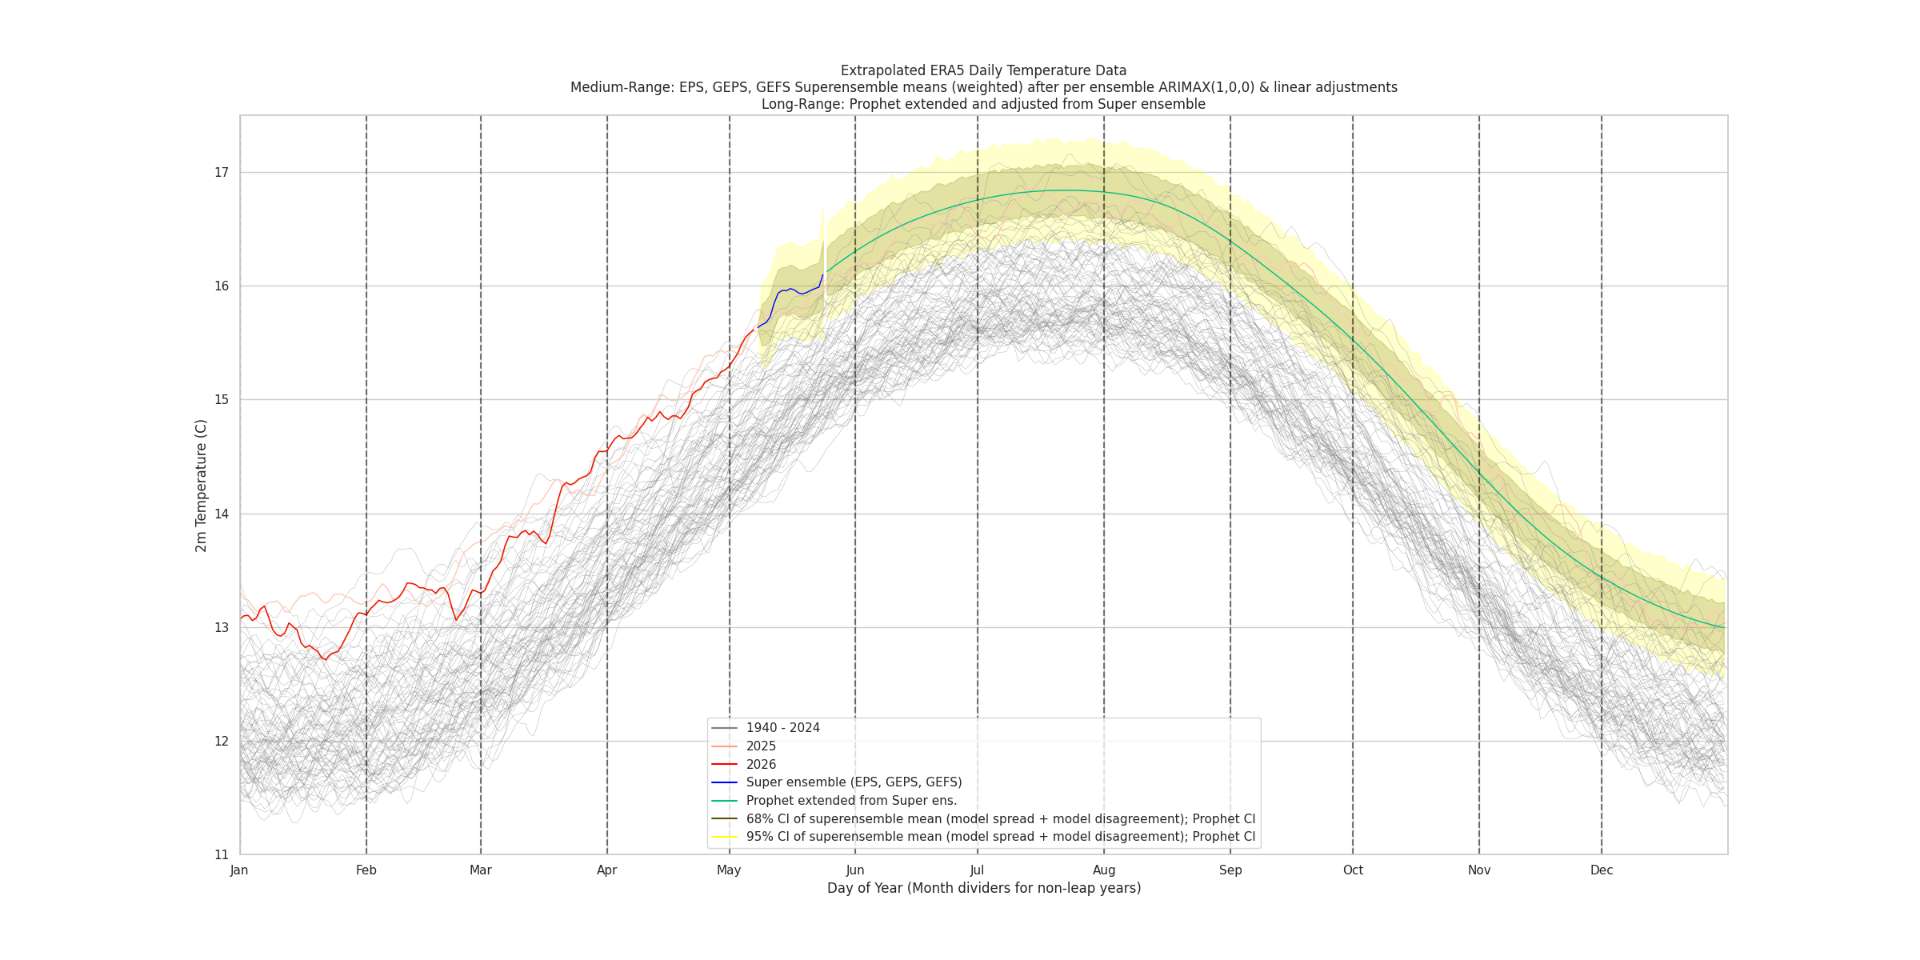
I've added a new version of the old diagnostic plot of the below (which uses the uncalibrated (model spread + model disagreement) variance. The old one:
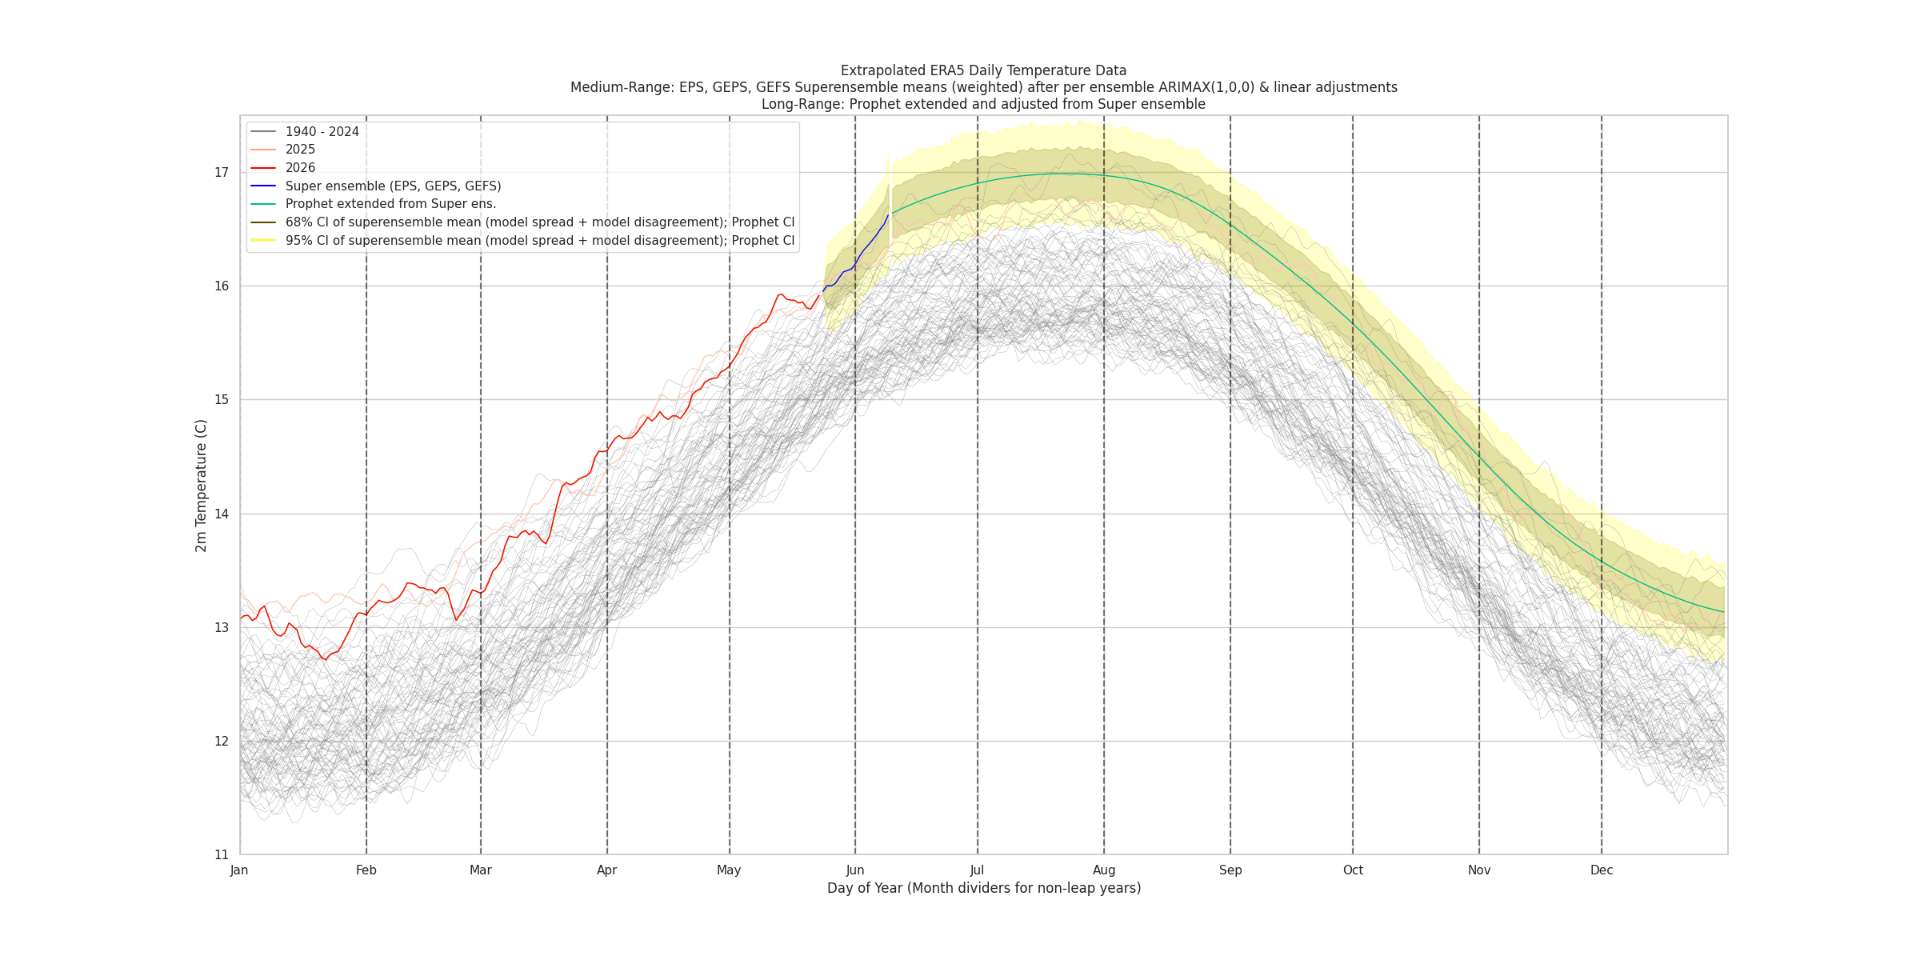
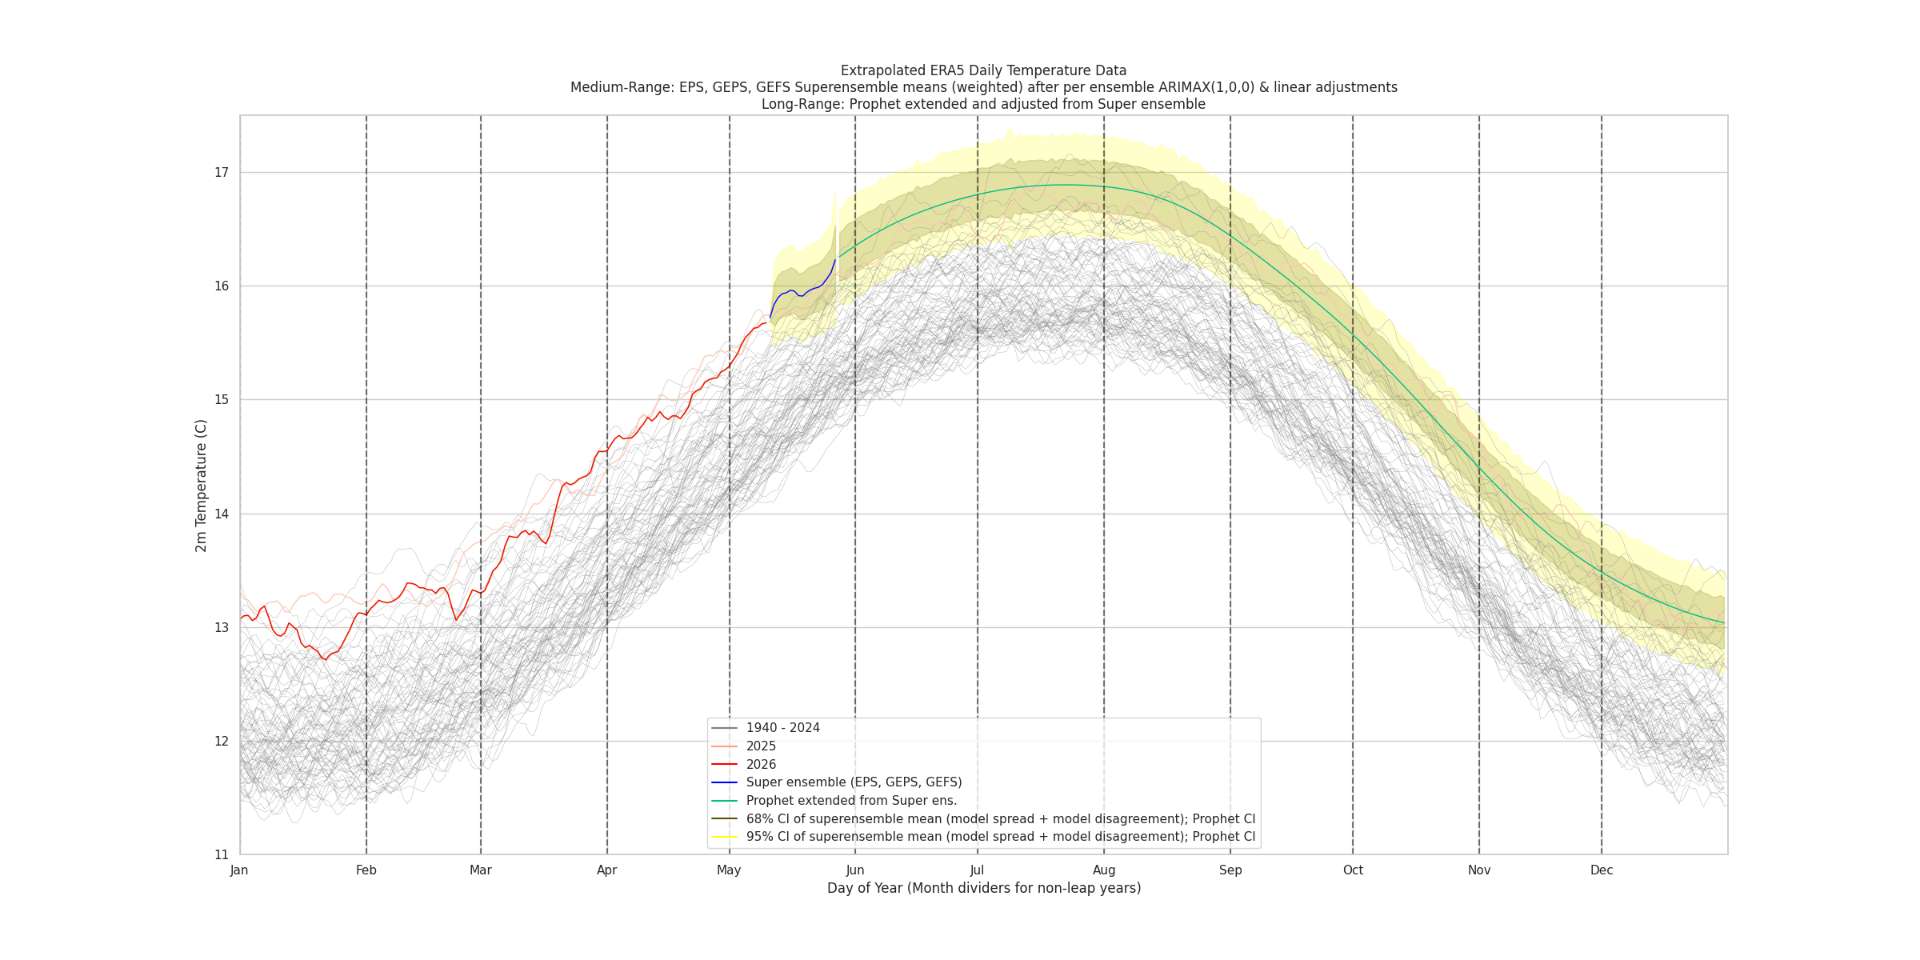
And will now switch to using one that makes use of the historical lead time information (i.e. debiasing by lead time, relative to the latest ERA5 preliminary copernicus ), it also uses now the historical variance (this isn't based off the last debiased error by lead time step), with block bootstrap over two week chunks (although it is basically identical in the medium range), and only used for when I have 100 samples at that lead time, otherwise it defaults to Prophet's estimate in the very long range-- i.e. you can see it switch in December
New one below (edit fixed, was not using debiased 2t mean on lead time):
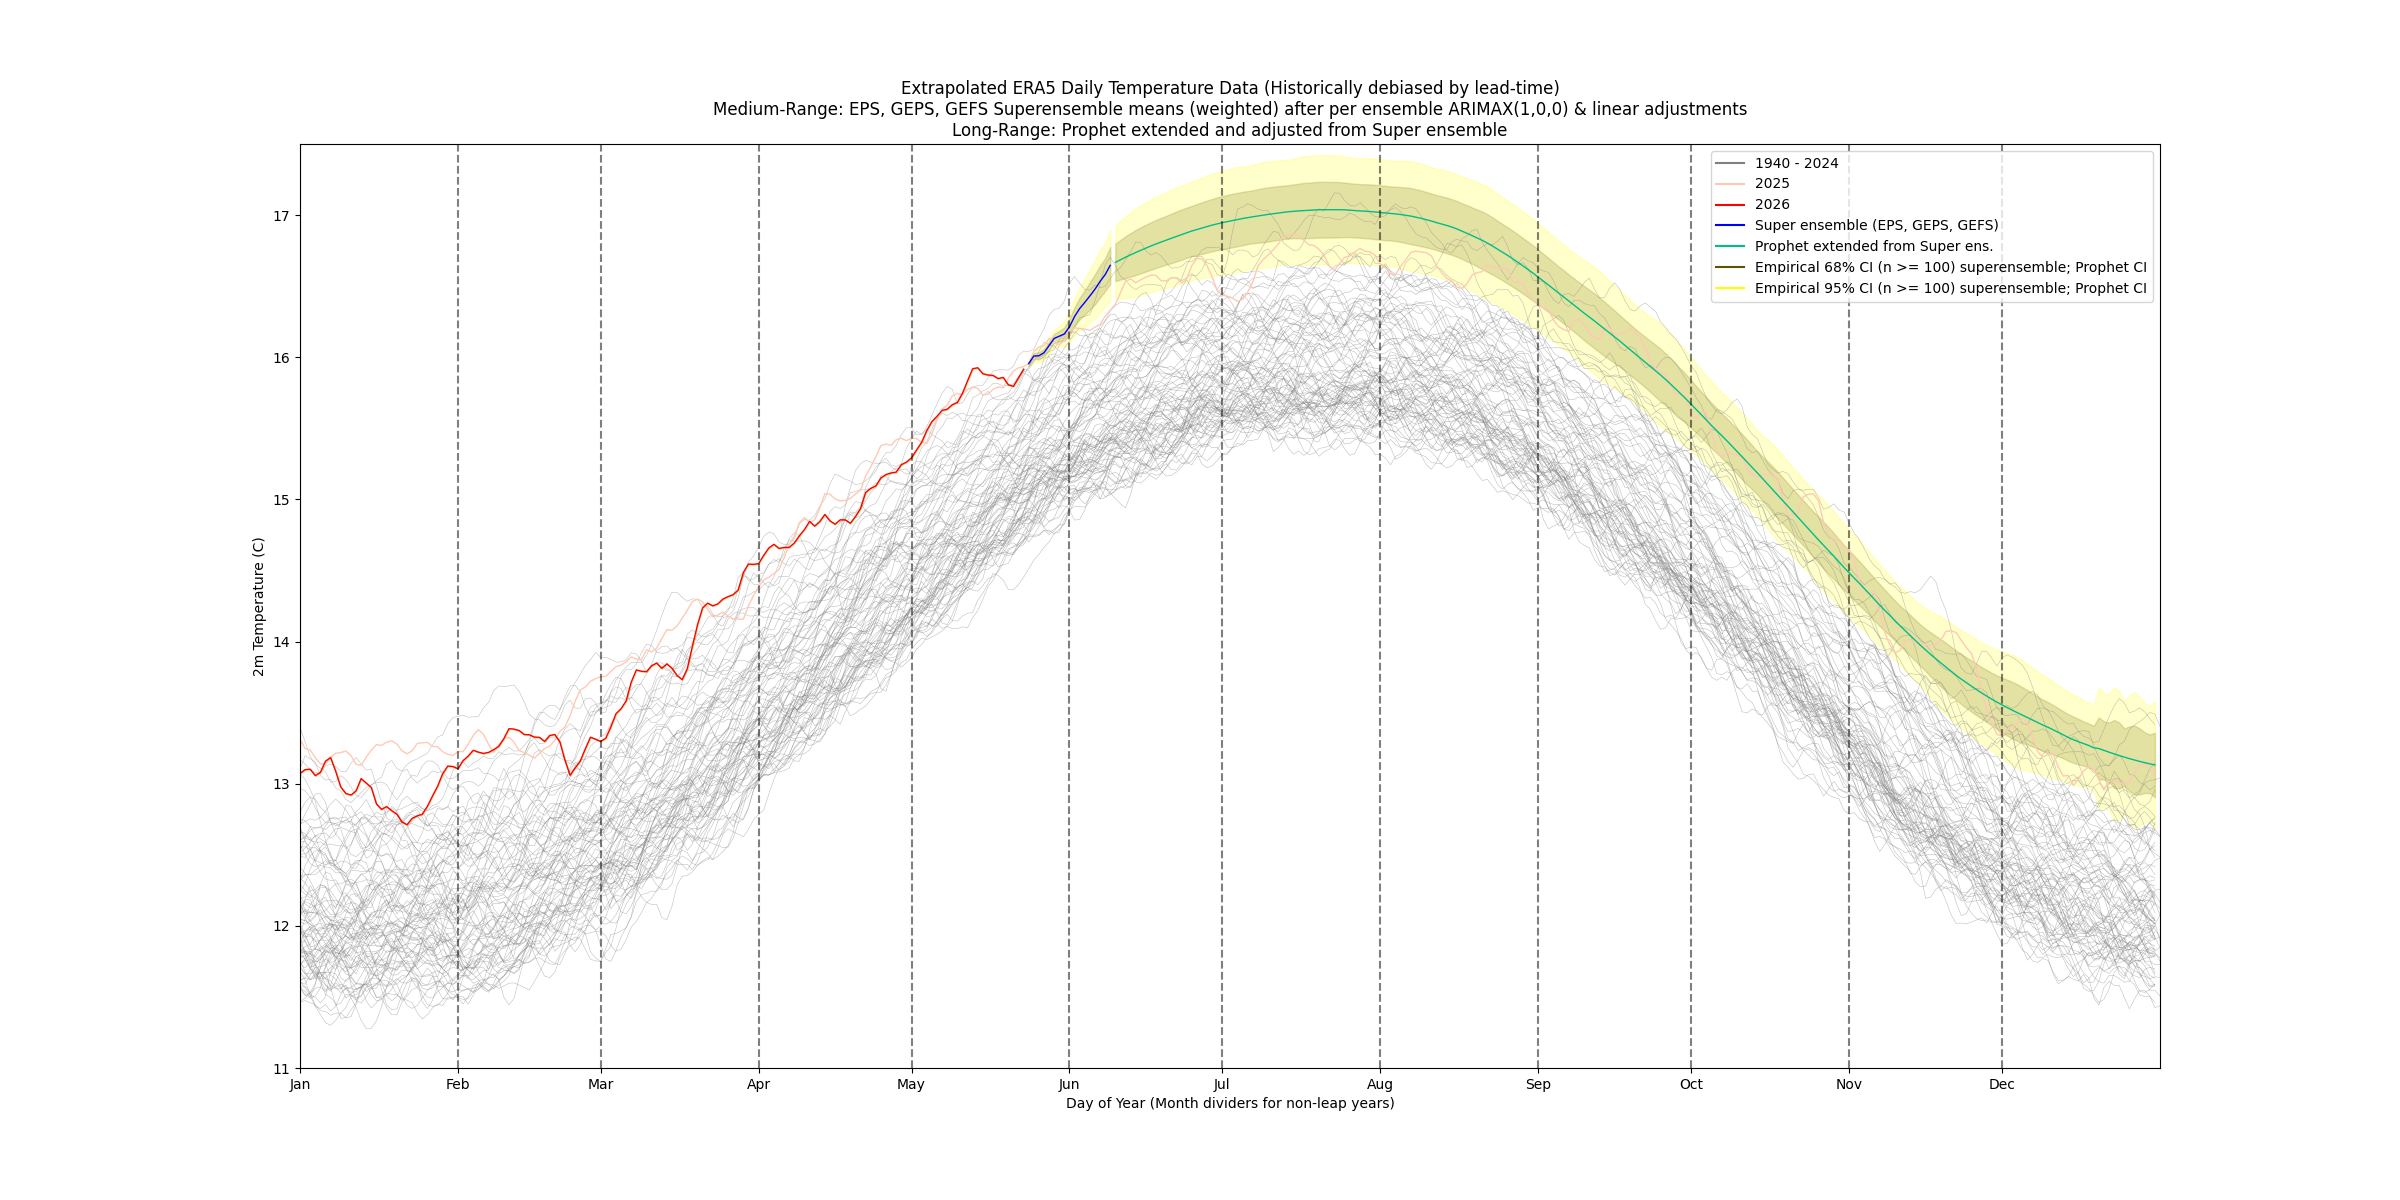
This is despite ECMWF switching to a new model (it's only a rough estimate anyway since ideally I would calibrate the spread with reforecasts of each ensemble member but this is too much work at the moment; as such it is not the best representative of the spread since it covers the variance over many less analog months (and not just near the day of year which would be more appropriate). The variance in the long range prophet will probably be always be a bit off though (either too small or too large).
~
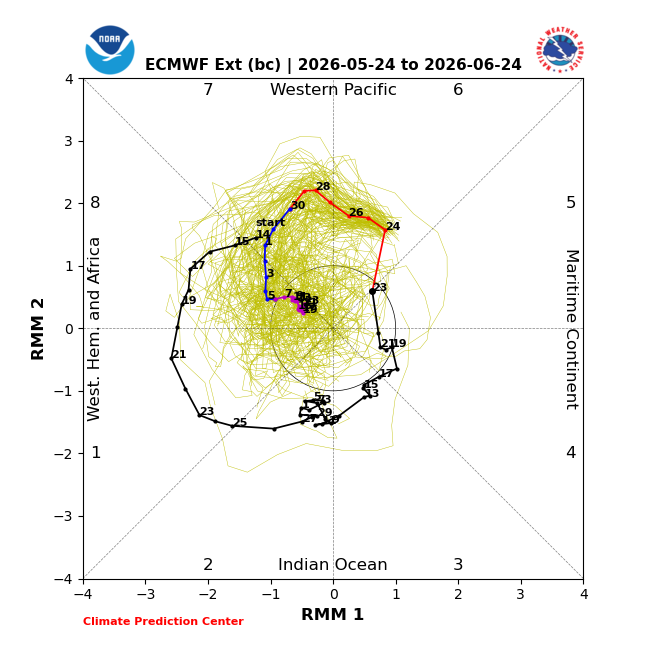
June looks like to start off like May but a weak/ambiguous MJO signal in the second week of June at the moment so not much confidence we will see continue to see such a steep rise...
analog_method,delta method,old weights: 0.5611, 0.2324, 0.2065
Point estimate (old, delta method, analog method) adjusted by prediction error mean: 1.1073, 1.1385 1.0979
Point estimate (mix) adjusted by prediction error mean: 1.1093
Probs (mix) with super ens var
Std. dev.: 0.0460
Bin Probability (%)
<1.095 37.8
1.095-1.145 40.3
1.145-1.195 18.7
1.195-1.245 3.0
1.245-1.295 0.2
>1.295 0.0
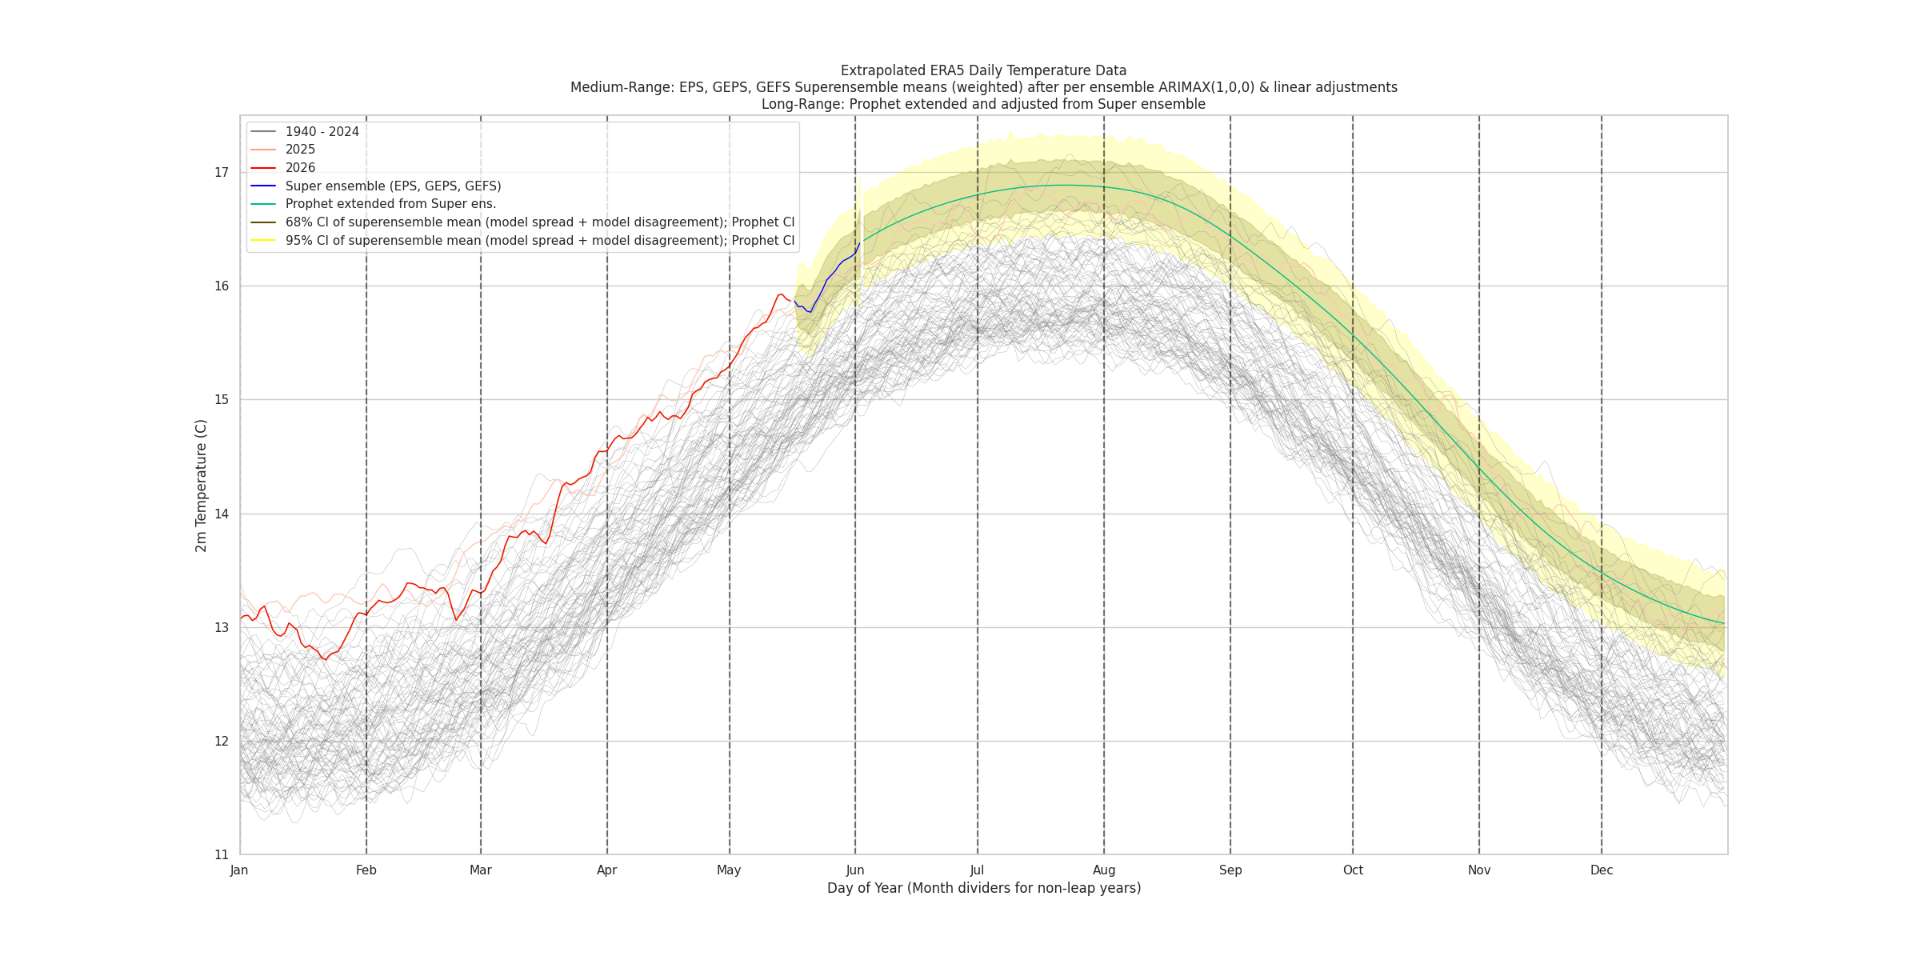
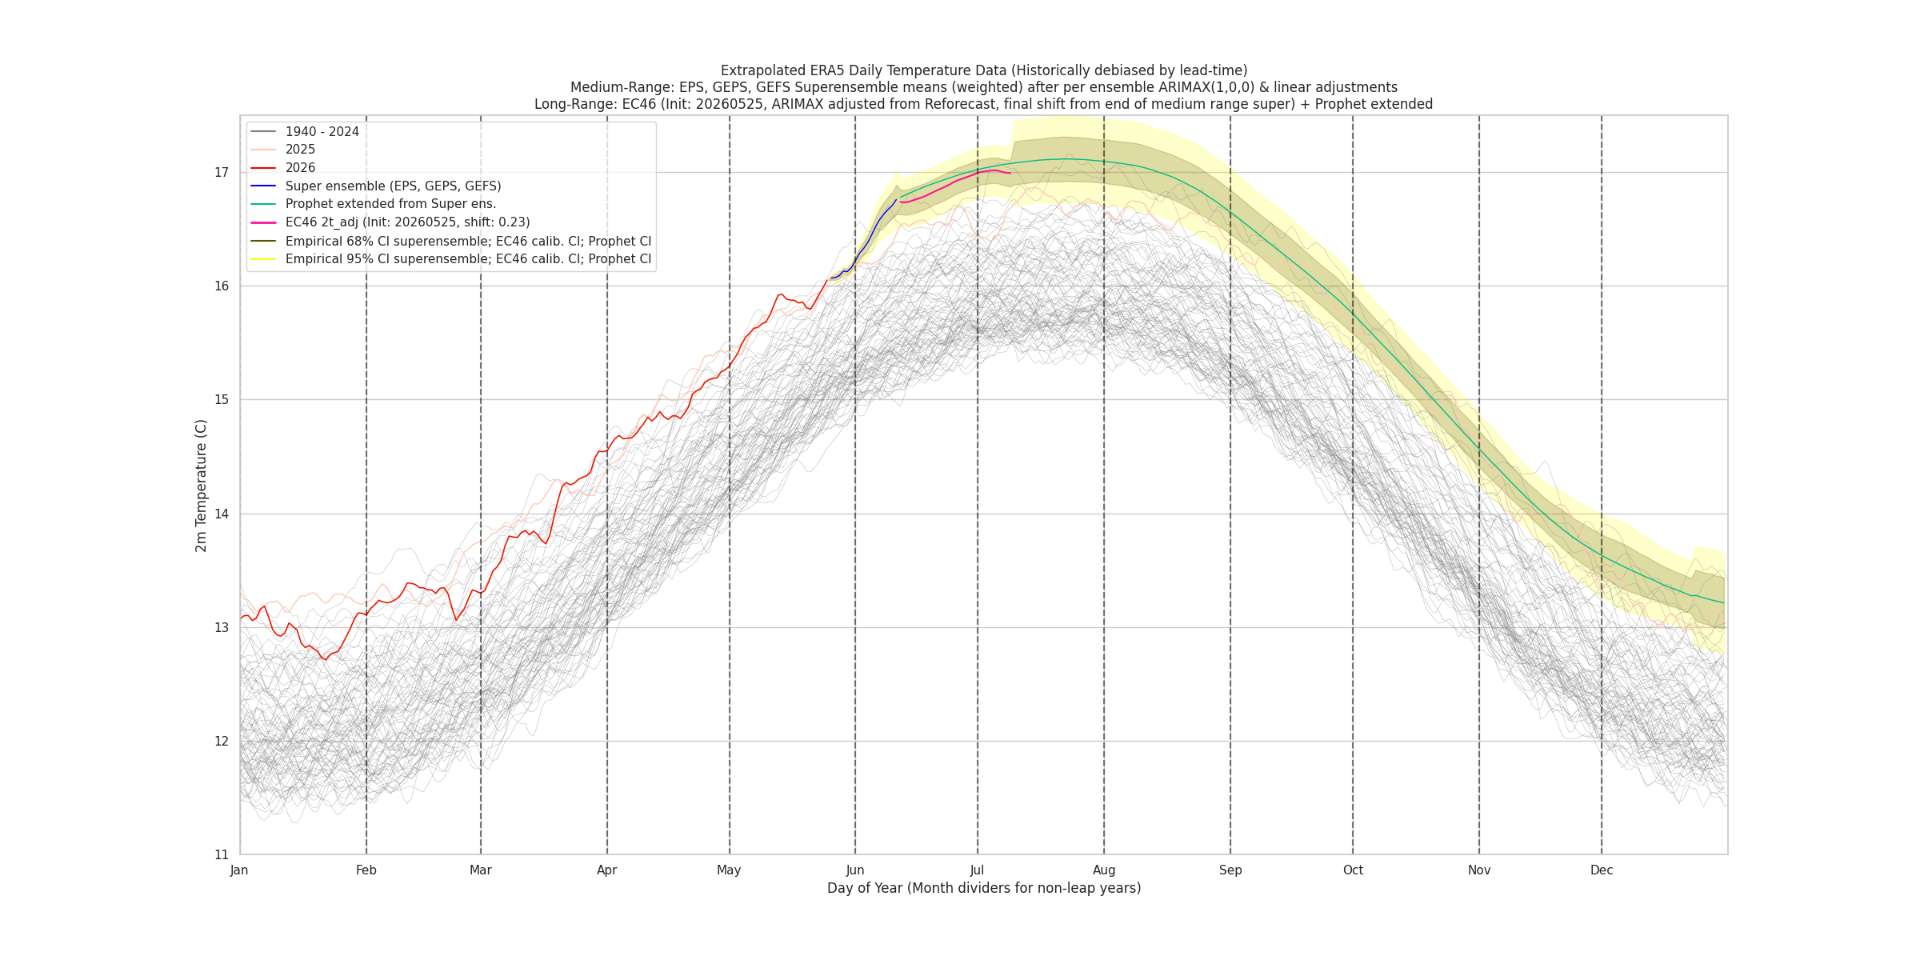
I've modified the above chart to include the subseasonal ECM (ECM46) (odd days only, meaning its 2-3 days behind -- I'm only using the odd day forecasts for now so I don't have to interpolate on the reforecasts to calibrate the variance) for reference.
The variance is as best as I could calibrate it to the on-the-fly reforecasts (using tuned, spline EMOS) that are provided. It's is still a bit under dispersive though, spread-skill ratio (spread/error) mean is about 0.88 for days 16-38 -- after then the model sort of collapses as far as variance from day 40, at least as far as I can interpret it); this is only done with a handful (7) of samples though from the last month or so. the EC46 is ARIMA(1,0,0) adjusted but should be minimal given I'm only using after the medium range.
The shift to bring the dated EC46 forecast, referenced uses the mean of the delta from the two days of the super ensemble's medium range that overlaps with EC46. The shift is noted in the legend. Other than that the CI is as the latest changes for the super ensemble, and prophet.
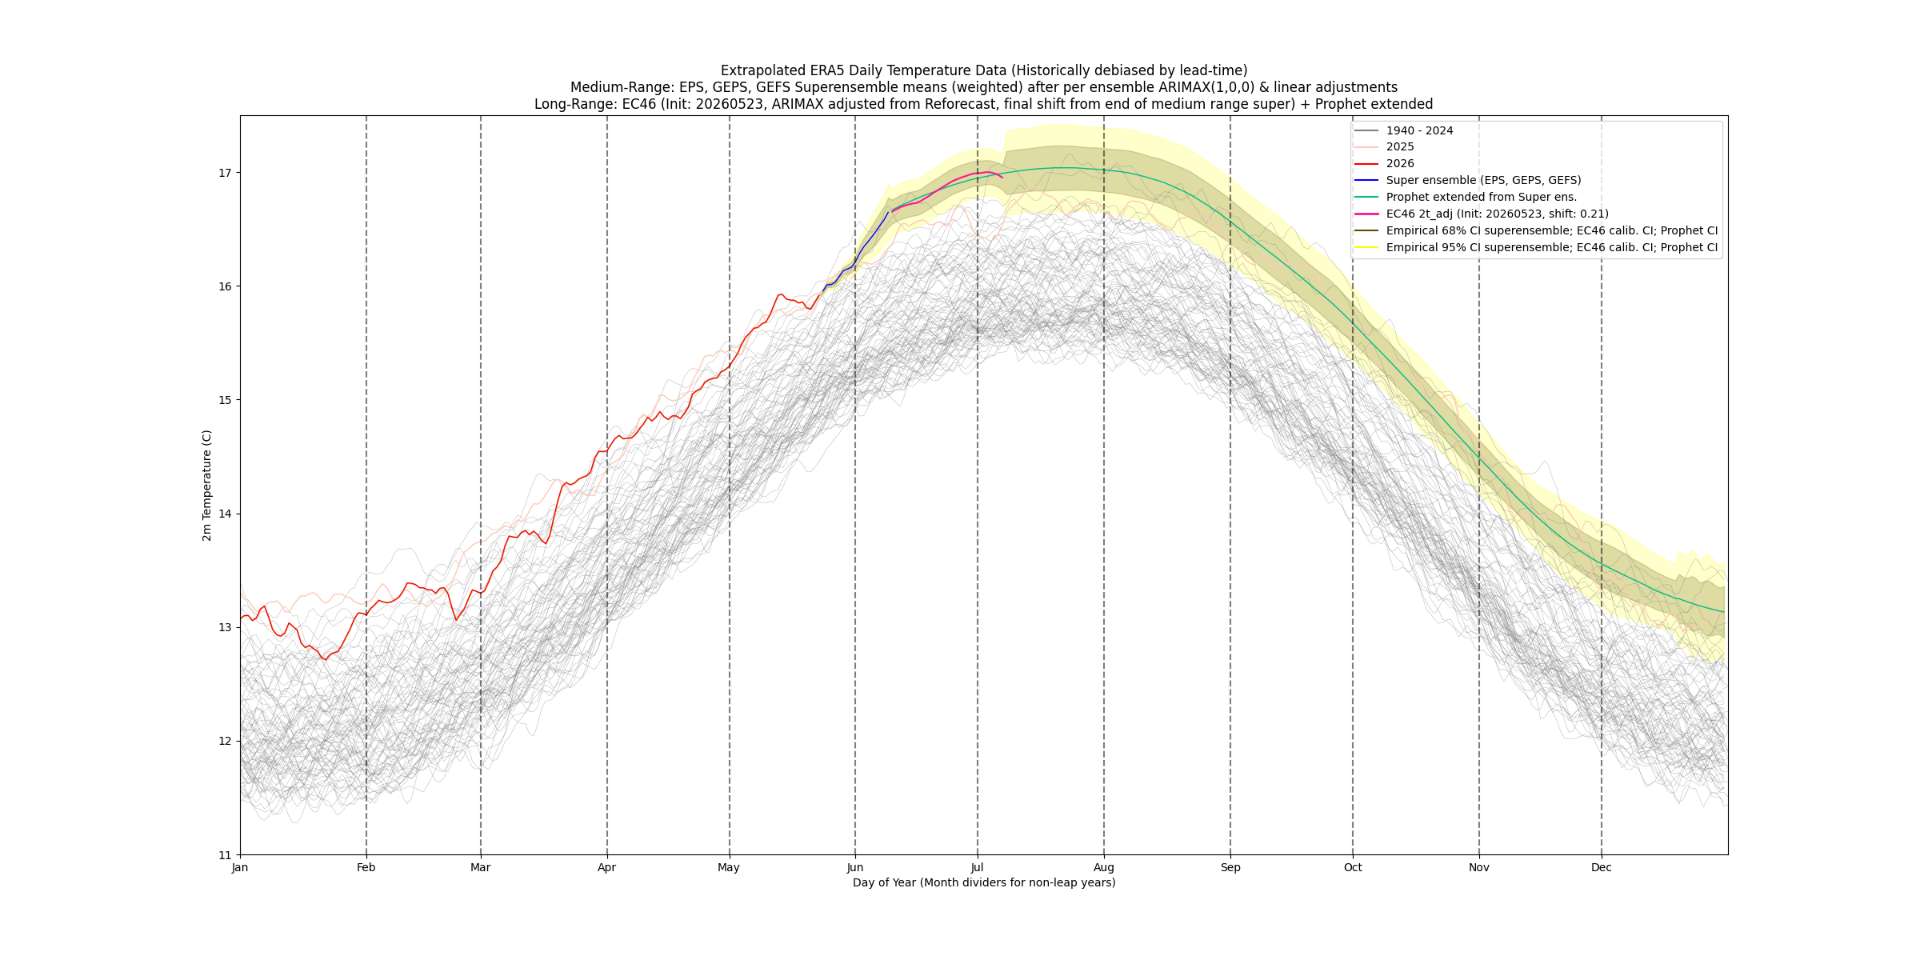
The trend is mostly following Prophet, with a slight plataeu indicated after the medium range finishes.
Not much change for the probabilities for me for May over last 5 days as month comes to a close. (1.105 C)
Meanwhile on polymarket it has been > 70% for the last 4 days on the most likely bin.
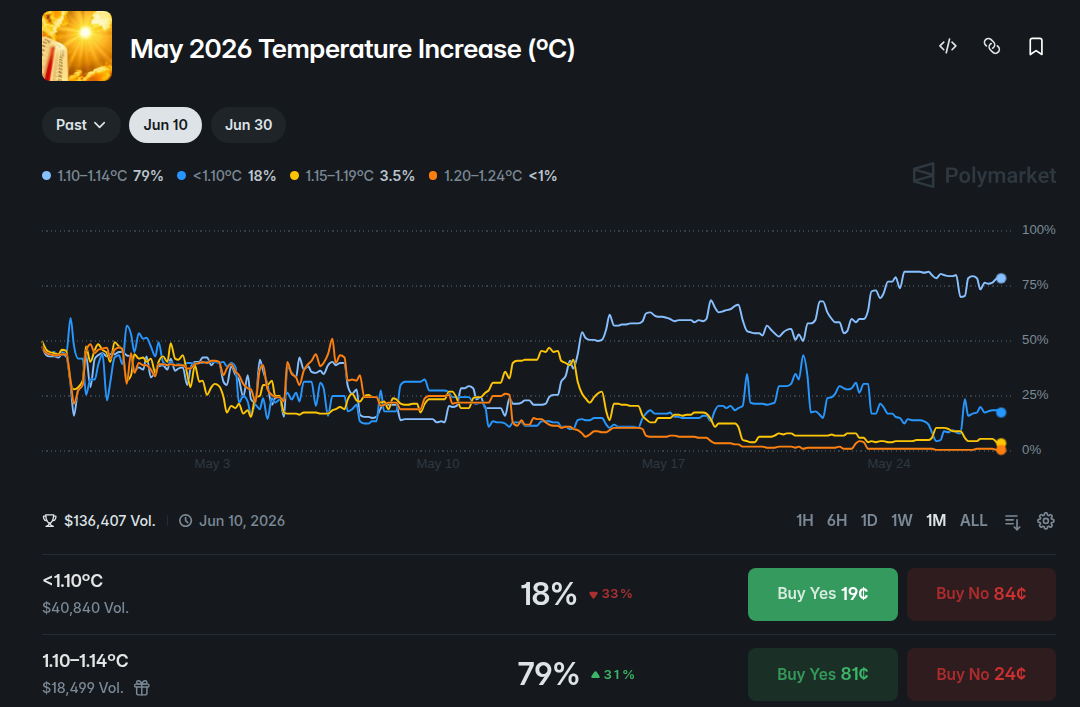
As always I disagree with how confident people should be... but 🤷 .
I'm once again in a particularly asymmetric position this month still, only profiting if it doesn't end up in 1.10-1.15.
~
Looking back at beginning of May...
The (slope of the rise) first two weeks of May ended up ranking 7th (instead of 6th) as the super ensemble forecast showed at the end of April. I call that a hit for the medium range.
However a week after that the super ensemble did poorly, as forecasts with inits around May 7 did especially poorly for lead times 8 days out or more (similarly to what happened in April), and ended up exaggerating how warm May was going to be (red is model was too warm relative to obs.):
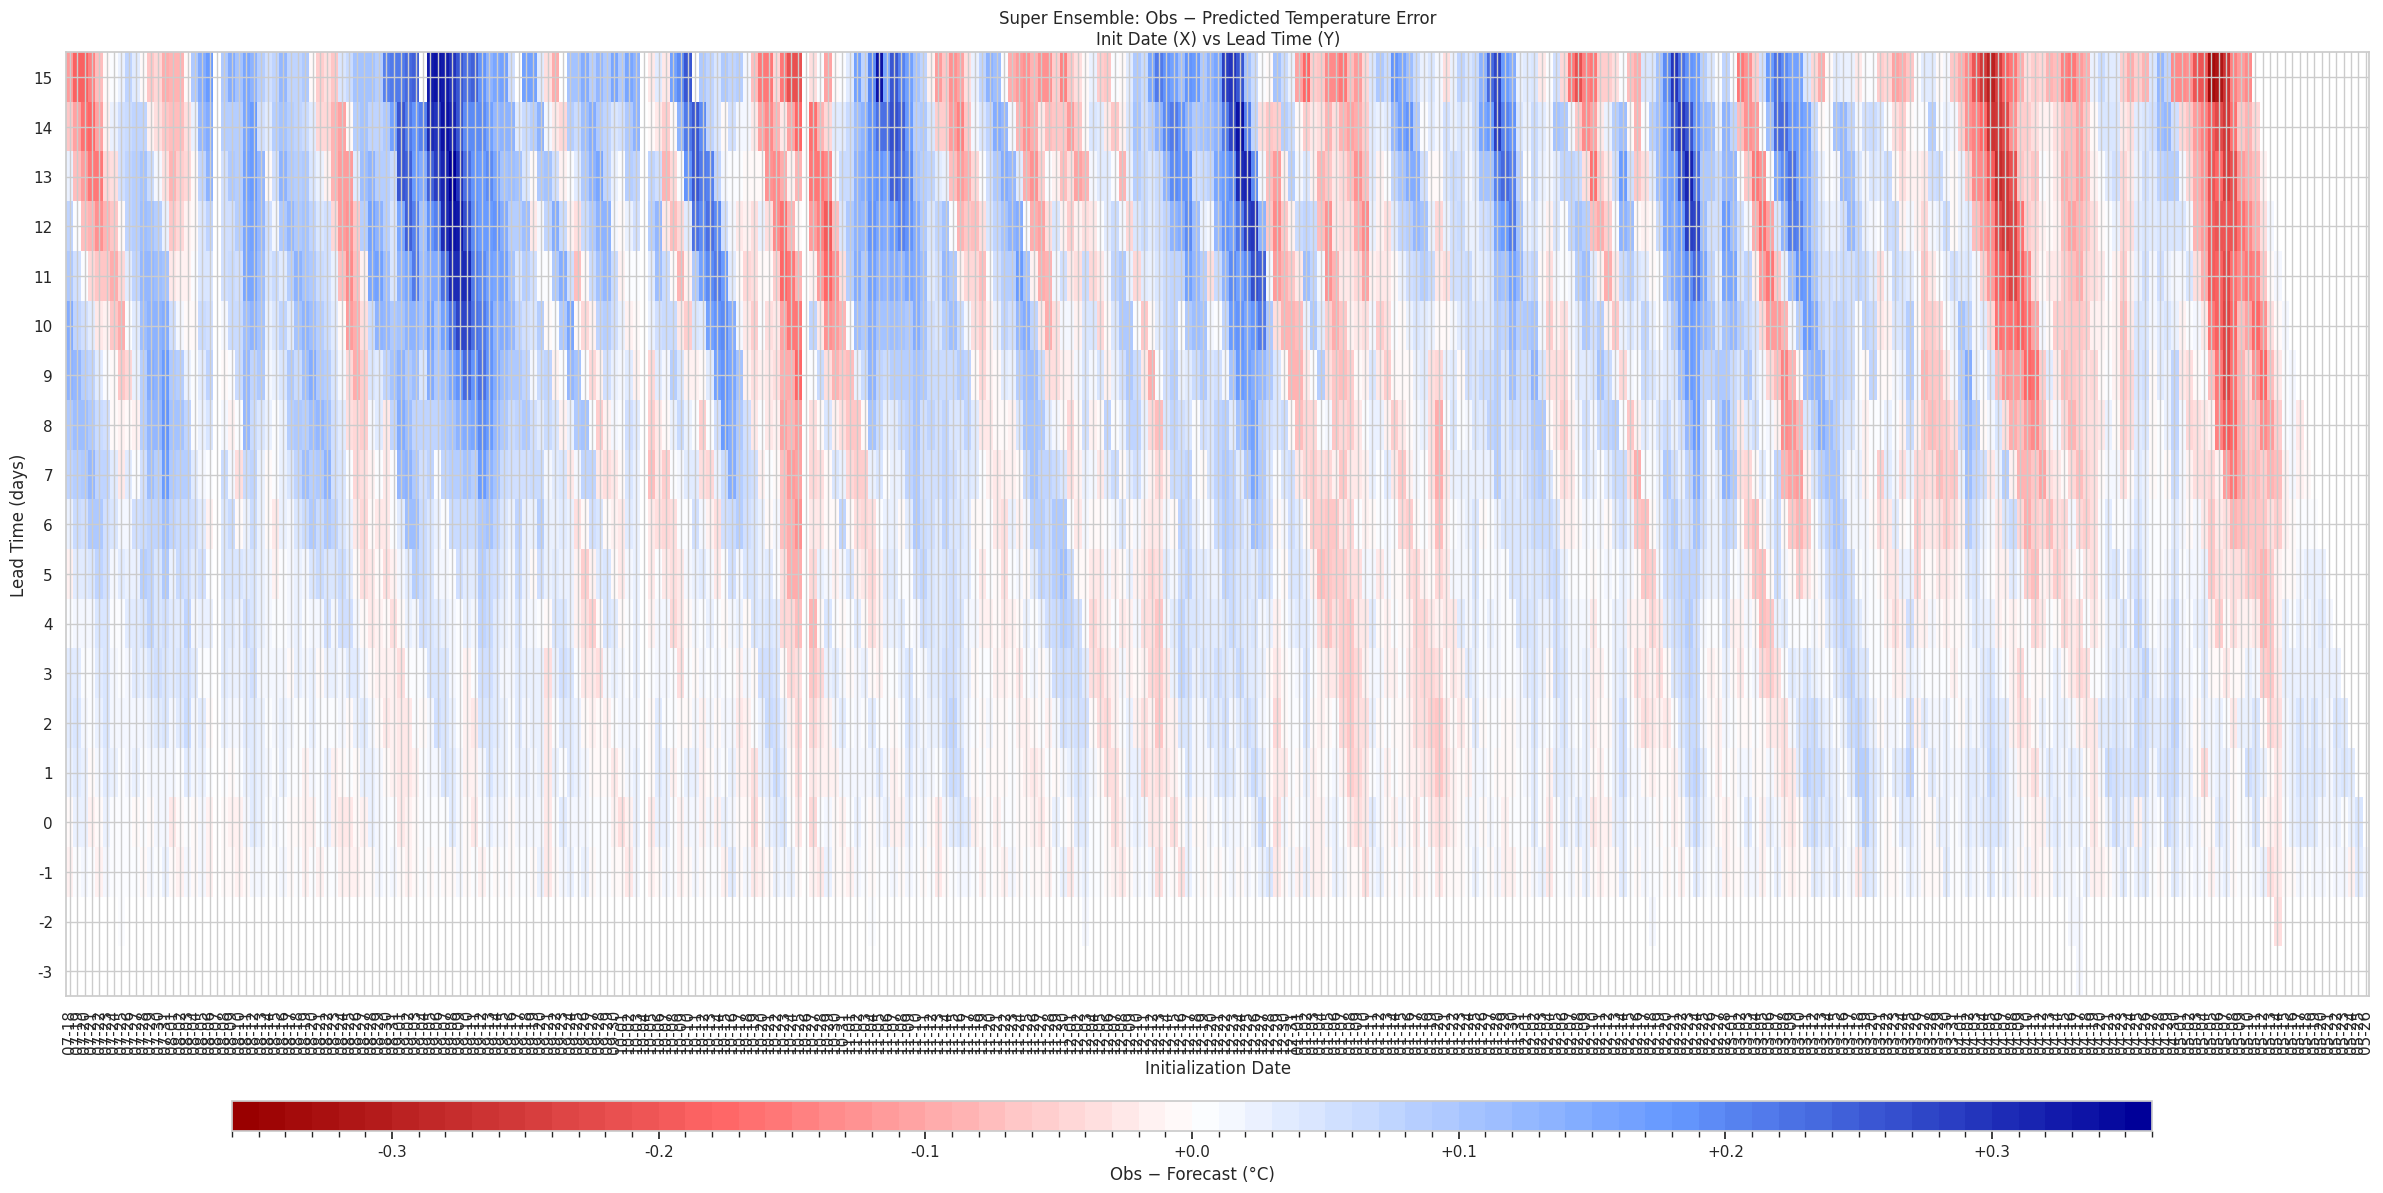
~
Now looking to June...
With this in mind, will we see something similar as far as errors in June? Maybe, but not as large as I would expect, as the slope of the trend for the second half of June naturally won't be as steep.
Notably, for the first 10 days though of June (as far as ECM medium range goes now) we have the slope ranked #2 !
1995: 0.04785494505494492
2026: 0.04652830402572993
1986: 0.04478681318681309
1988: 0.04318241758241797
1996: 0.042898901098900995
1947: 0.0426769230769232
2013: 0.042261538461538614
Afterwards, EC46 shows the trend though is now (slightly) below climatology in the latest run:
This makes it continue to look like there is a greater chance of a plateau/dip in trend after what the medium range shows presently, like what happened in May...
Analysis from superensemble for yesterday May 27 came in quite a bit colder then expected, which is unusual. I.e. here are the last 10 forecasts I did for it from older inits to today (last one is ~ tau=0h super ensemble analysis (except for geps which includes a couple tau=6h forecasts)):
[np.float64(16.115467685246234), np.float64(16.087889314238634), np.float64(16.097090013120667), np.float64(16.089386706331844), np.float64(16.059621980704456), np.float64(16.05610415912528), np.float64(16.019827199567374), np.float64(16.035886100615055), np.float64(16.064108874761605), np.float64(15.99339020147704)]
>>> np.mean(may27[:-1])
np.float64(16.069486892634572)
>>> np.mean(may27[-1])
np.float64(15.99339020147704)
About 0.07C cooler than predicted for the last 9 days, and even the day of !
We'll have to wait a day or two to see if this validates in the ERA5 preliminary data.
~
Edit (correction after looked at wrong product):
This only being a single day and a marginal change in the month temperatures alone (-0.002C), with the delta analog data also dropping (-0.004) it only pushed the lowest bin probabilities up marginally.
(spotted this when I do the usual toggling between the diagnostic charts for the last 2 days):

Edit (update):
Not sure what went wrong yesterday, but it looks like it was on my end, as only that the final adjusted value got messed up for that run somehow for that specific day (I have been adjusting a lot of the code and writing new code in different systems but its hard to see how it got affected).
Preliminary ERA5 came in for May 27, and it near was expected previously, 16.067.
(Run from today May 29):

Notable is the shift for EC46 today has dropped since yesterday by about -0.09C to +0.15C as it comes in better alignment with the end of the medium range super ensemble.