Data is currently at
https://data.giss.nasa.gov/gistemp/tabledata_v4/GLB.Ts+dSST.csv
or
https://data.giss.nasa.gov/gistemp/tabledata_v4/GLB.Ts+dSST.txt
(or such updated location for this Gistemp v4 LOTI data)
January 2024 might show as 124 in hundredths of a degree C, this is +1.24C above the 1951-1980 base period. If it shows as 1.22 then it is in degrees i.e. 1.22C. Same logic/interpretation as this will be applied.
If the version or base period changes then I will consult with traders over what is best way for any such change to have least effect on betting positions or consider N/A if it is unclear what the sensible least effect resolution should be.
Numbers expected to be displayed to hundredth of a degree. The extra digit used here is to ensure understanding that +1.20C resolves to an exceed 1.195C option.
Resolves per first update seen by me or posted as long, as there is no reason to think data shown is significantly in error. If there is reason to think there may be an error then resolution will be delayed at least 24 hours. Minor later update should not cause a need to re-resolve.
July 2026 market:
 1,000
1,000🏅 Top traders
| # | Trader | Total profit |
|---|---|---|
| 1 | Ṁ1,926 | |
| 2 | Ṁ124 | |
| 3 | Ṁ123 | |
| 4 | Ṁ113 | |
| 5 | Ṁ105 |
People are also trading
@ChristopherRandles This can resolve now: 1.18 official.
They did the run yesterday (using ghcnm dated 20260707)

ERSST came out this morning.
ghcnm.v4.0.1.20260702:
113.781
Box for Elizabeth is -0.56 C (1991-2020)
While for GISTEMP it is +2.18 C (1991-2020)
GISTEMP is +2.75 C warmer.
What about Elizabeth itself? Interpolating using ERA5...
$ python3 point_forecast_month.py 2026 6 -82.6170 -137.0830
--- Monthly t2m mean point forecast ---
Target Month: 2026-06
ERA5 days used in target: 27 of 30
Lat/Lon: (-82.617, -137.083)
Climatology (ERA5, 1991-2020): -30.2 °C
Target month anomaly (1991-2020): -1.8 °C
Point forecast (absolute): -32.0 °C
----------------
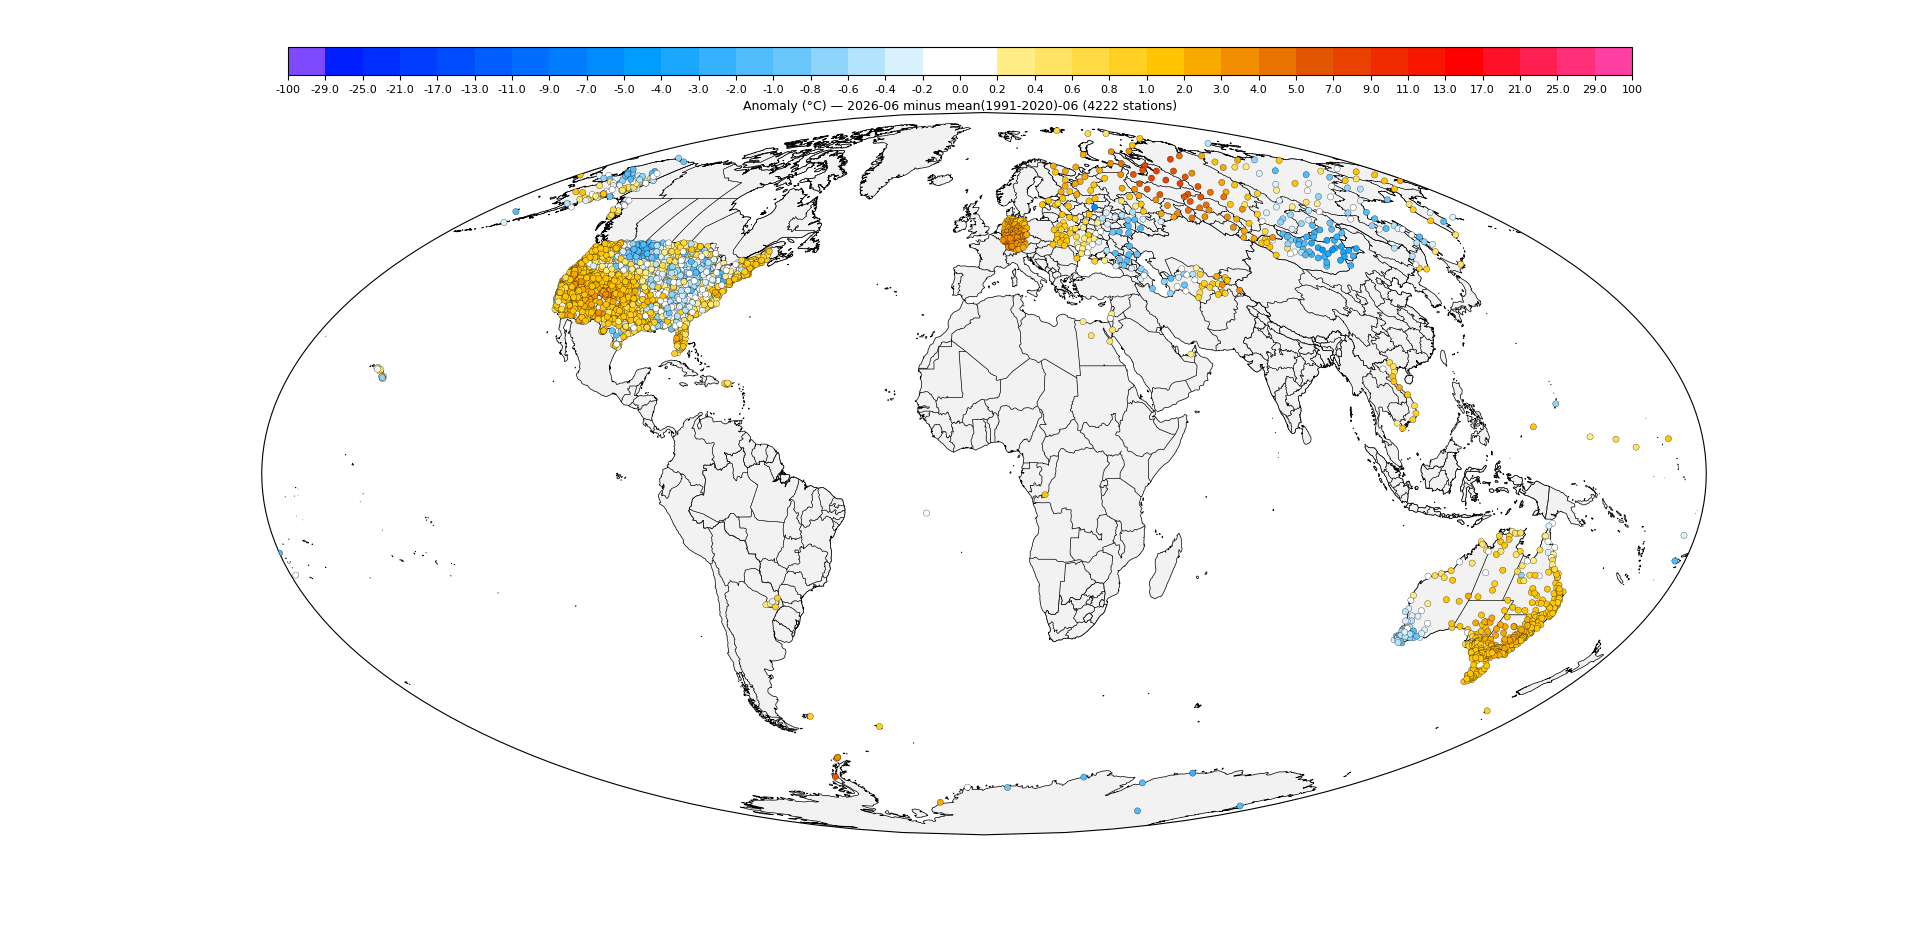
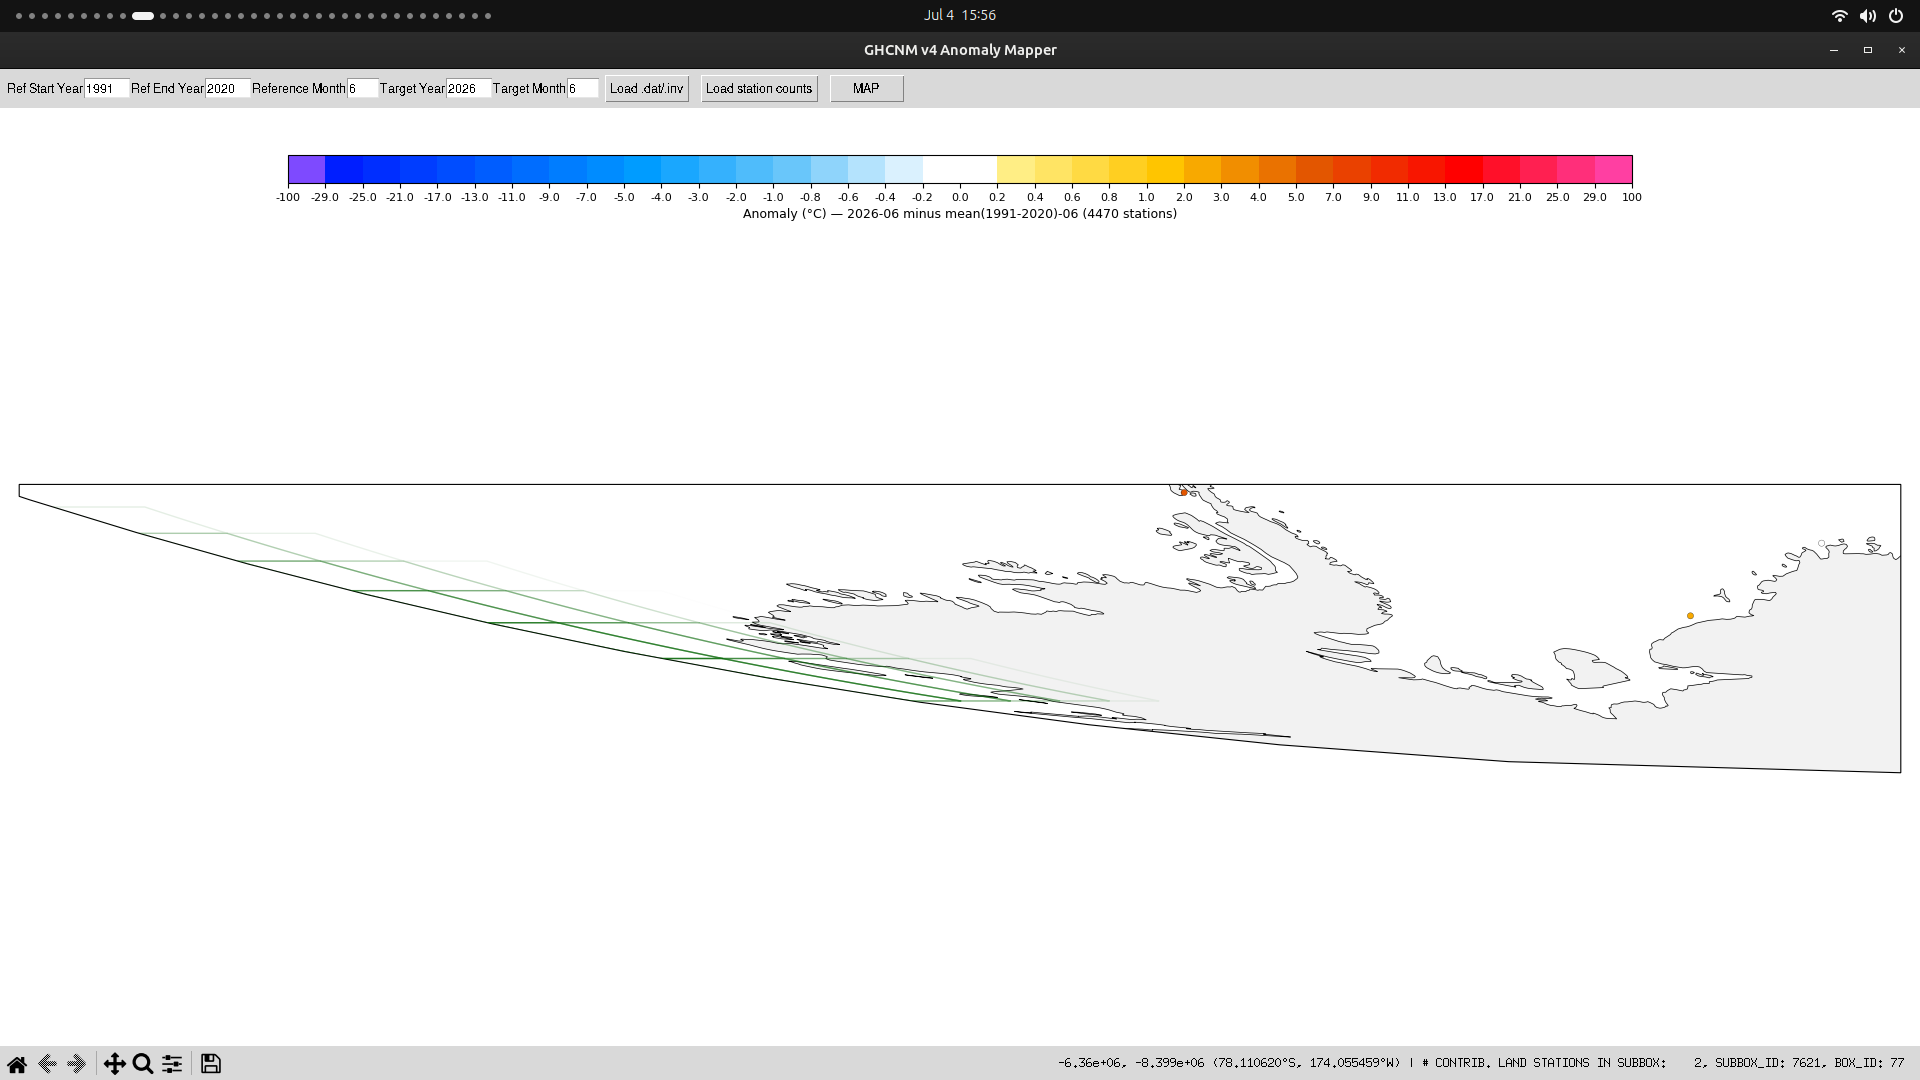
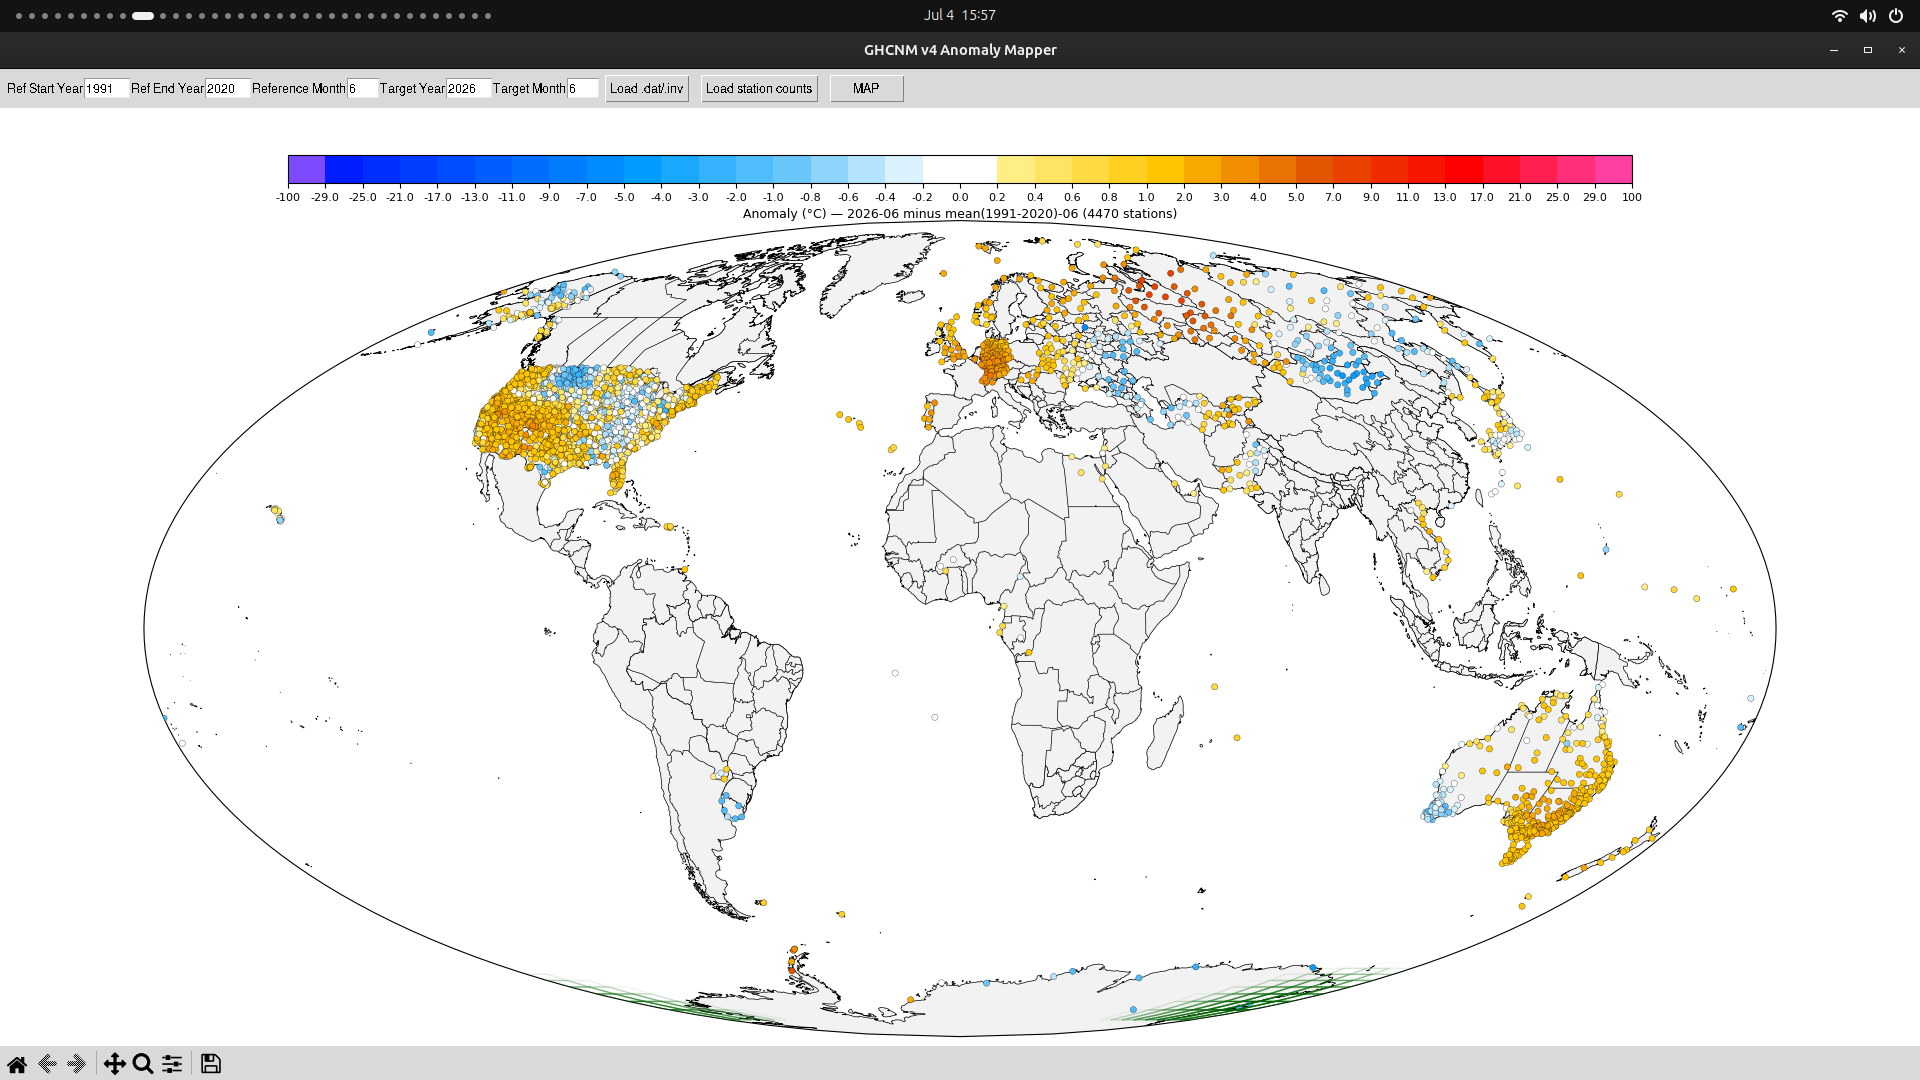
Suprising number of stations for July 3, with most of Australia already in.
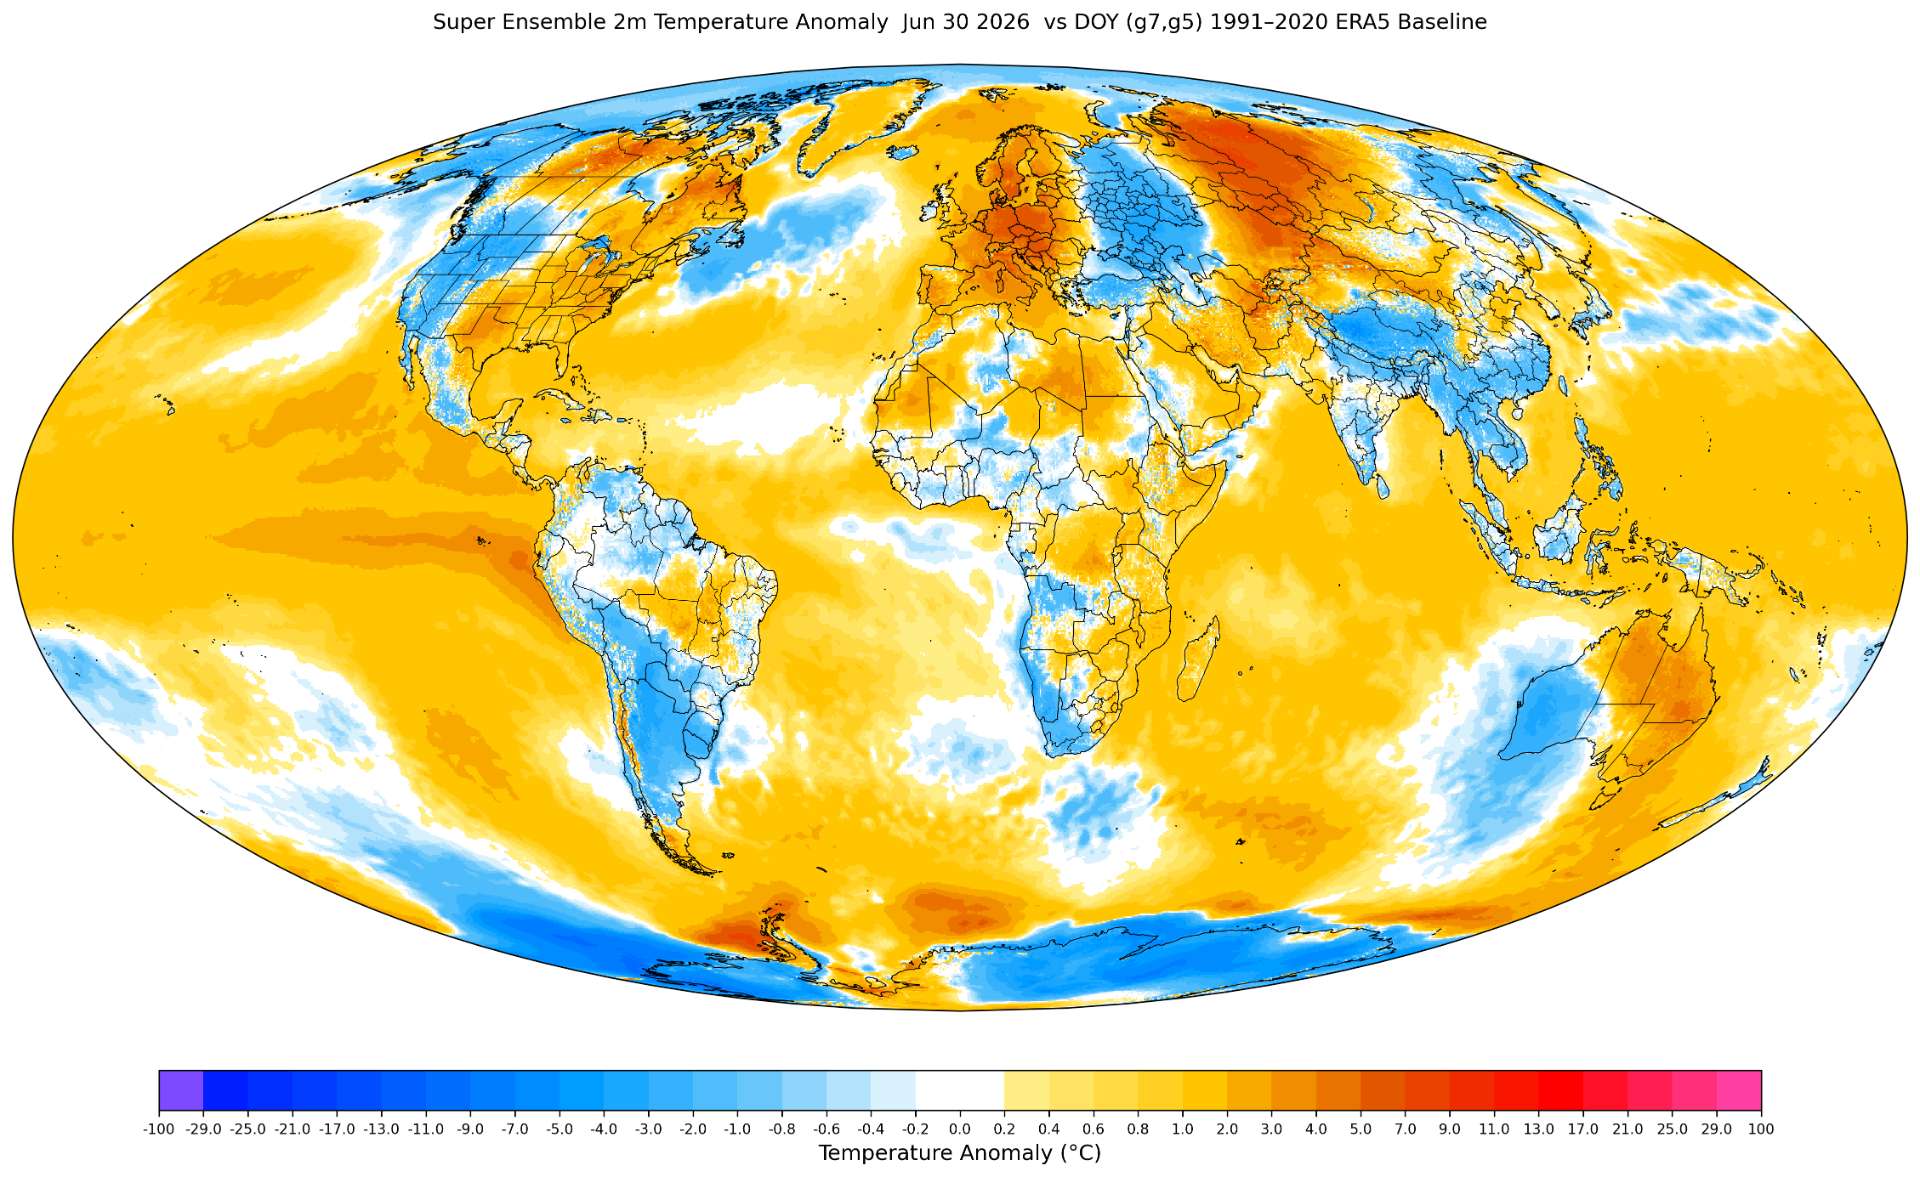
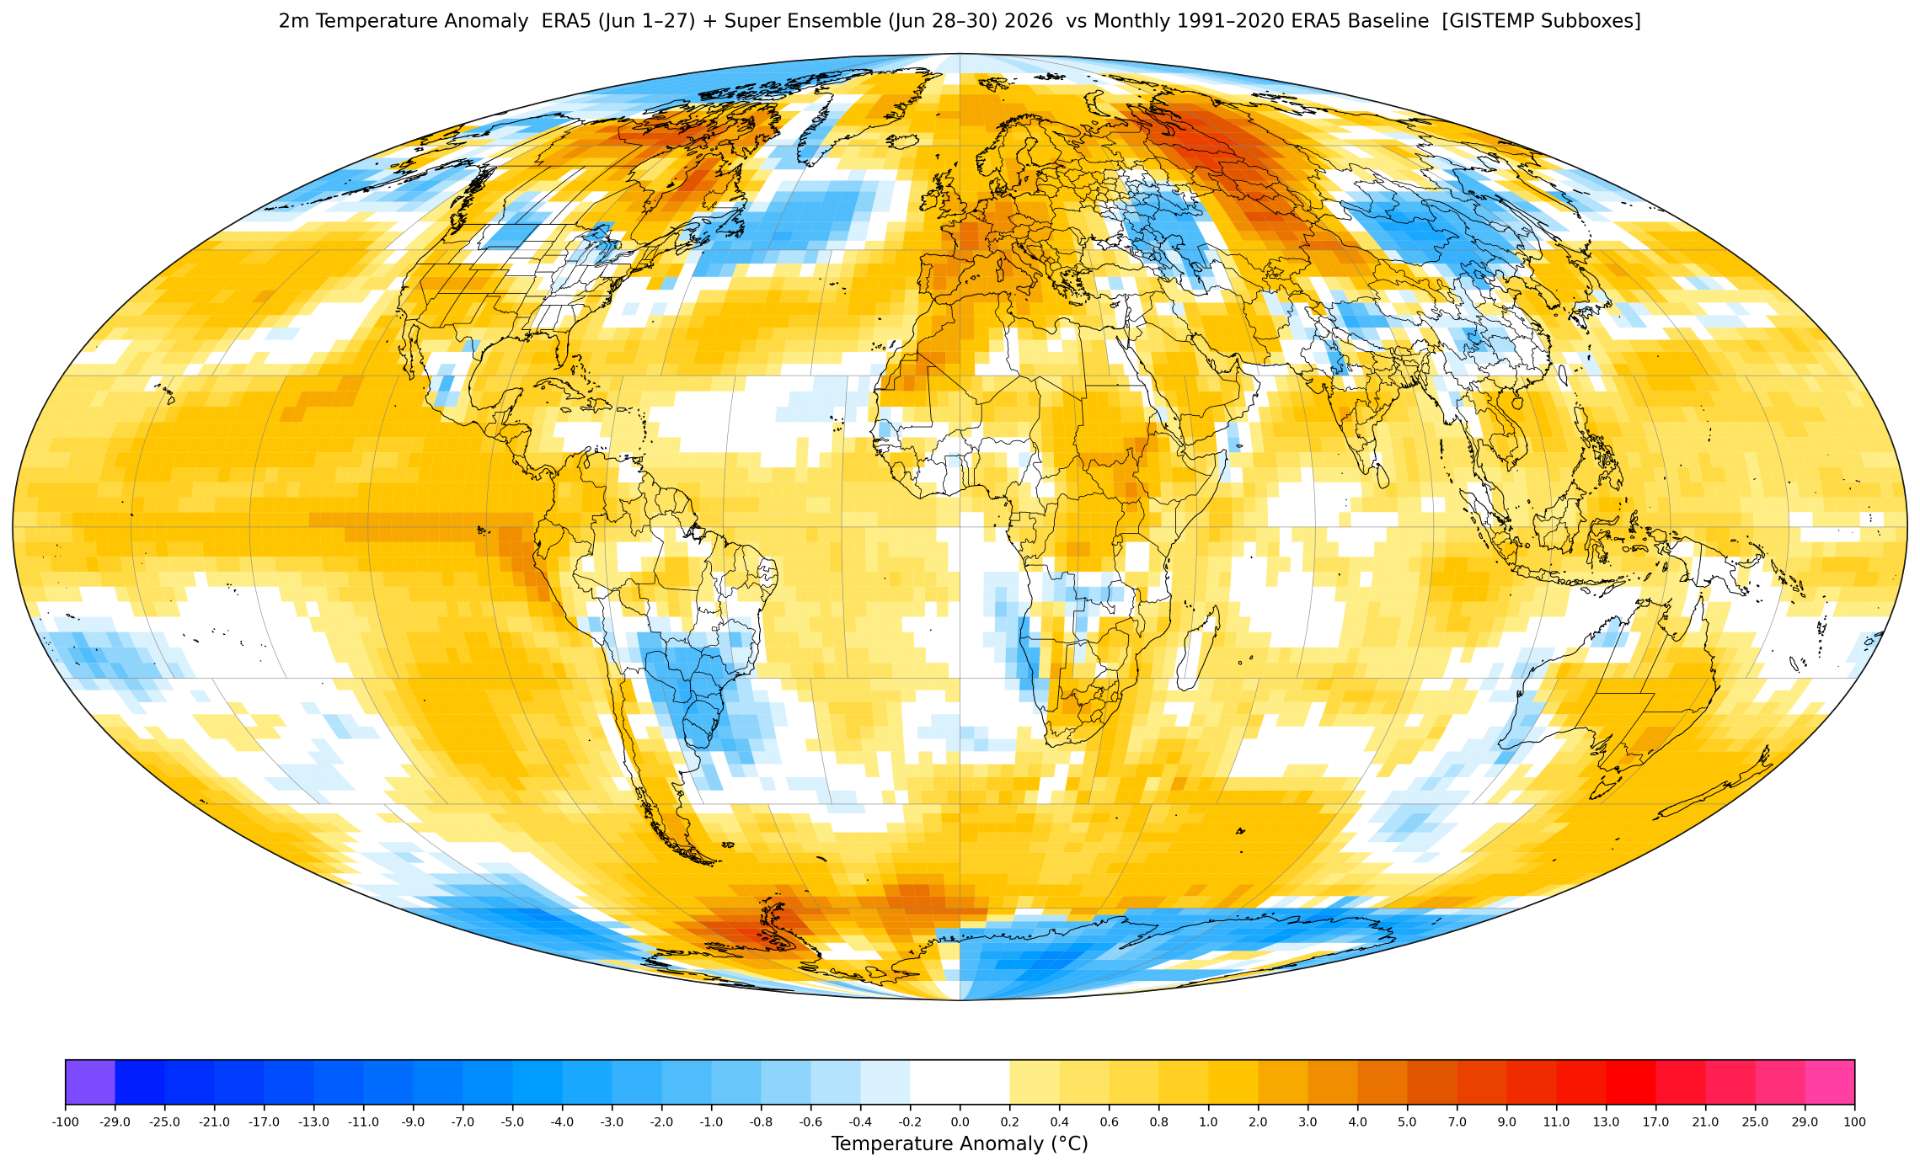
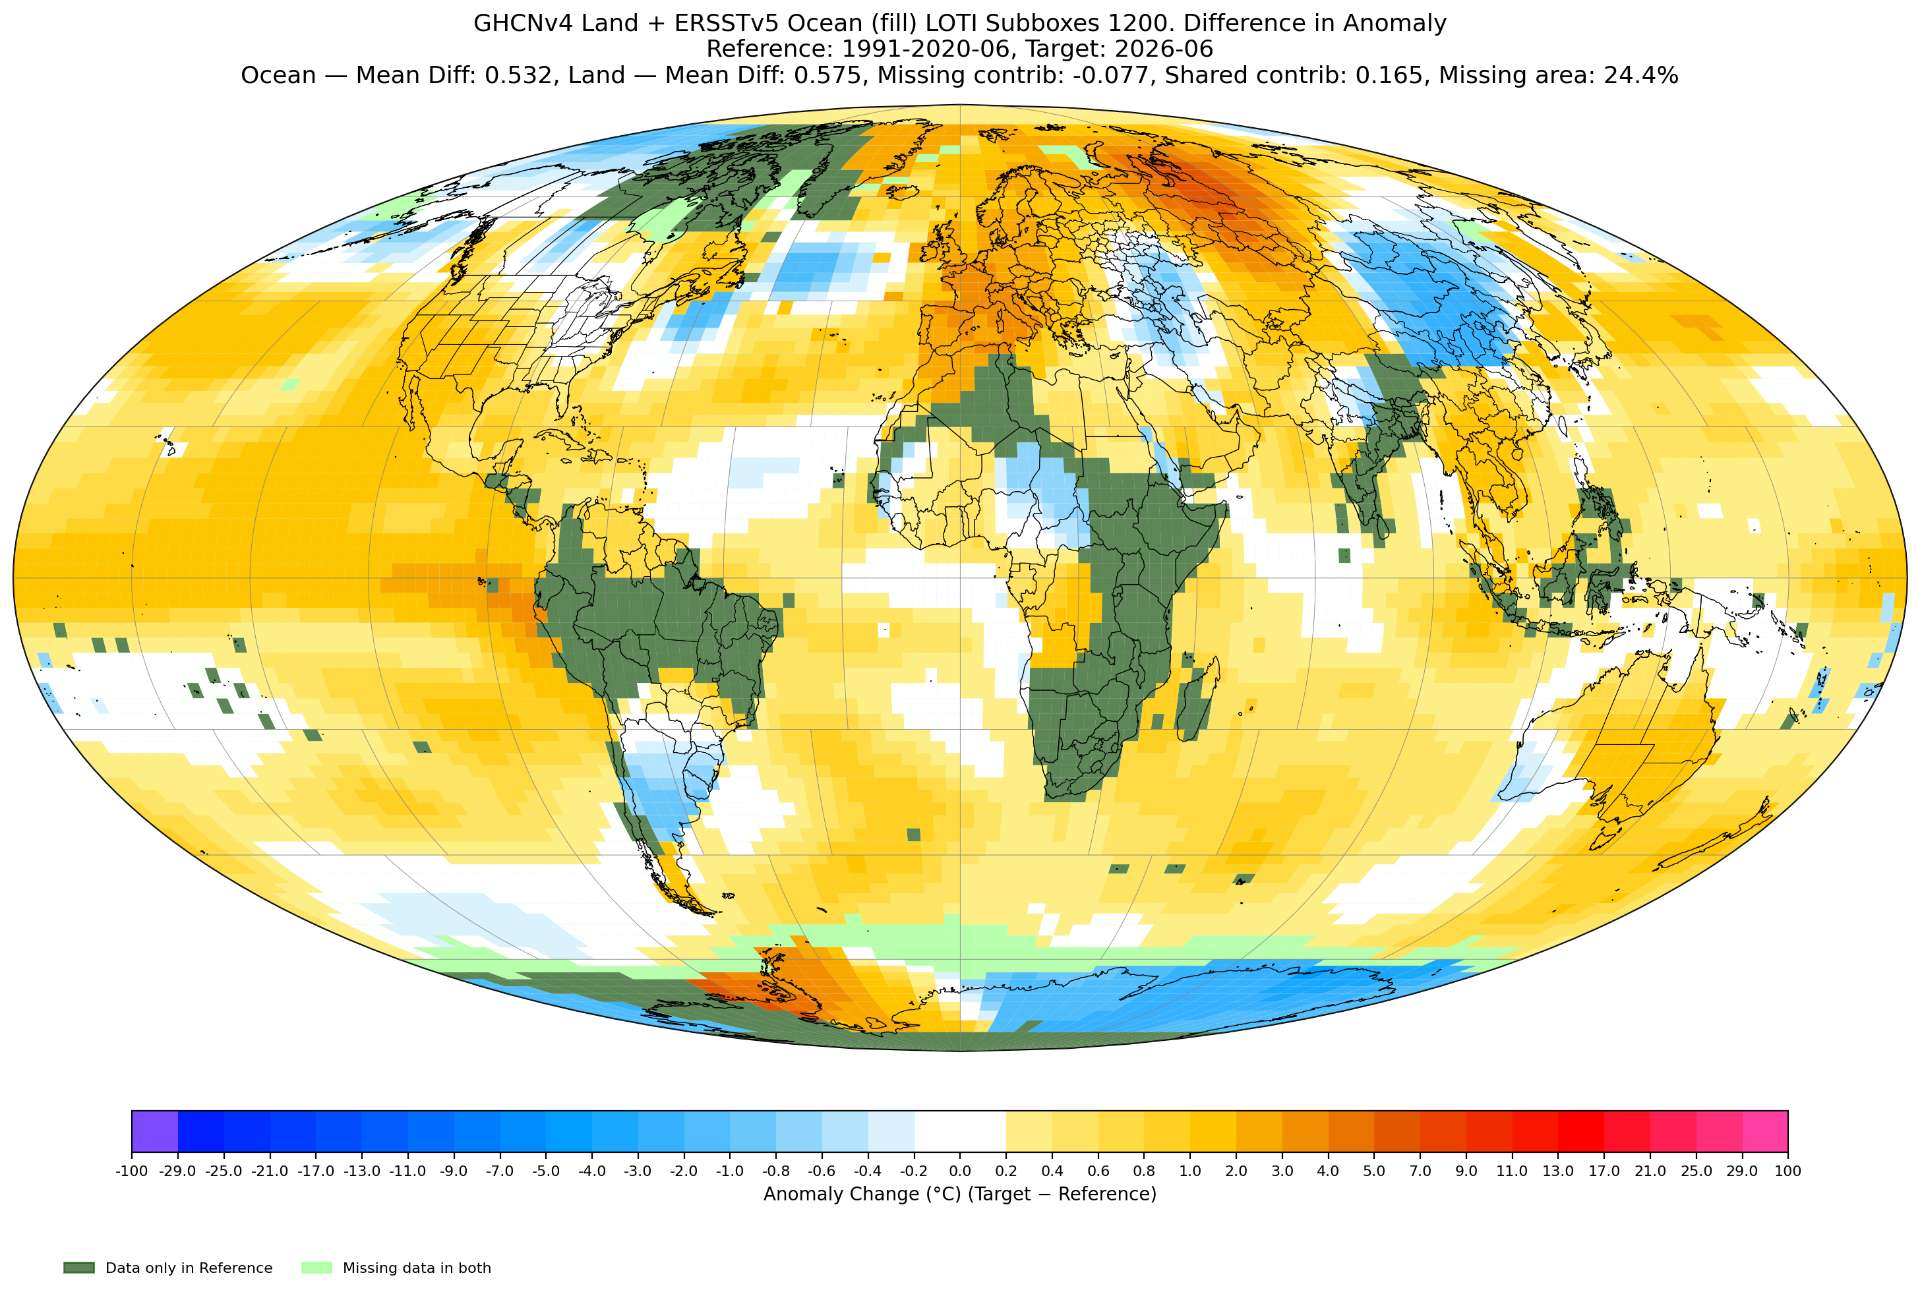
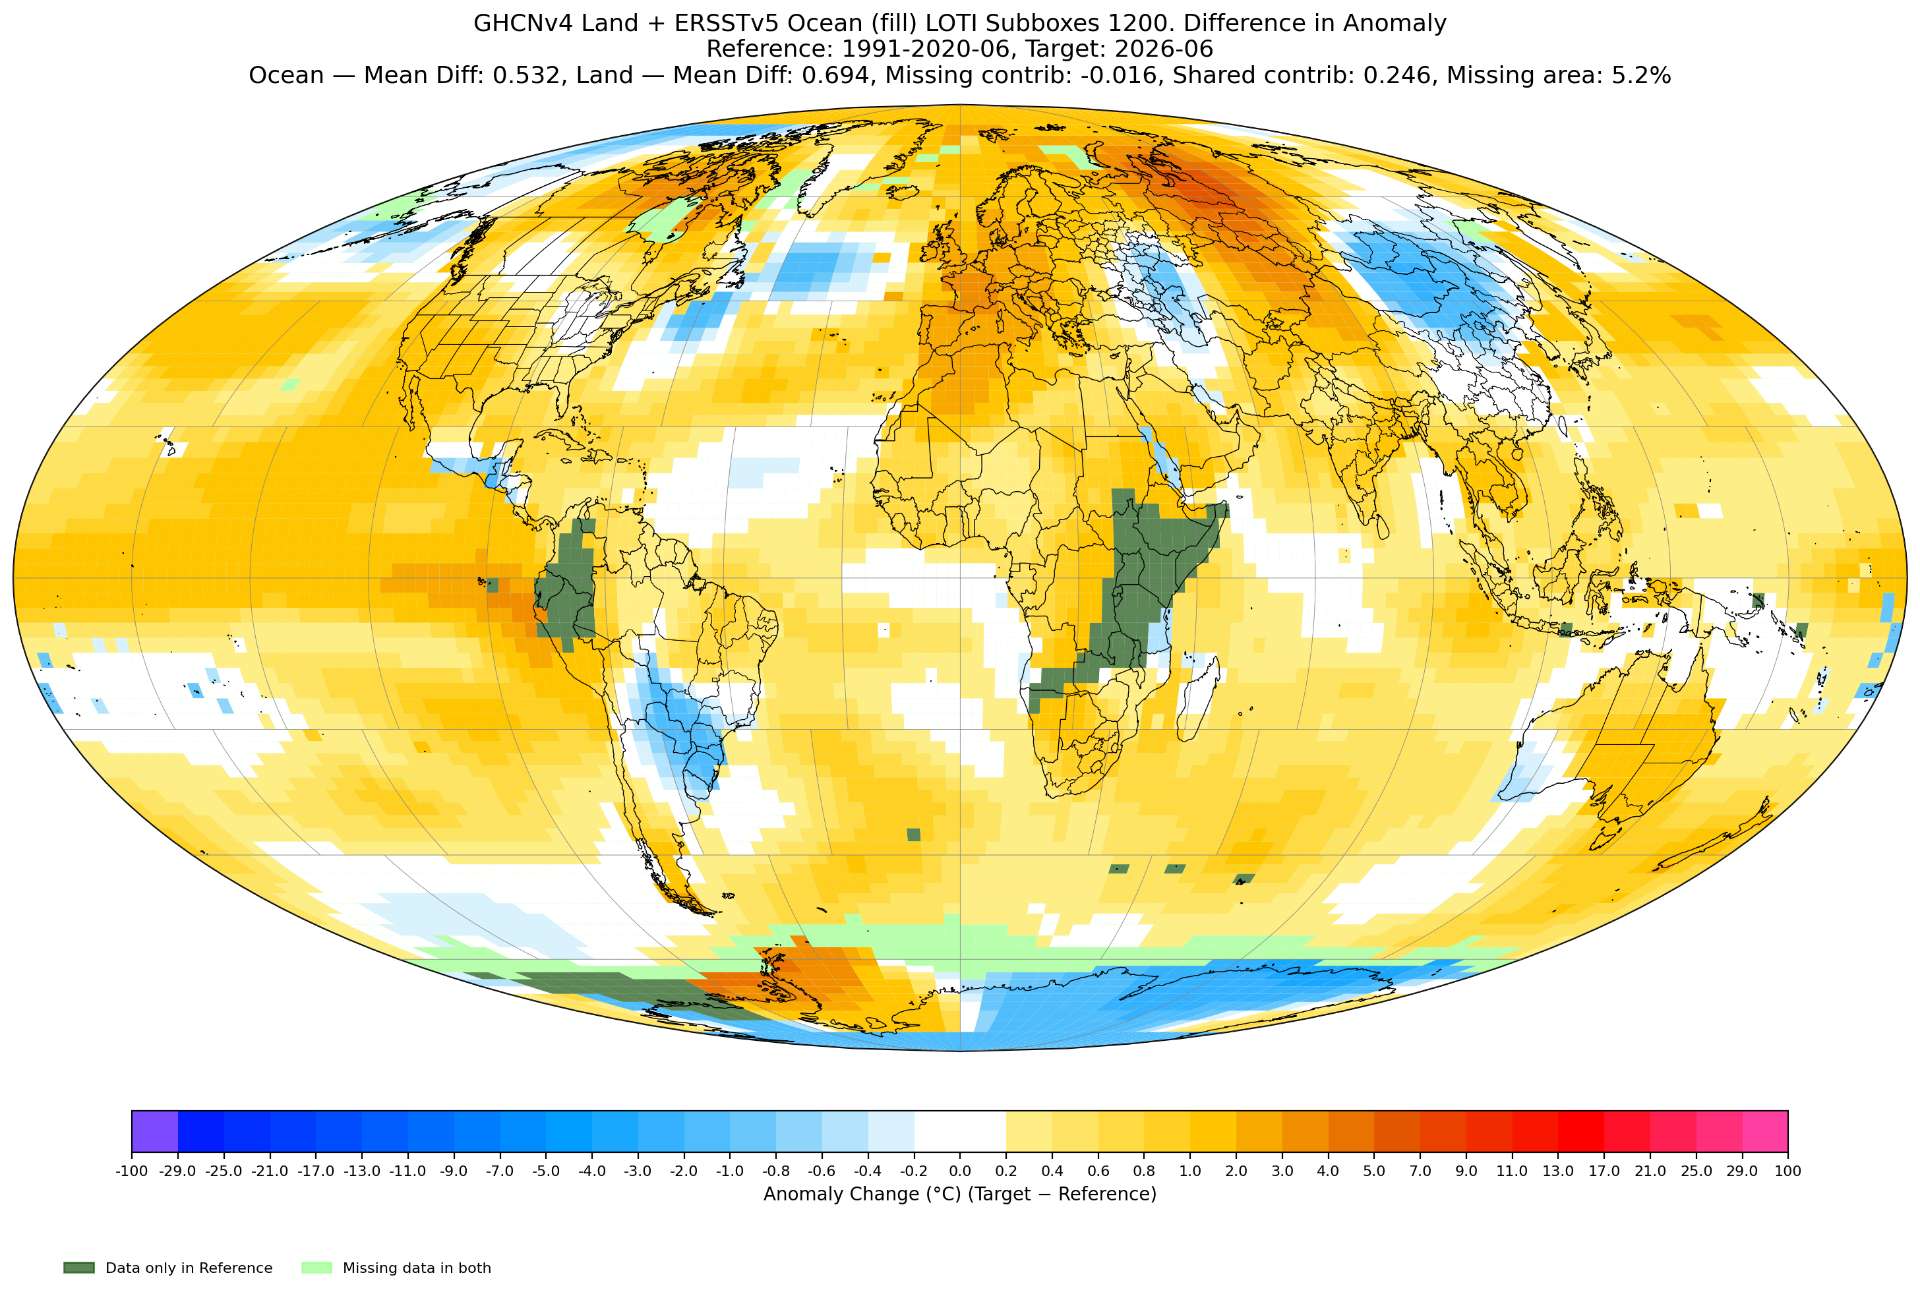
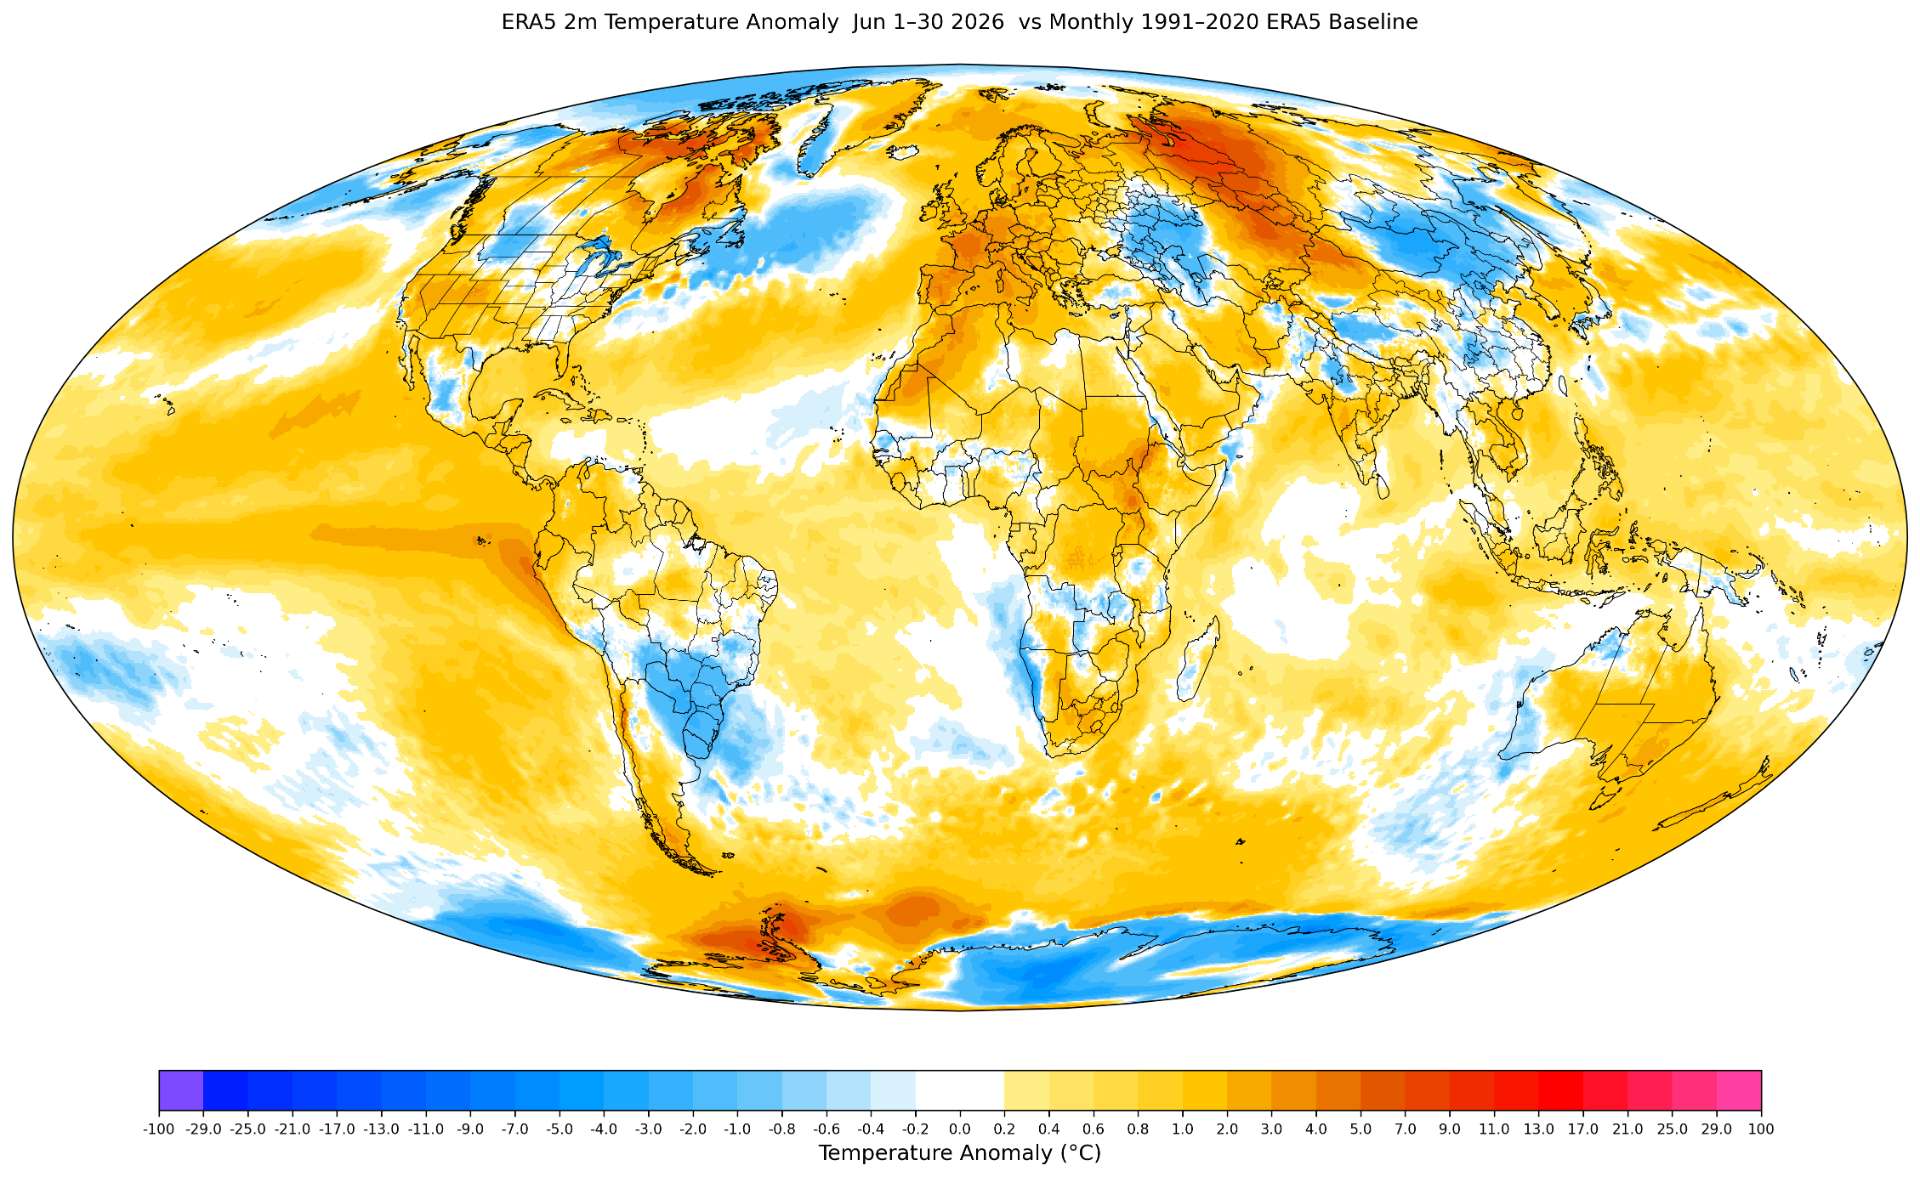
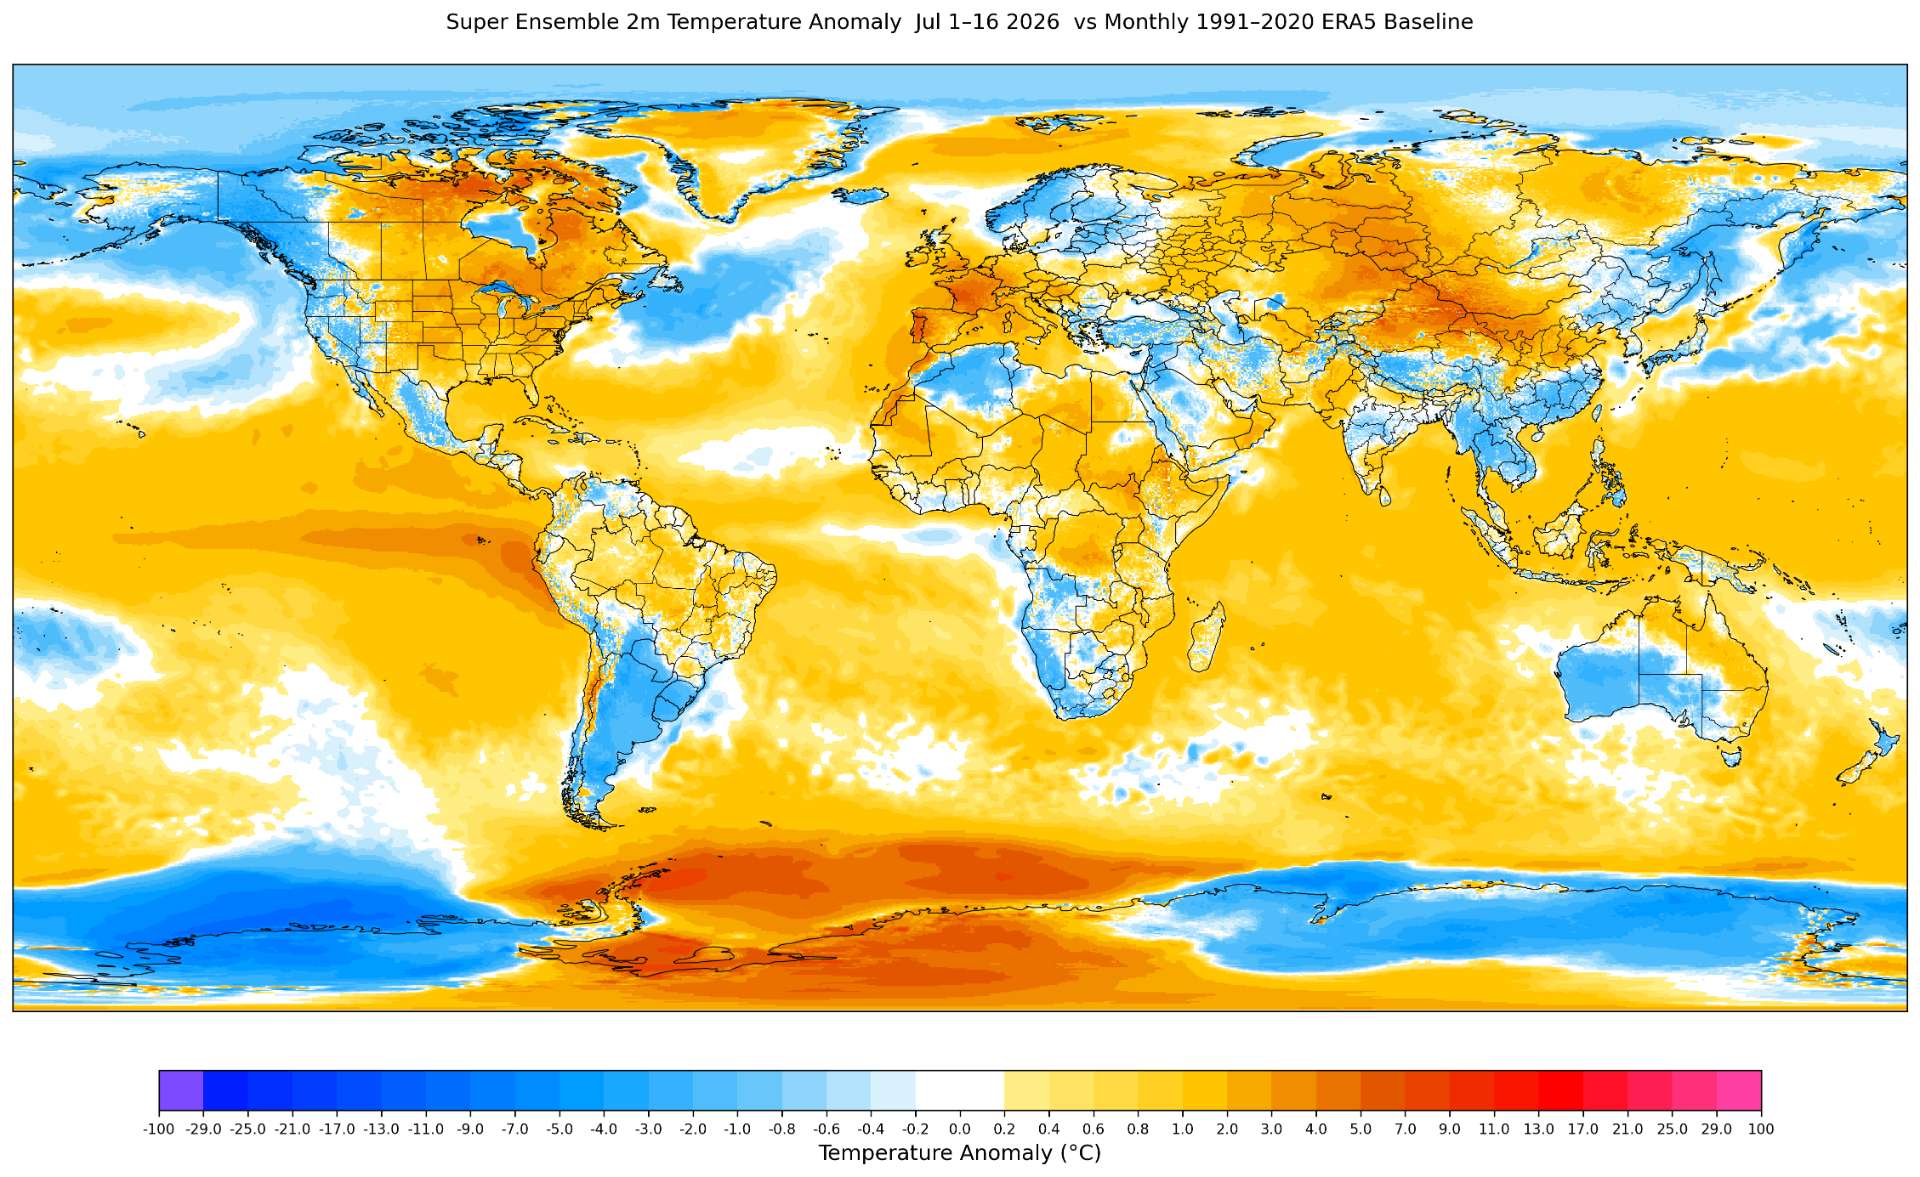
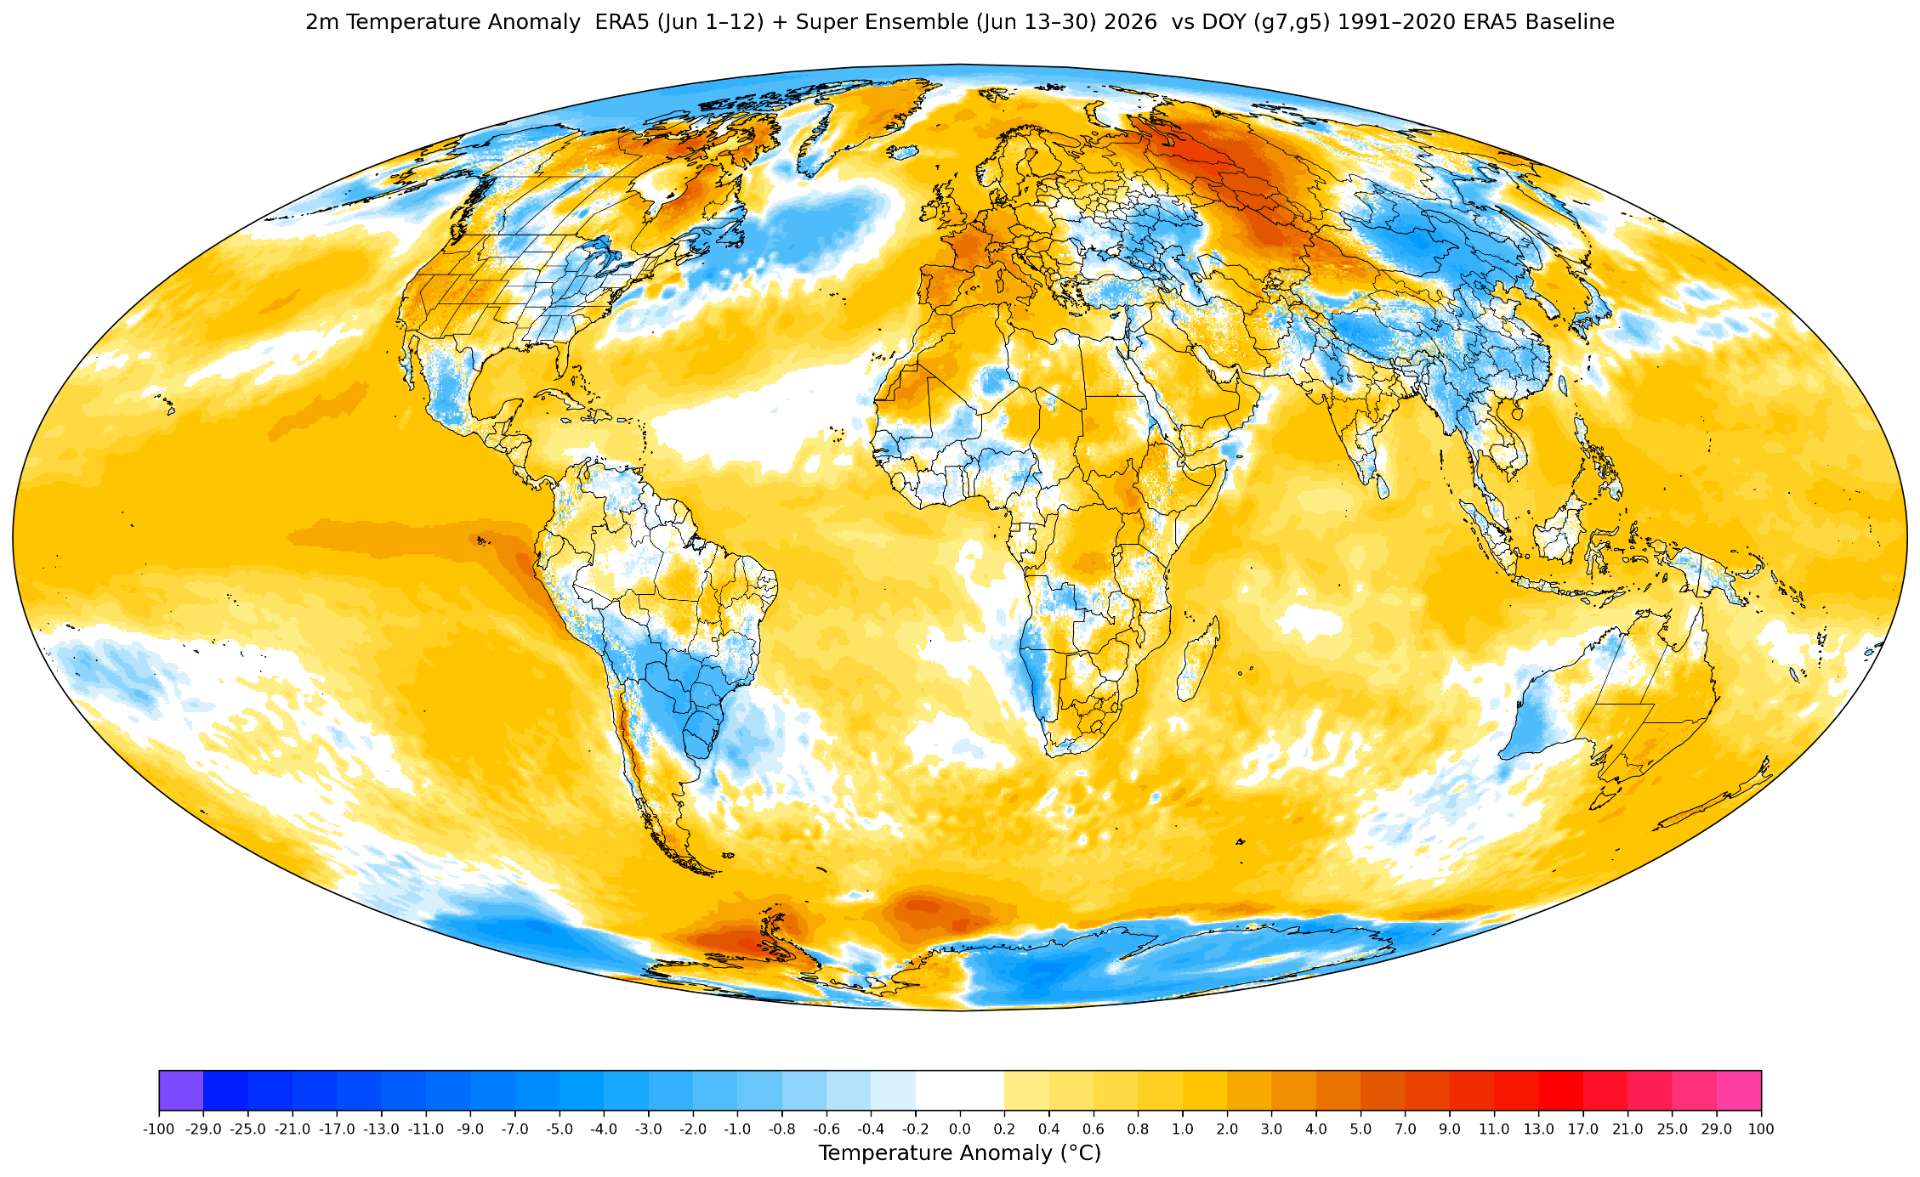
(I've changed all my plots to mollweide (now that the more interactive diagnostic works properly with rectangle selections well for analysis (first image)
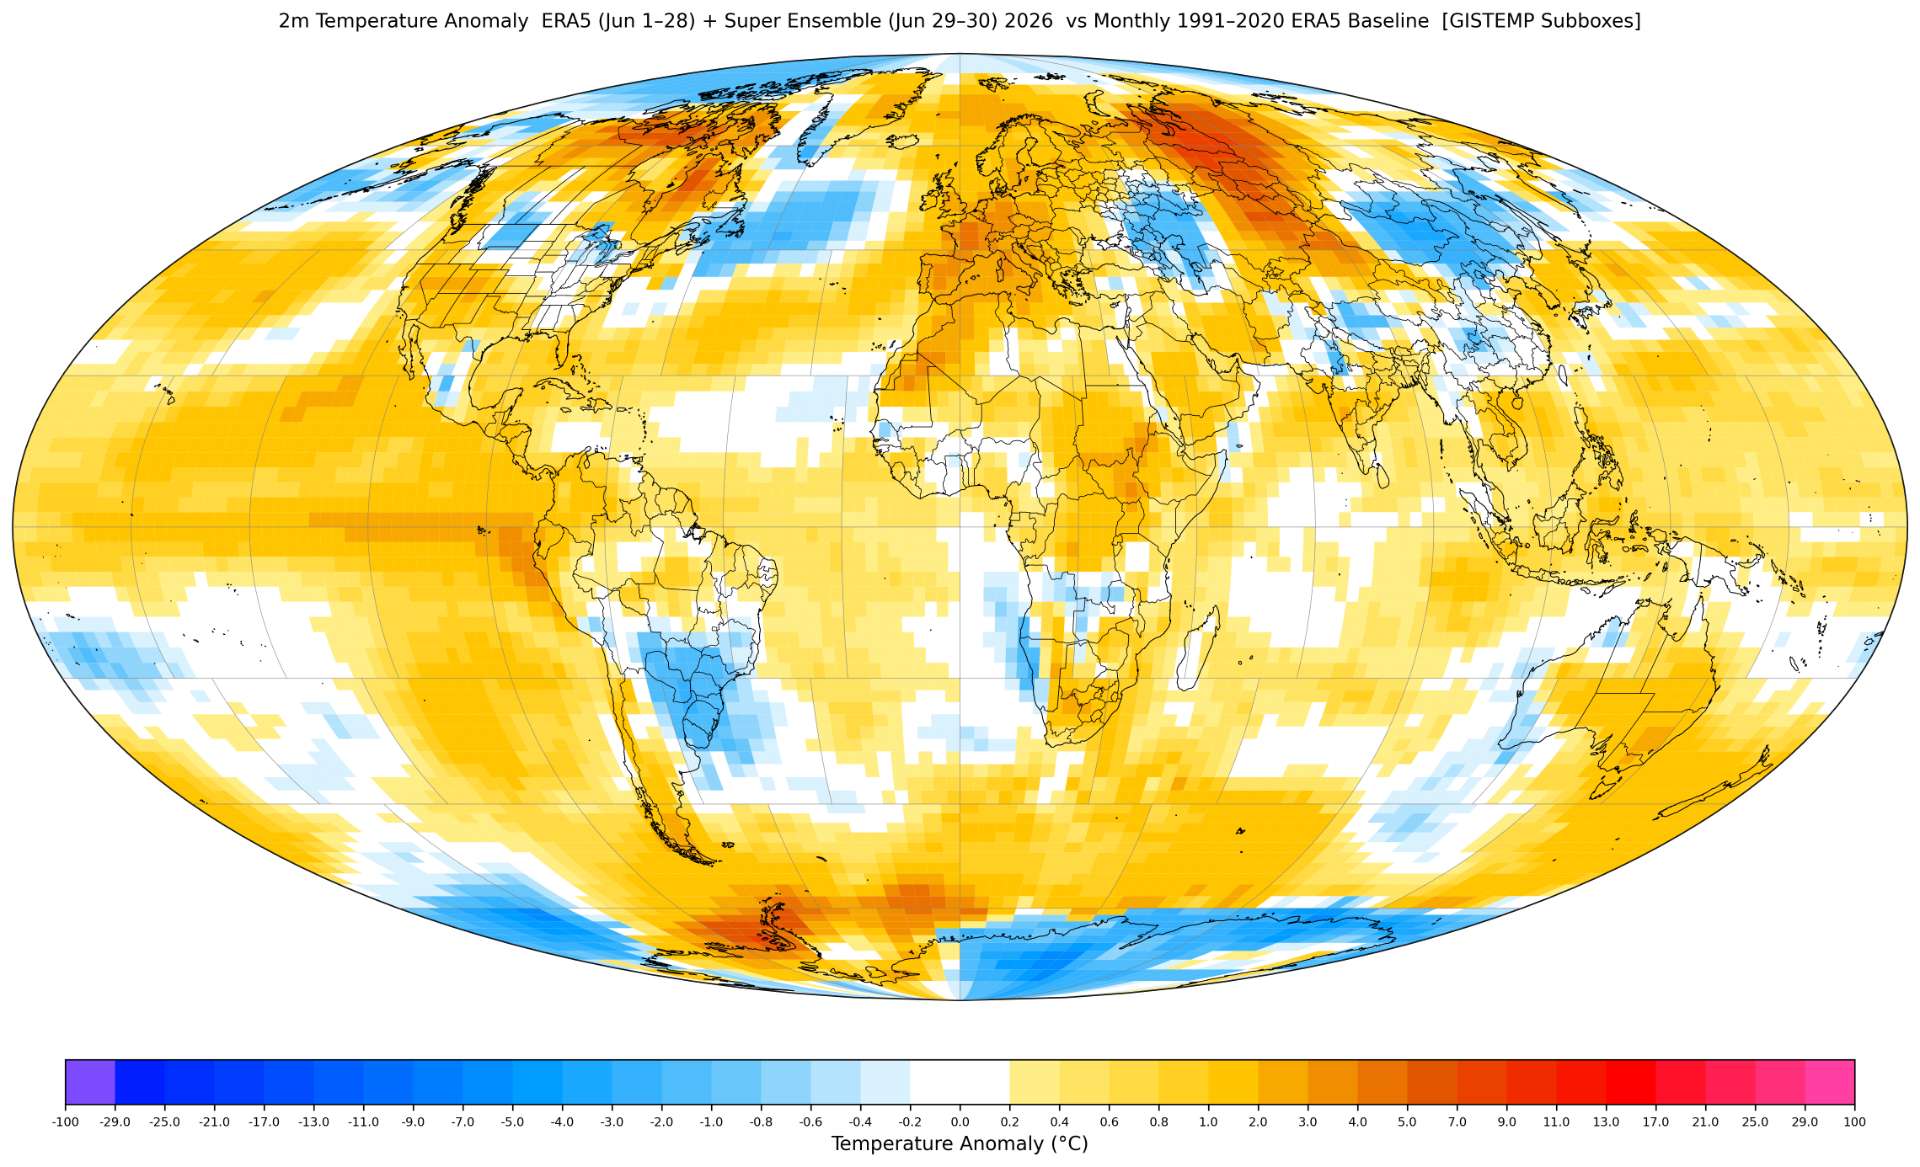
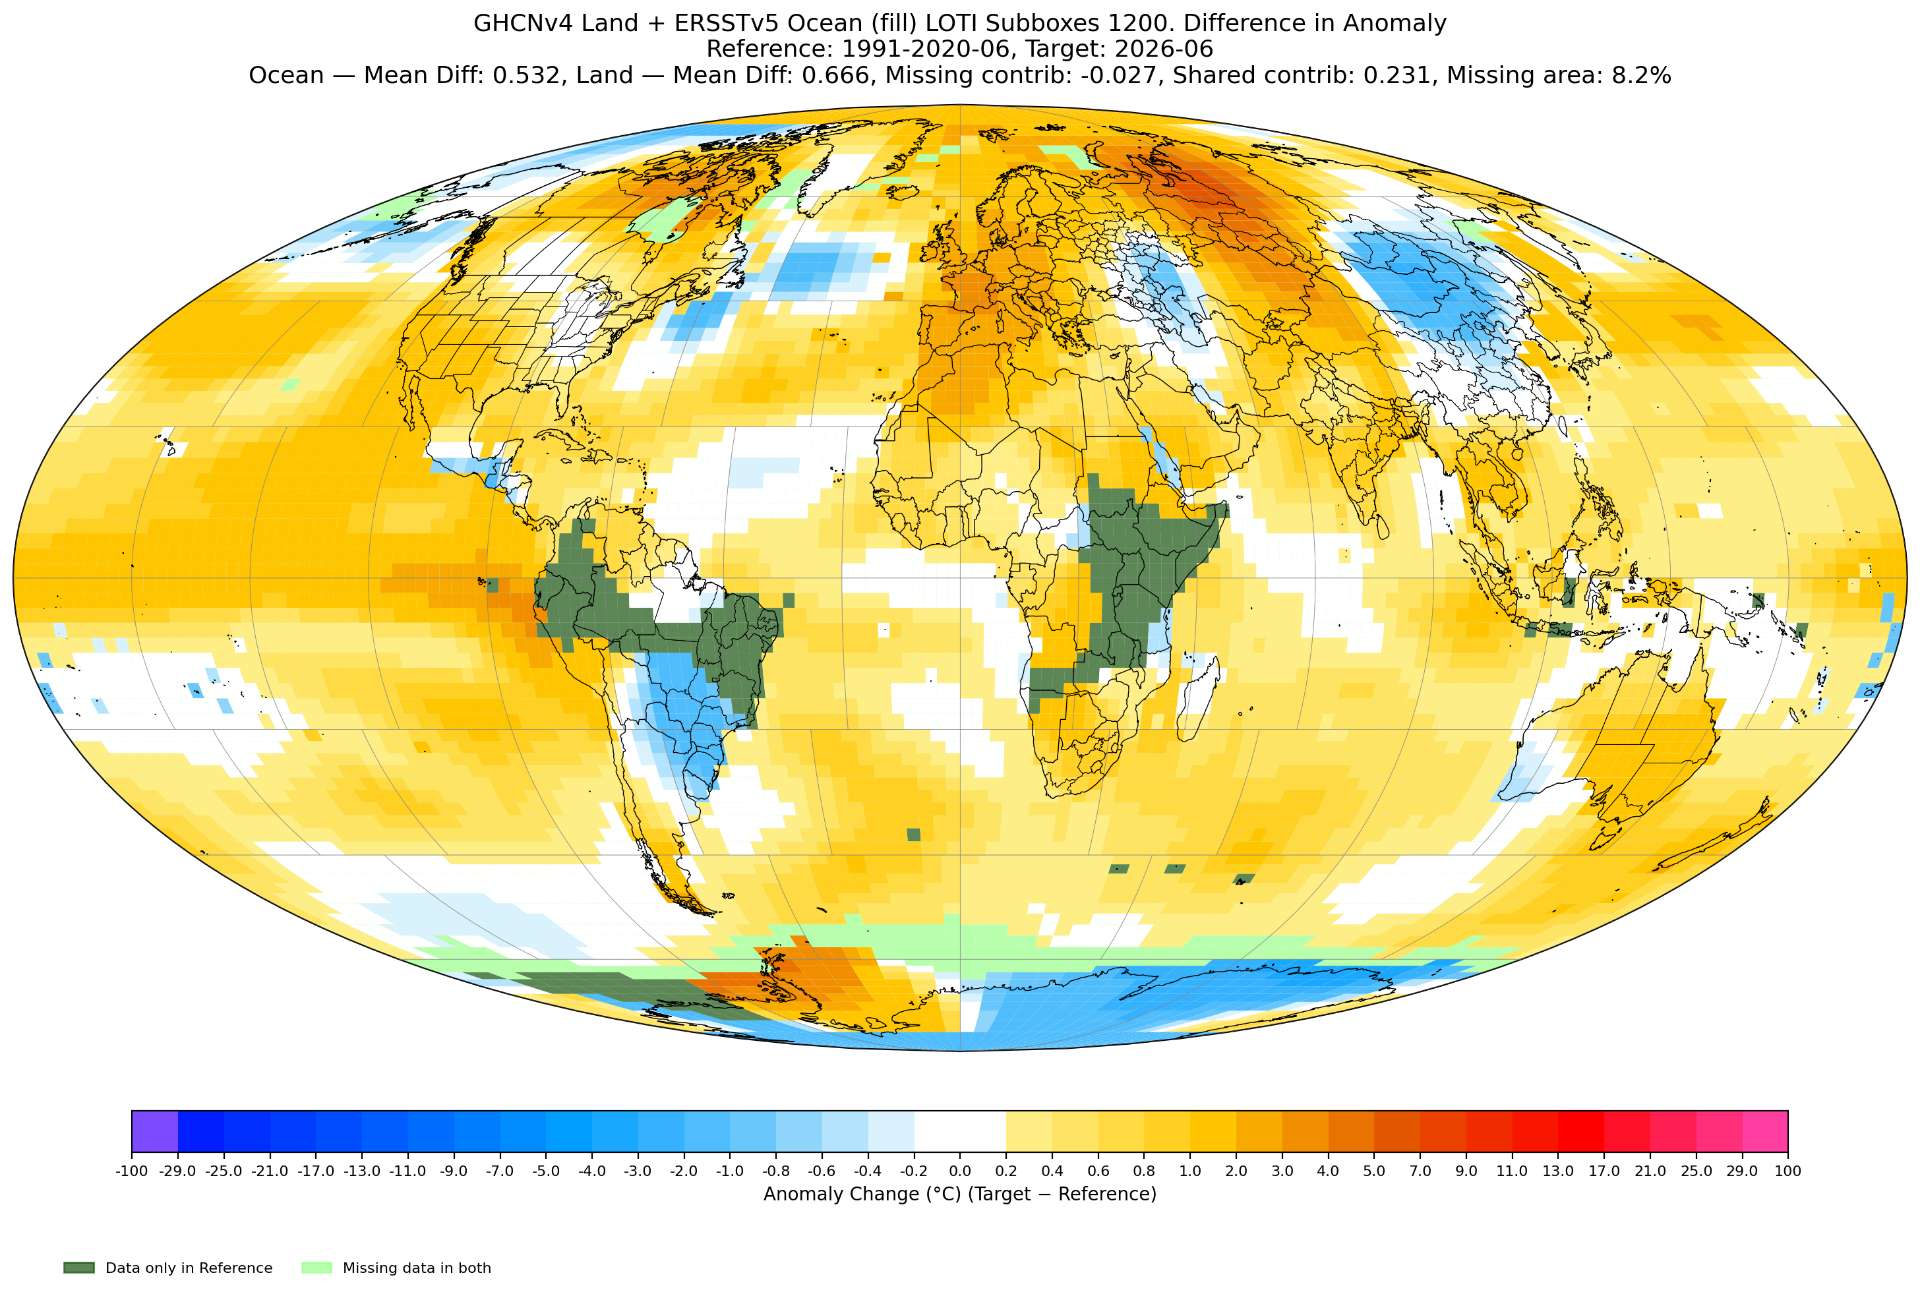
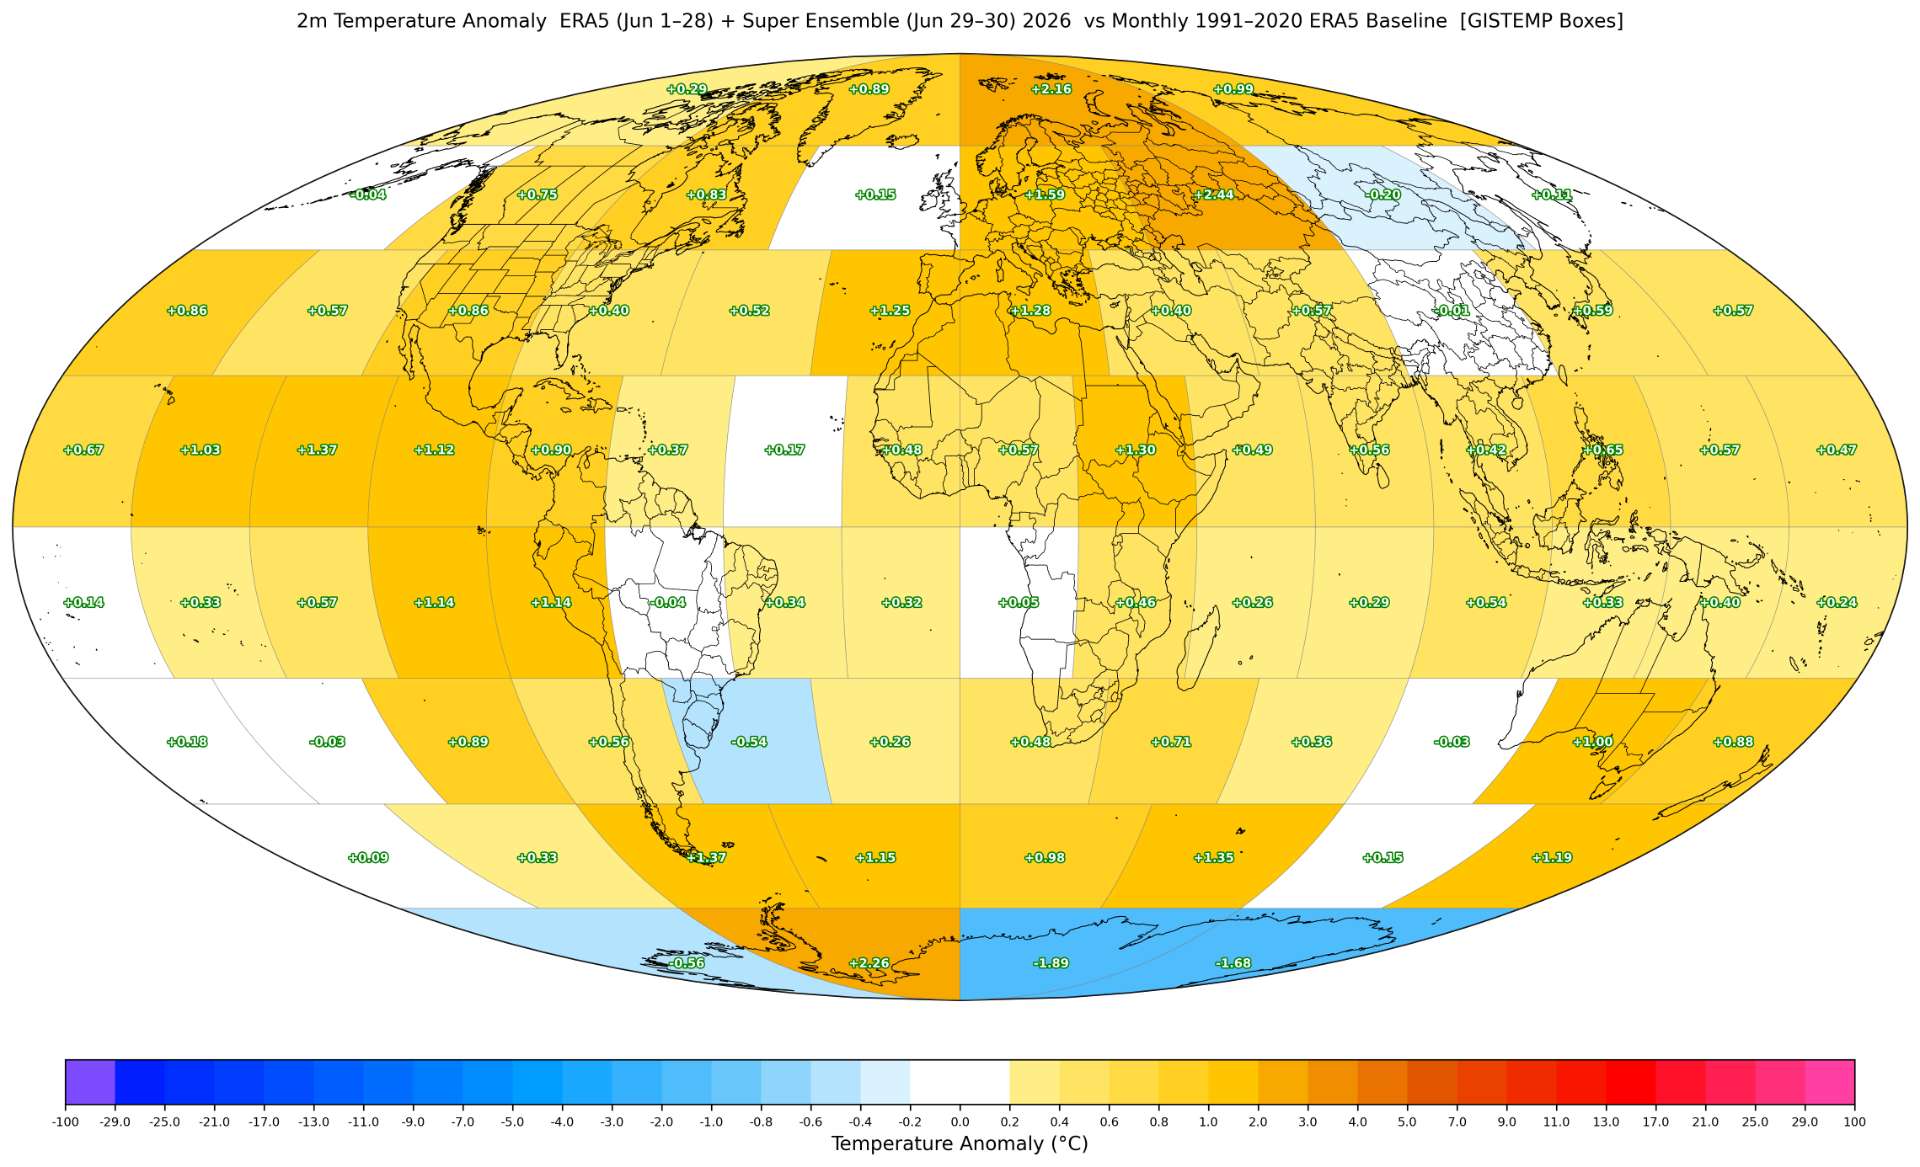
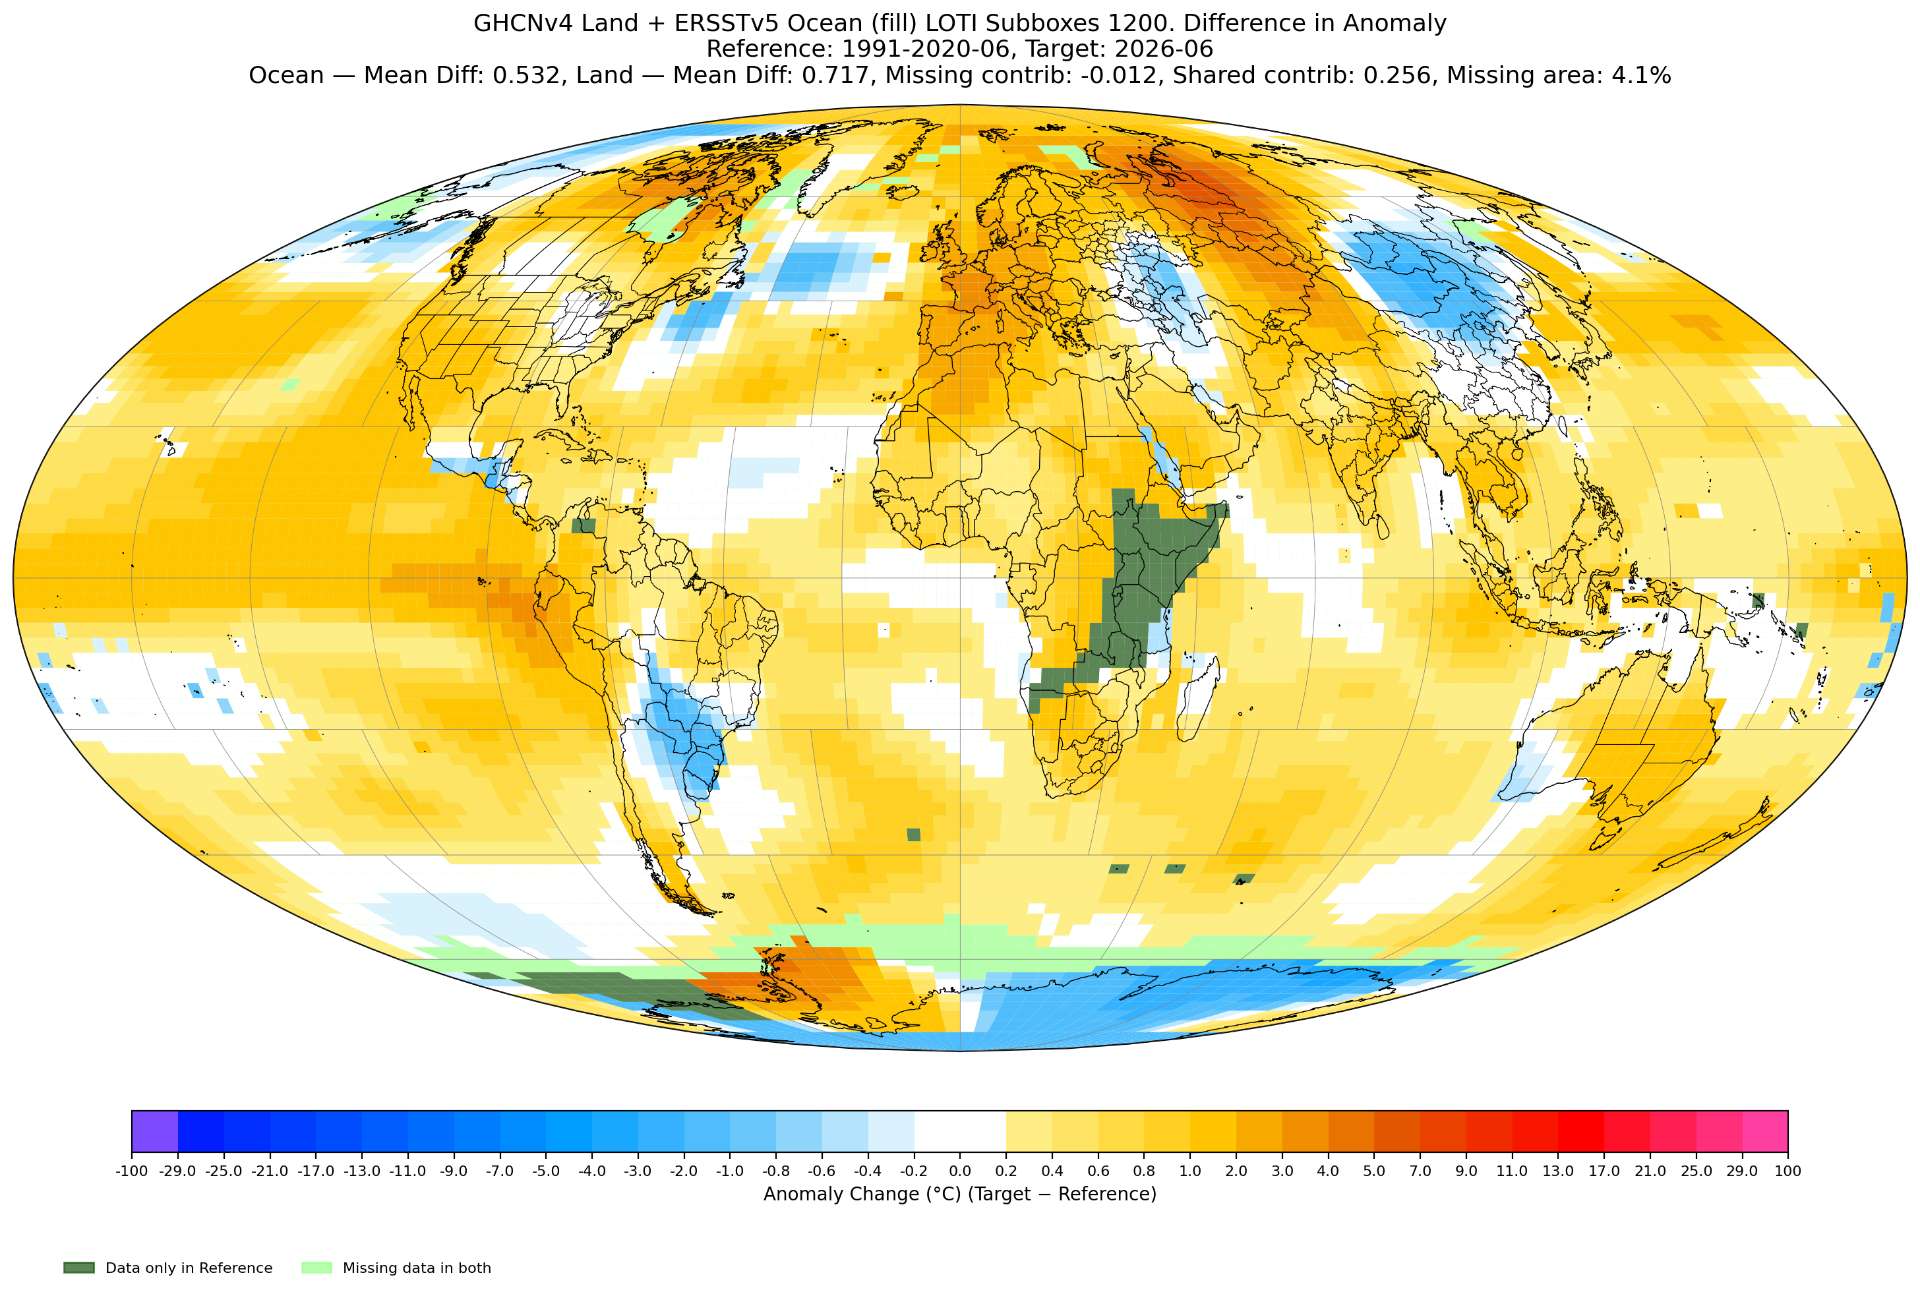
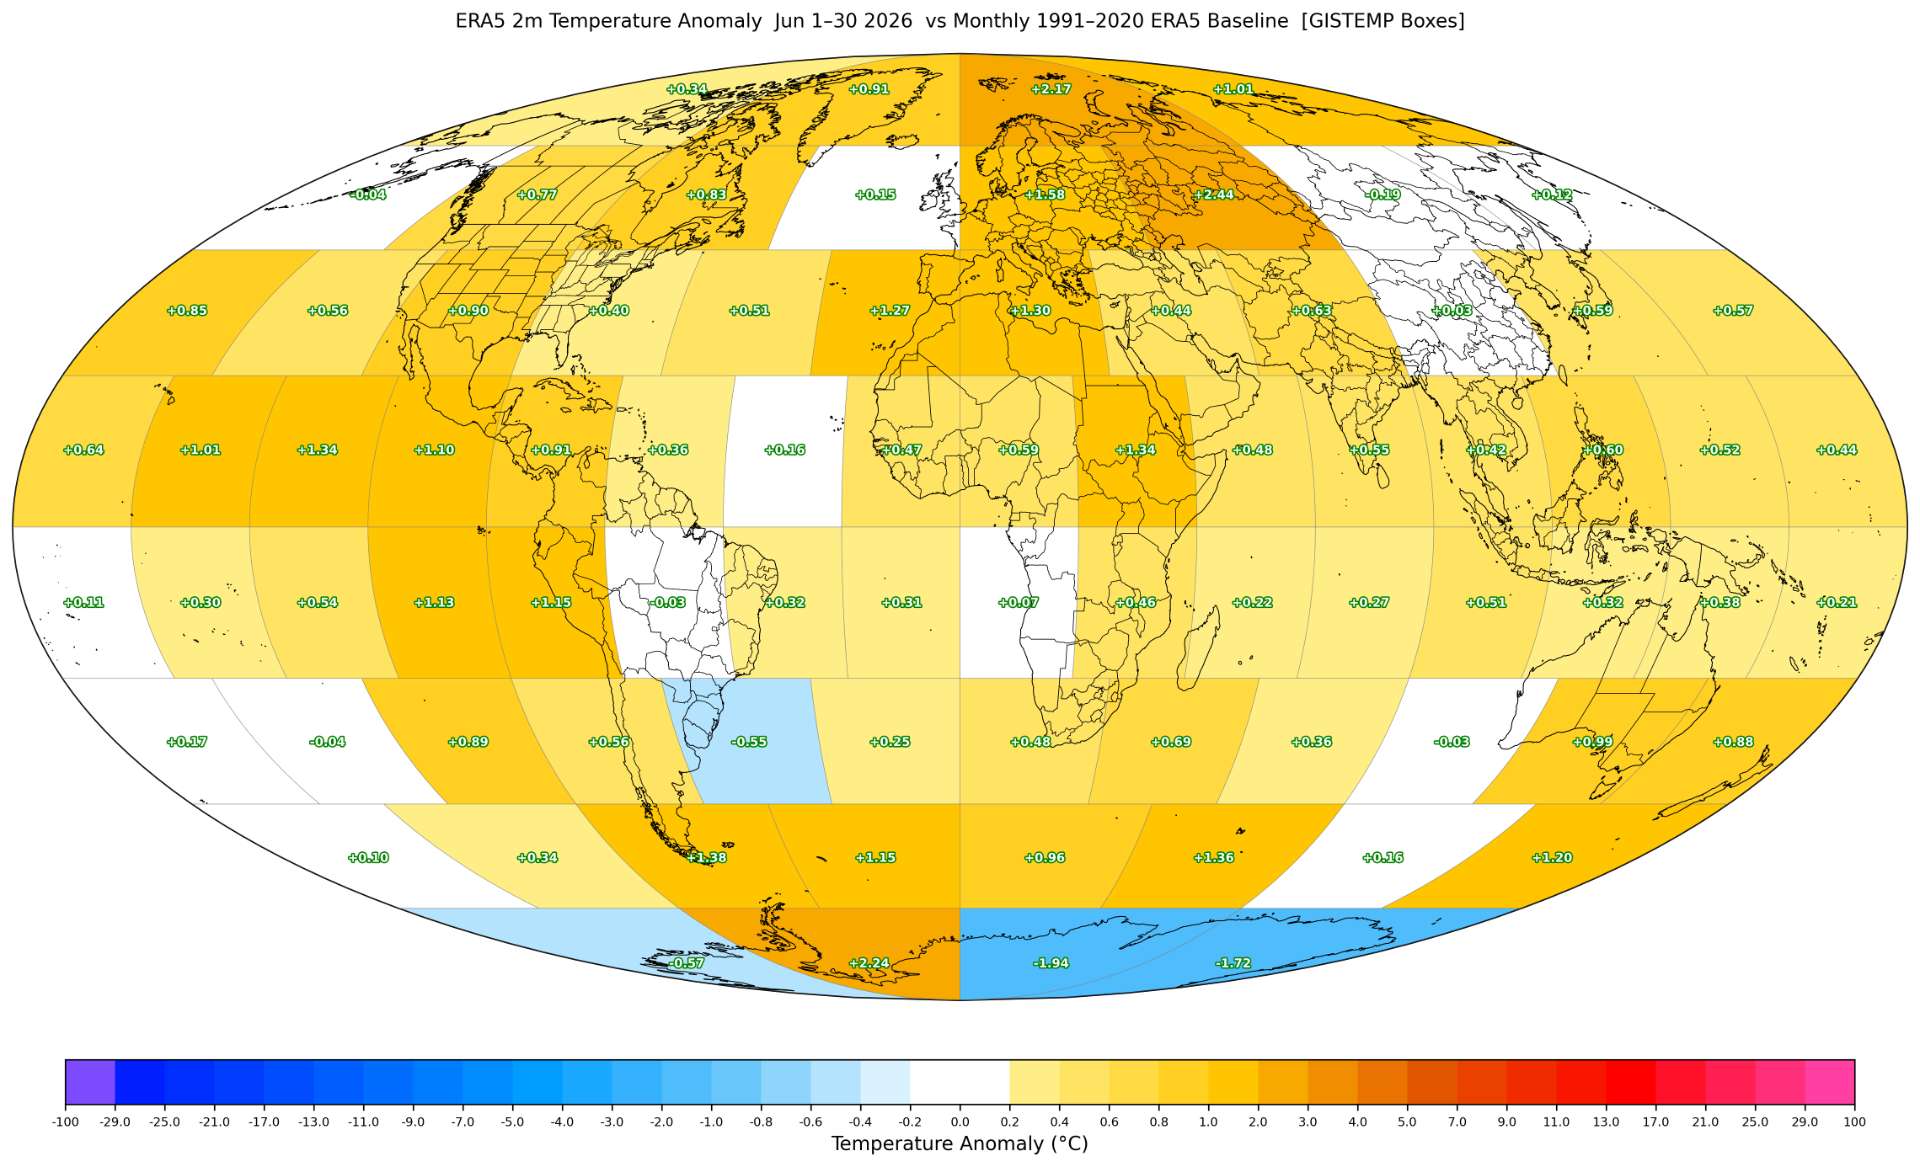
ERA5 comparisons (with some super ensemble) (interpolated to subboxes/boxes using basic means (no fancy comparitive GISTEMP masking)):

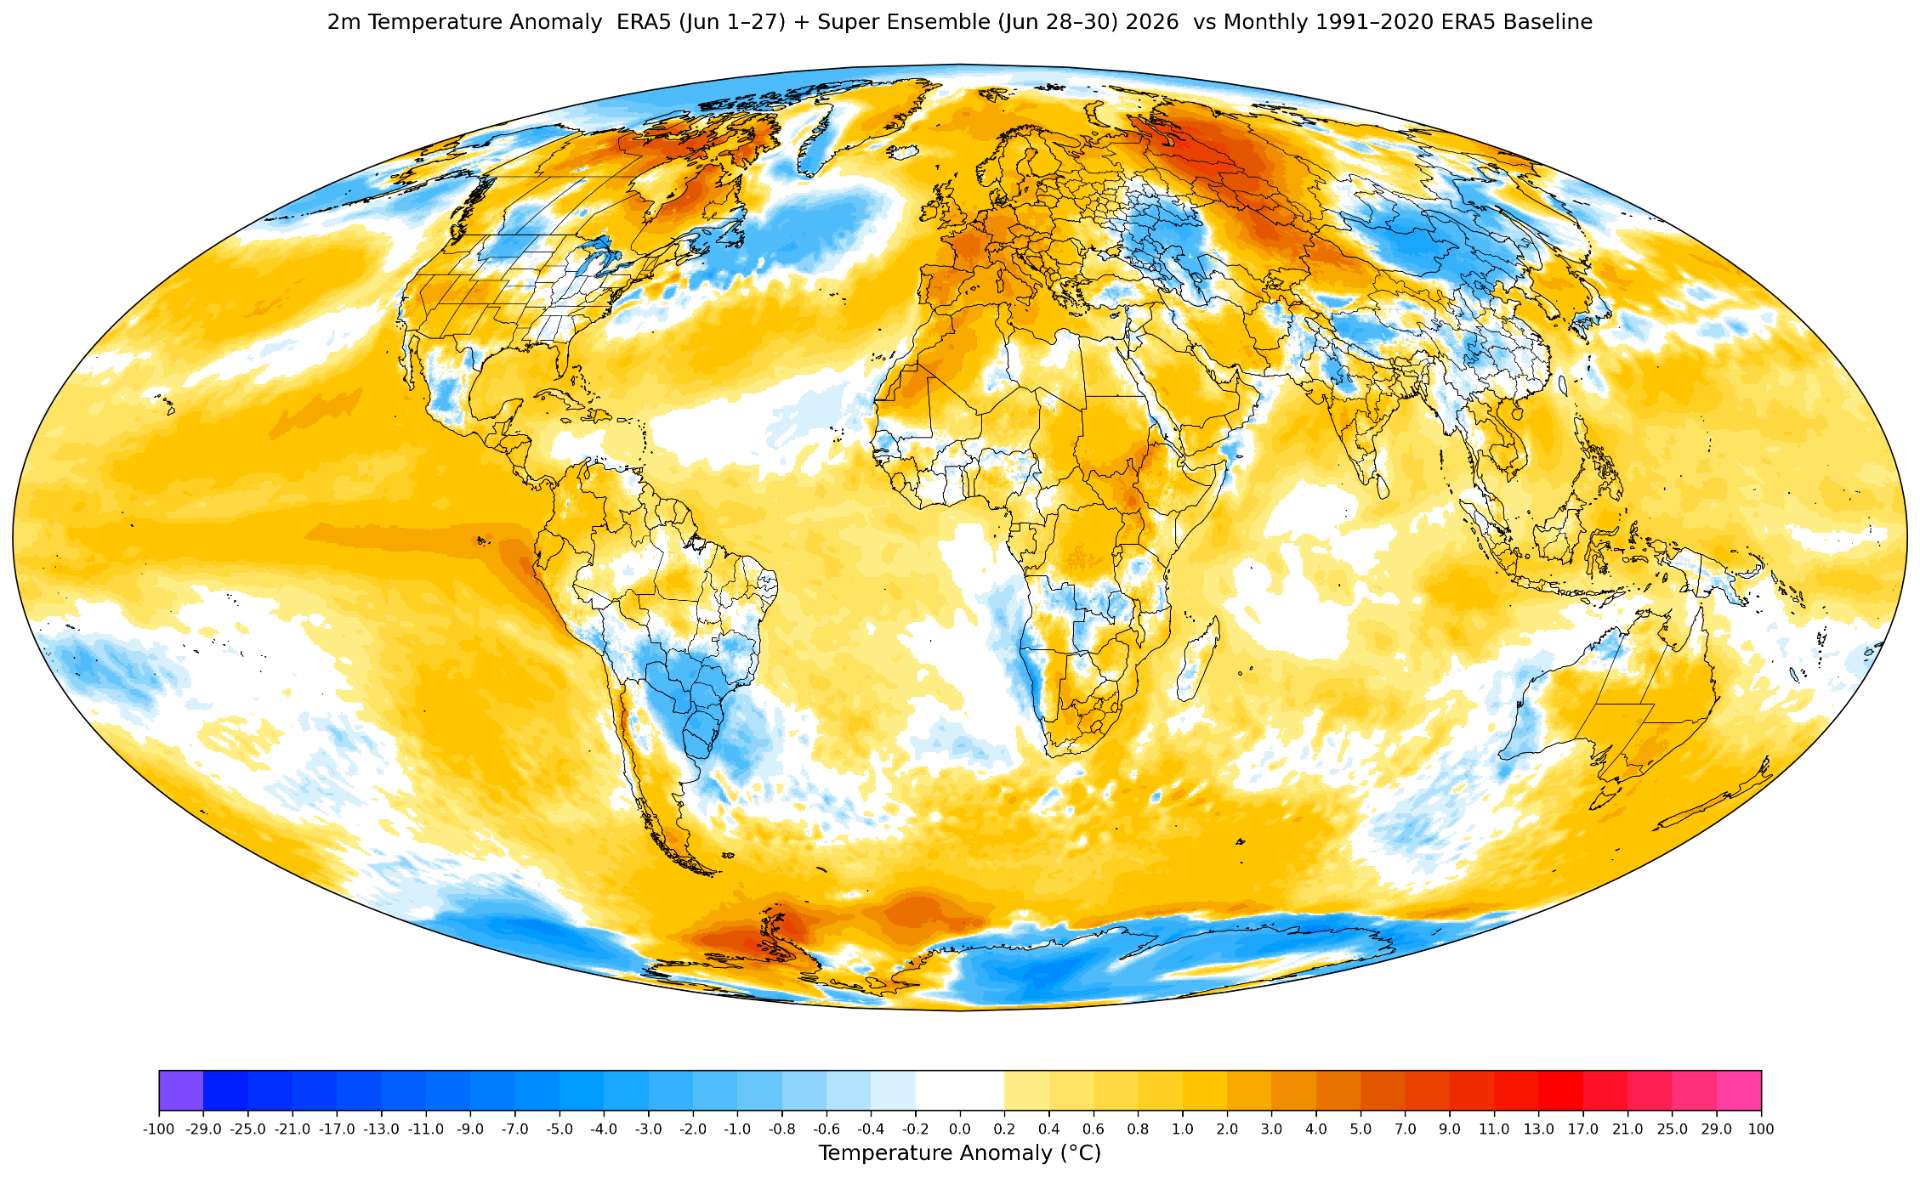
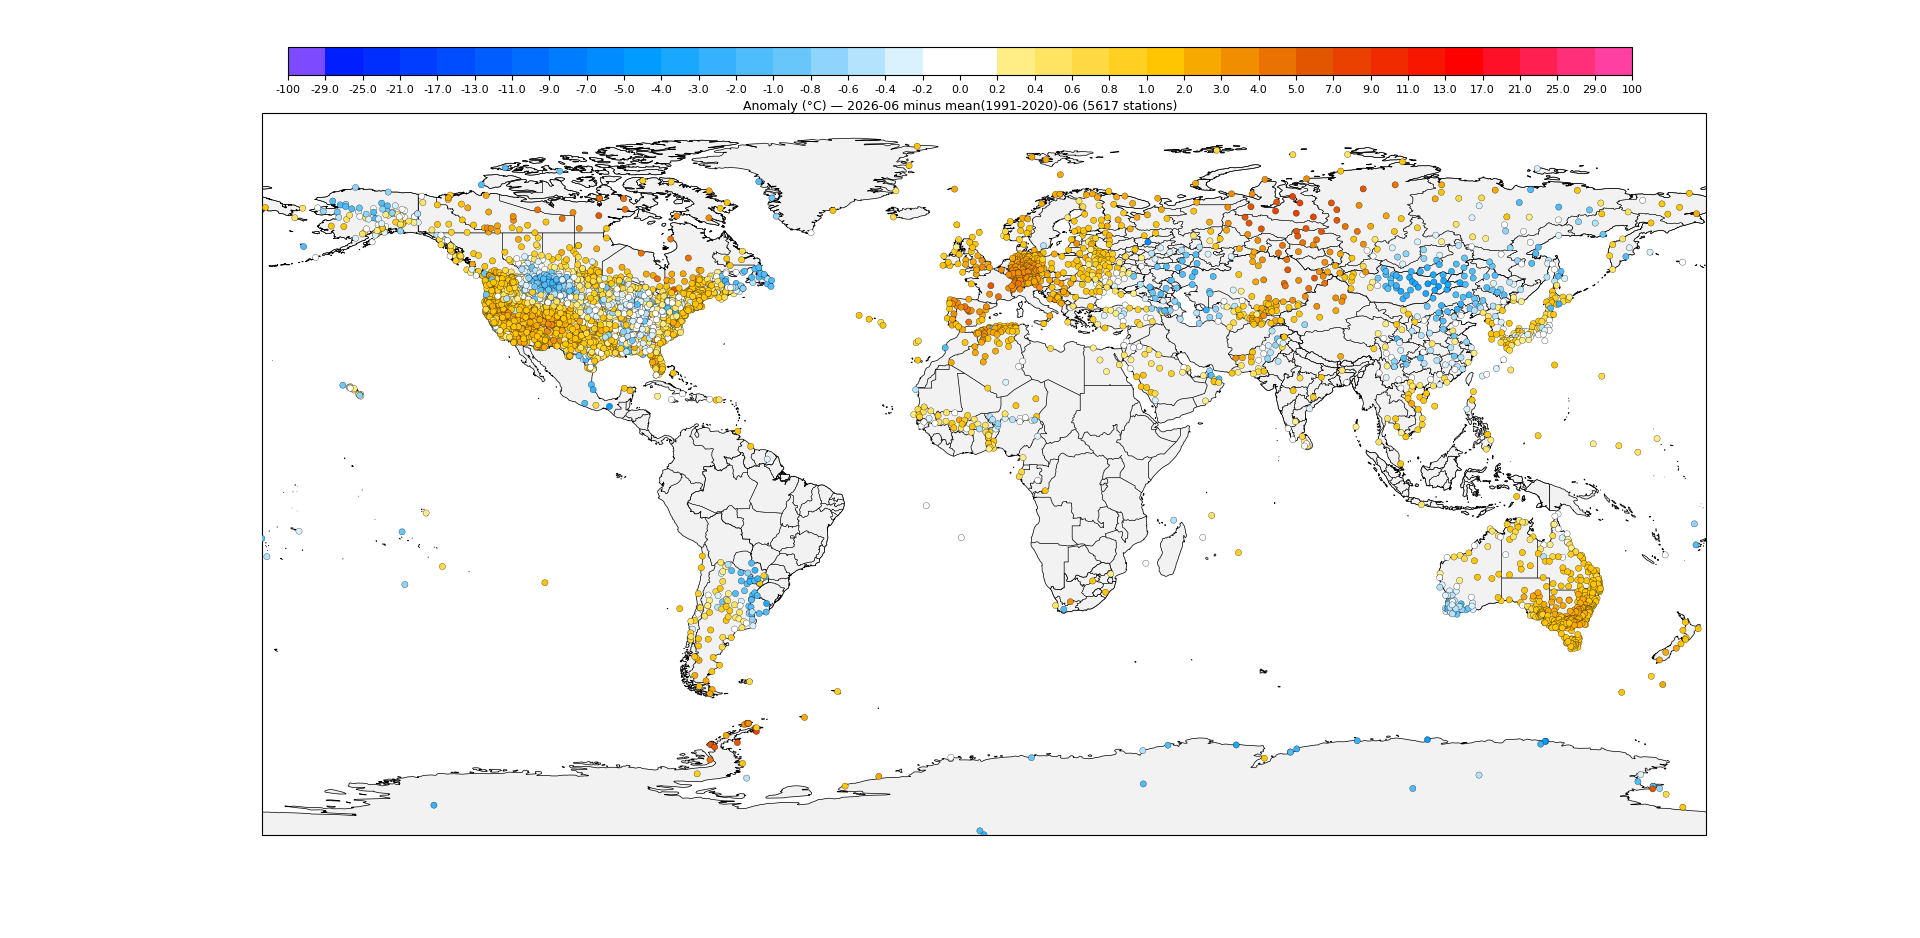
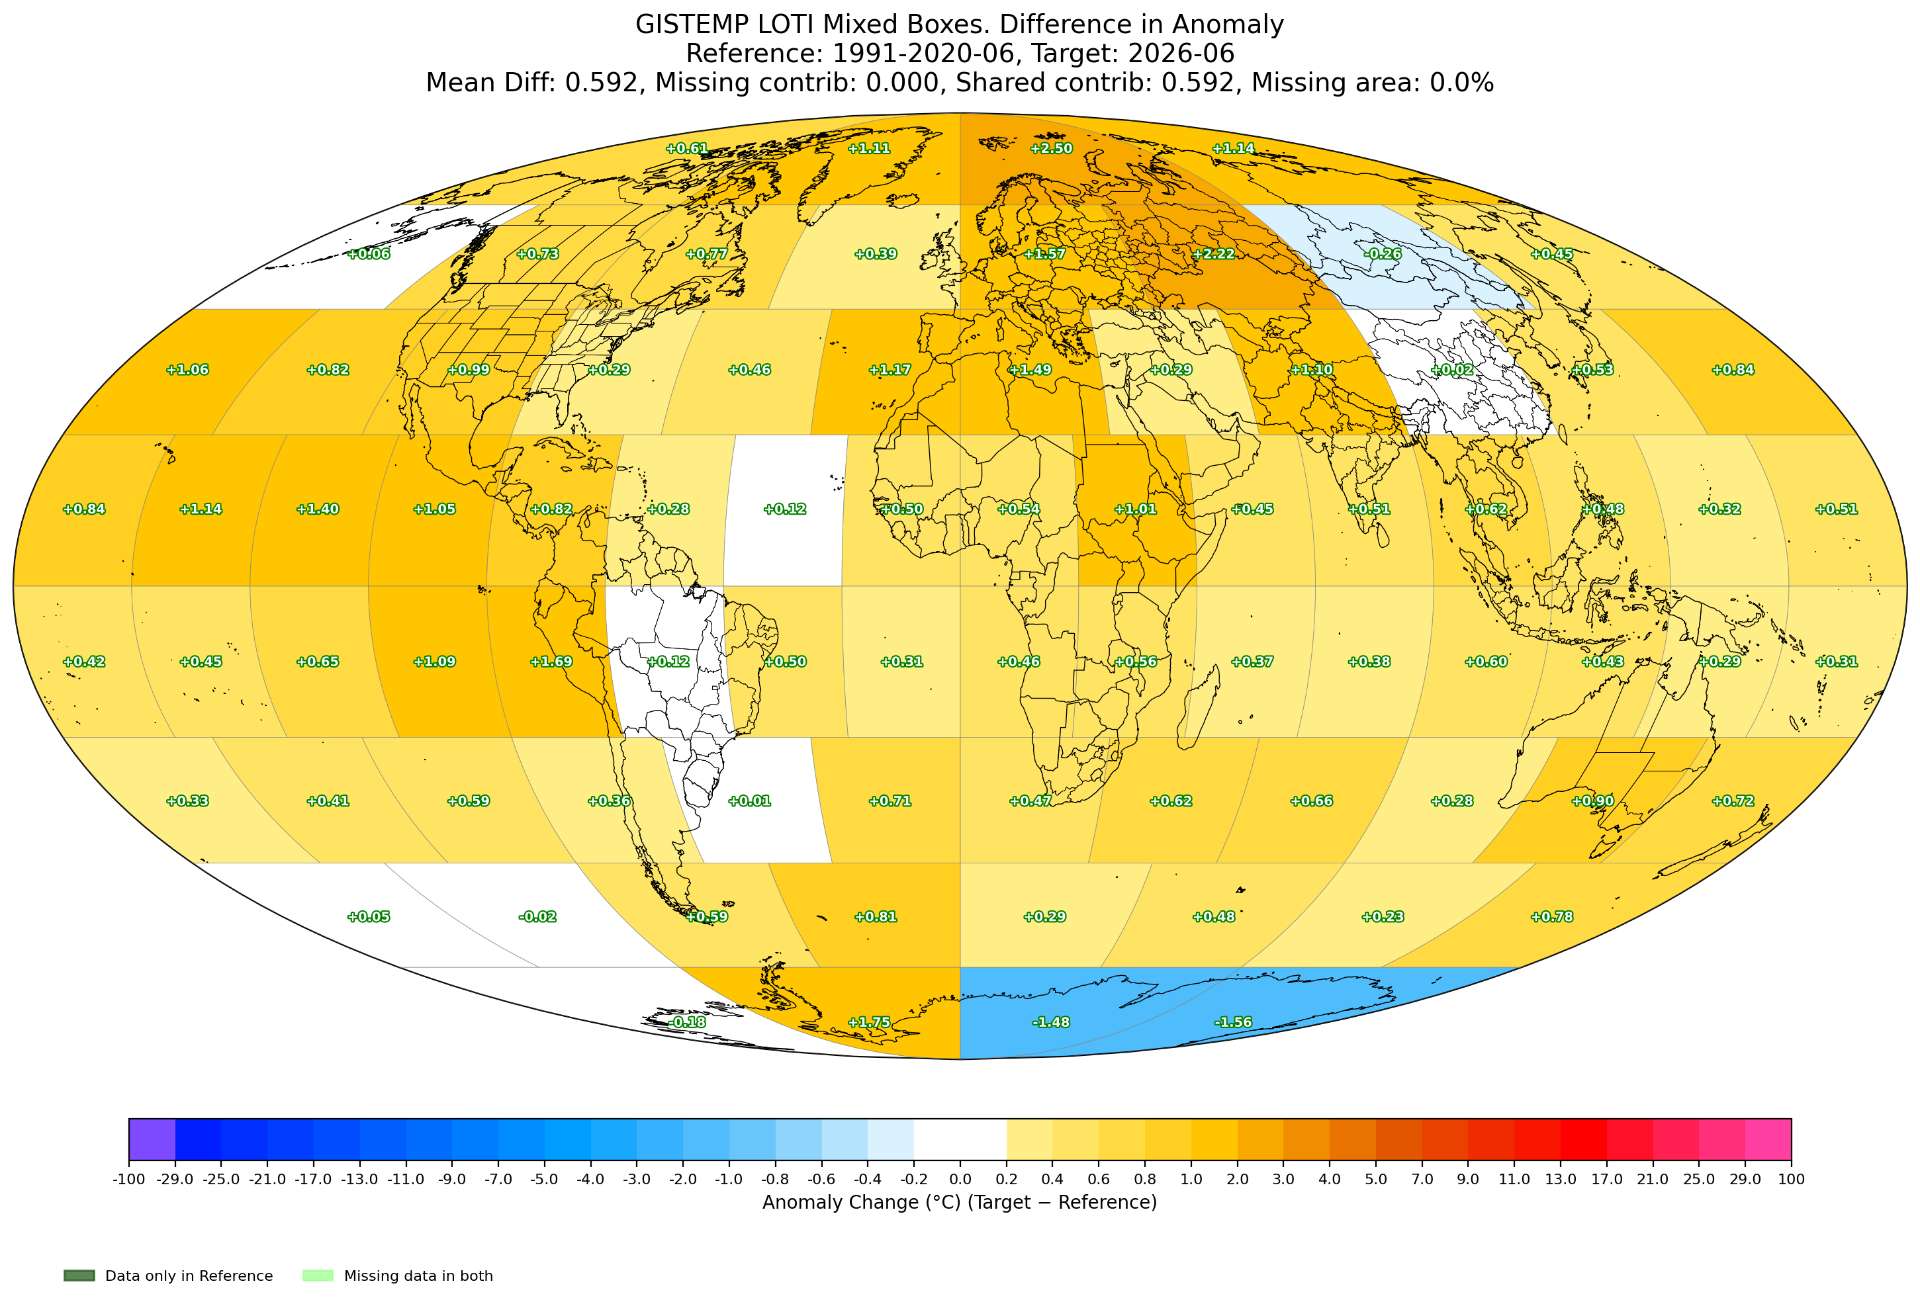
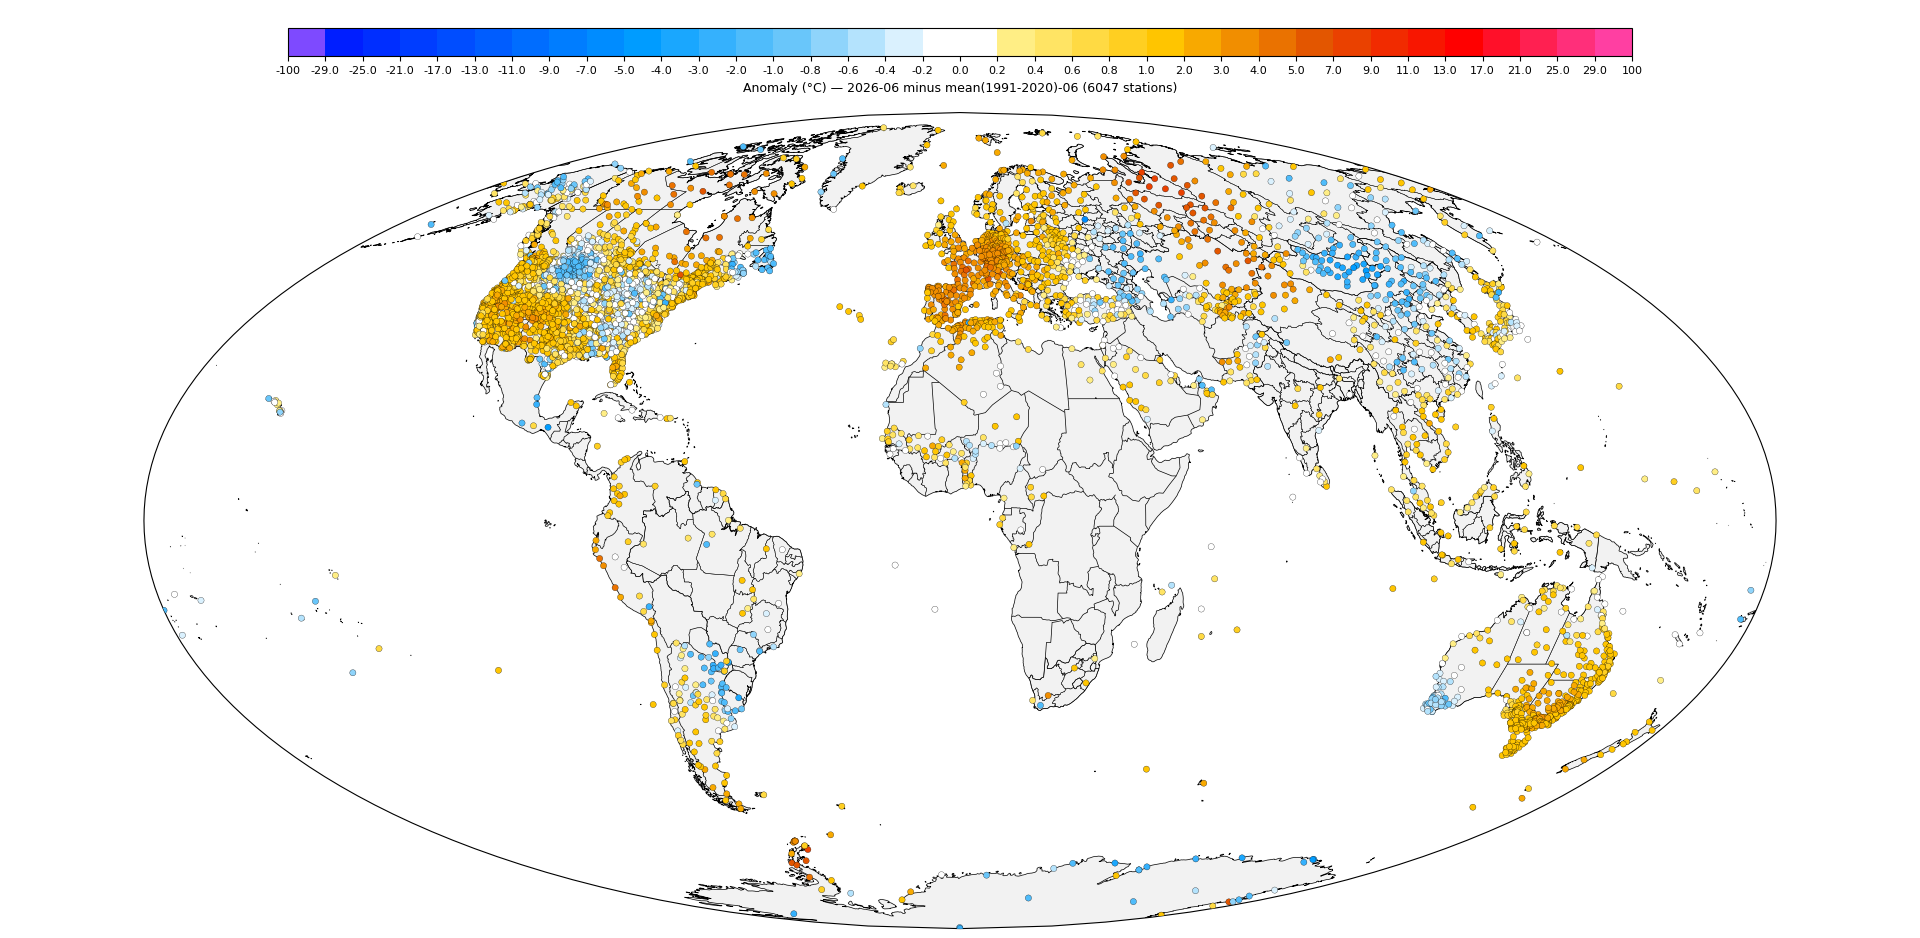
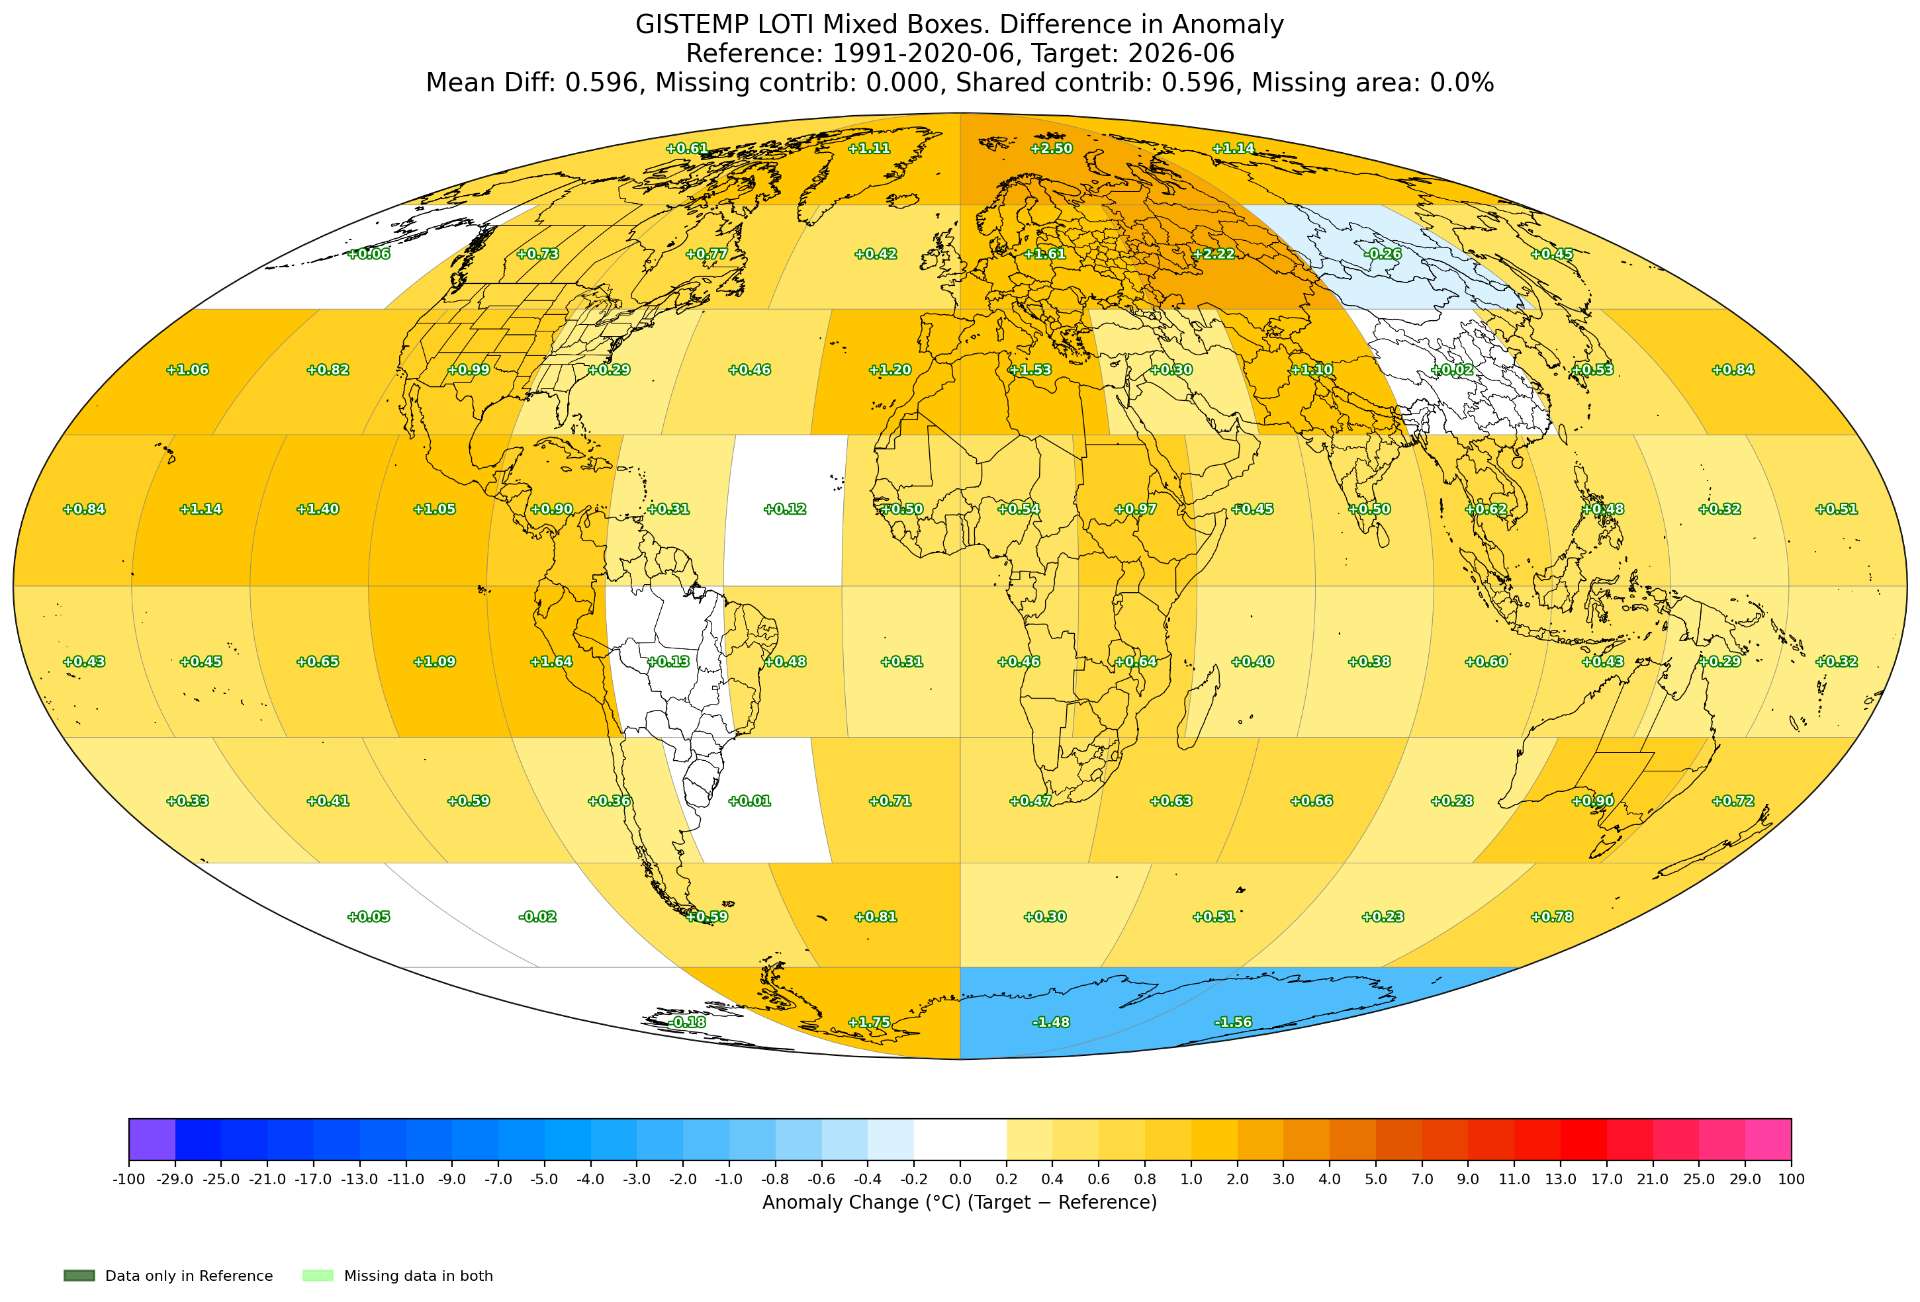
Non-interp regular plot:
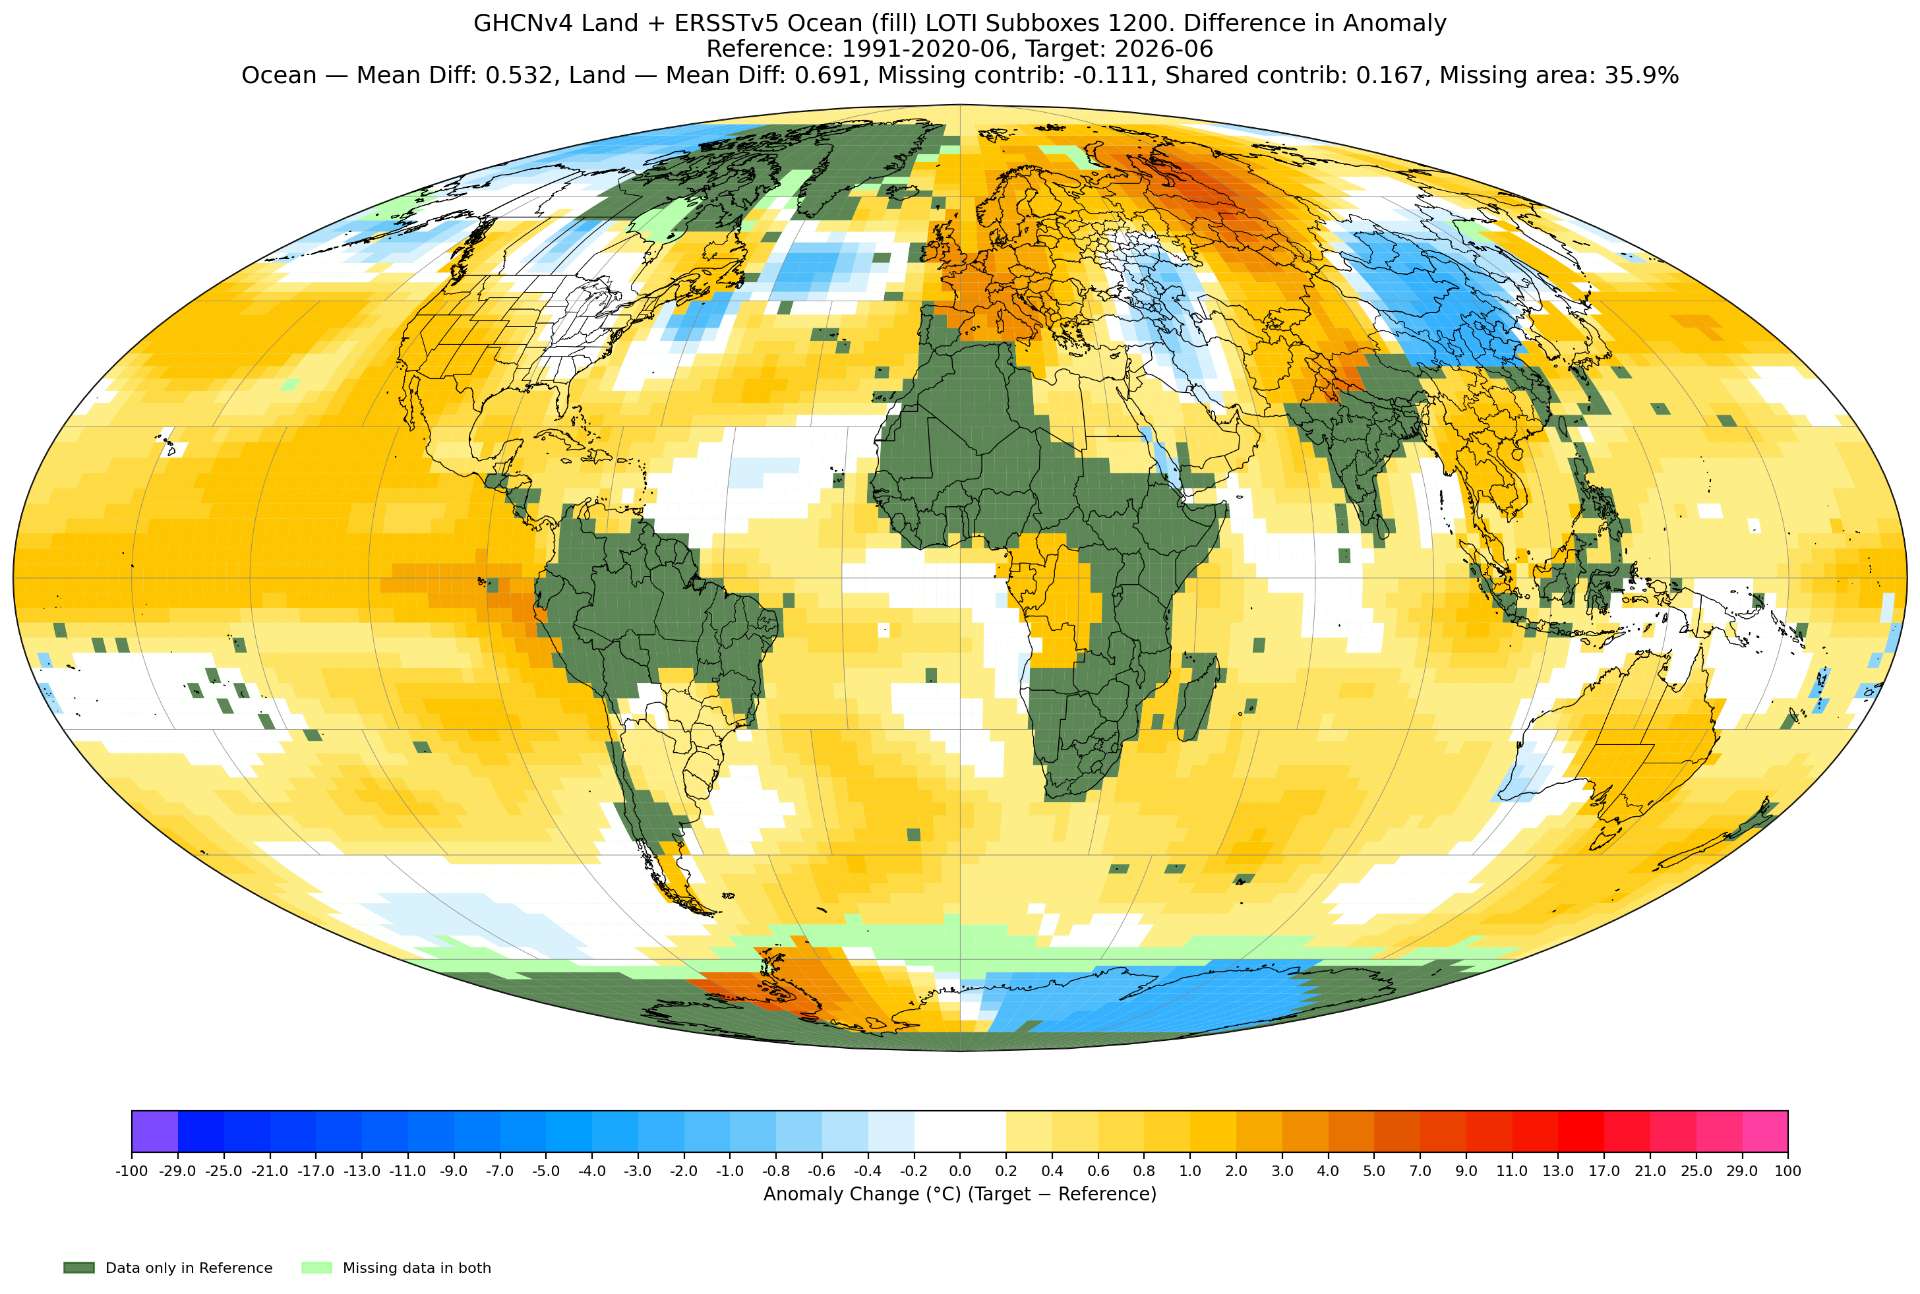
Based on sketchy code for a (weighted version) of the box deltas (contributing station counts per subbox (modified gistemp code) in terms of an ad-hoc subbox-station quality measure for each calendar month and point in time (ECDF in a window) formulated using land subbox ratio (/ land+ocean subboxes -- ) ...
I'm not expecting the temps to rise... I've increased my bankroll based on this analysis and that we have only 4-5 days left or so.
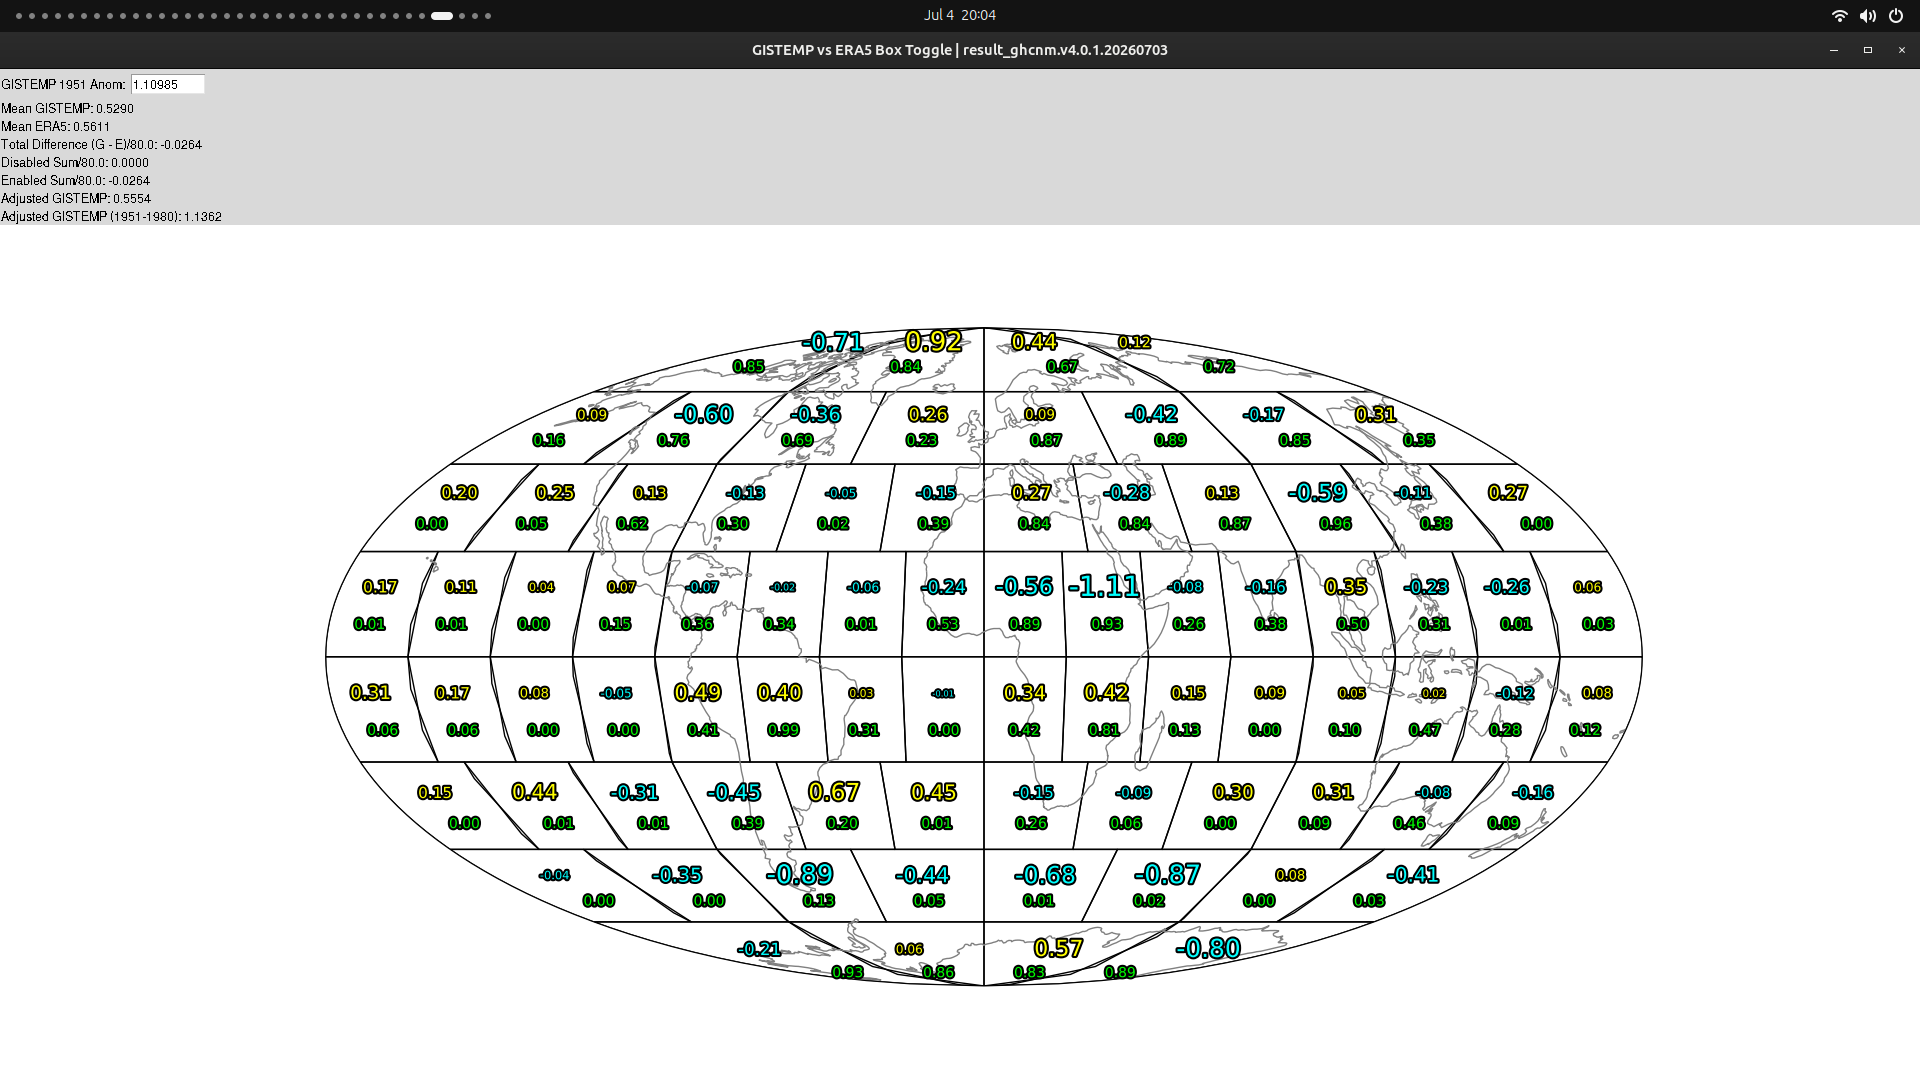
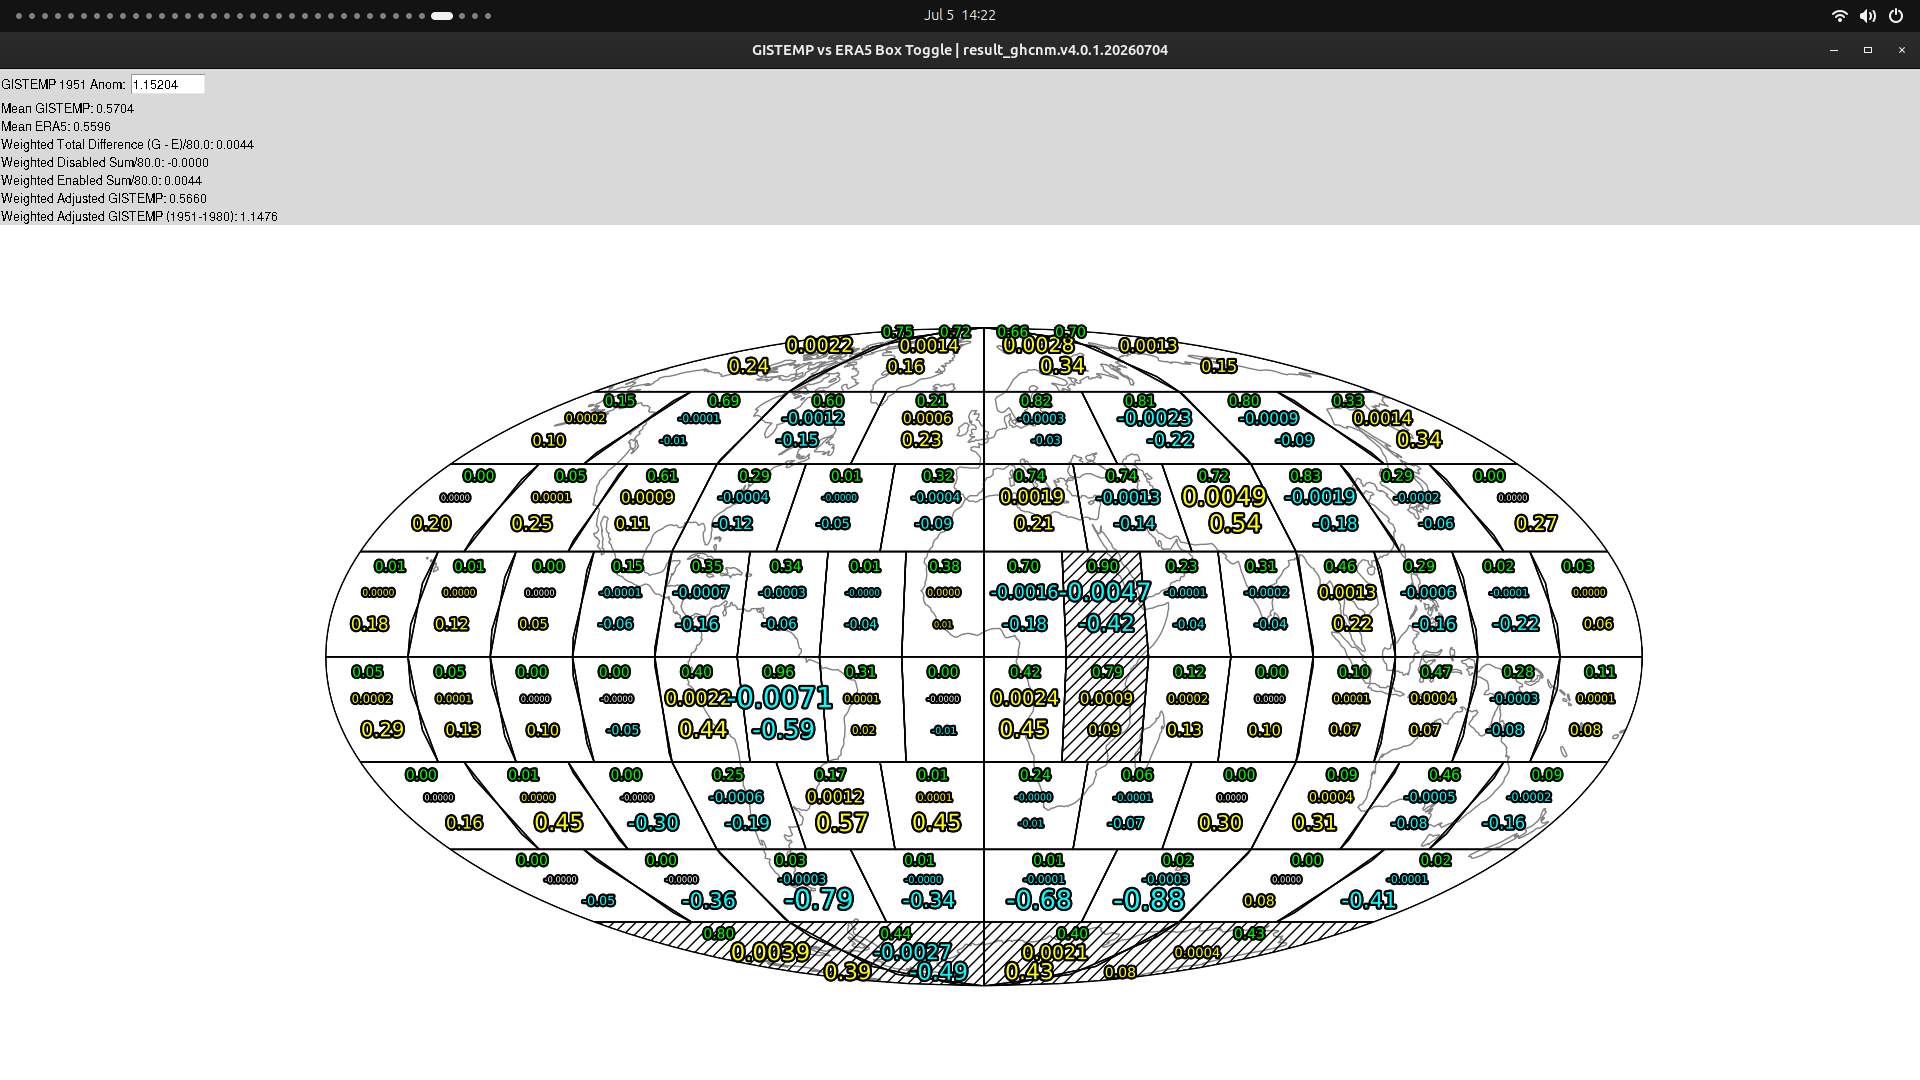
Edit3 (see next post): With the revised weights its 1.202 C from the delta toggles program.
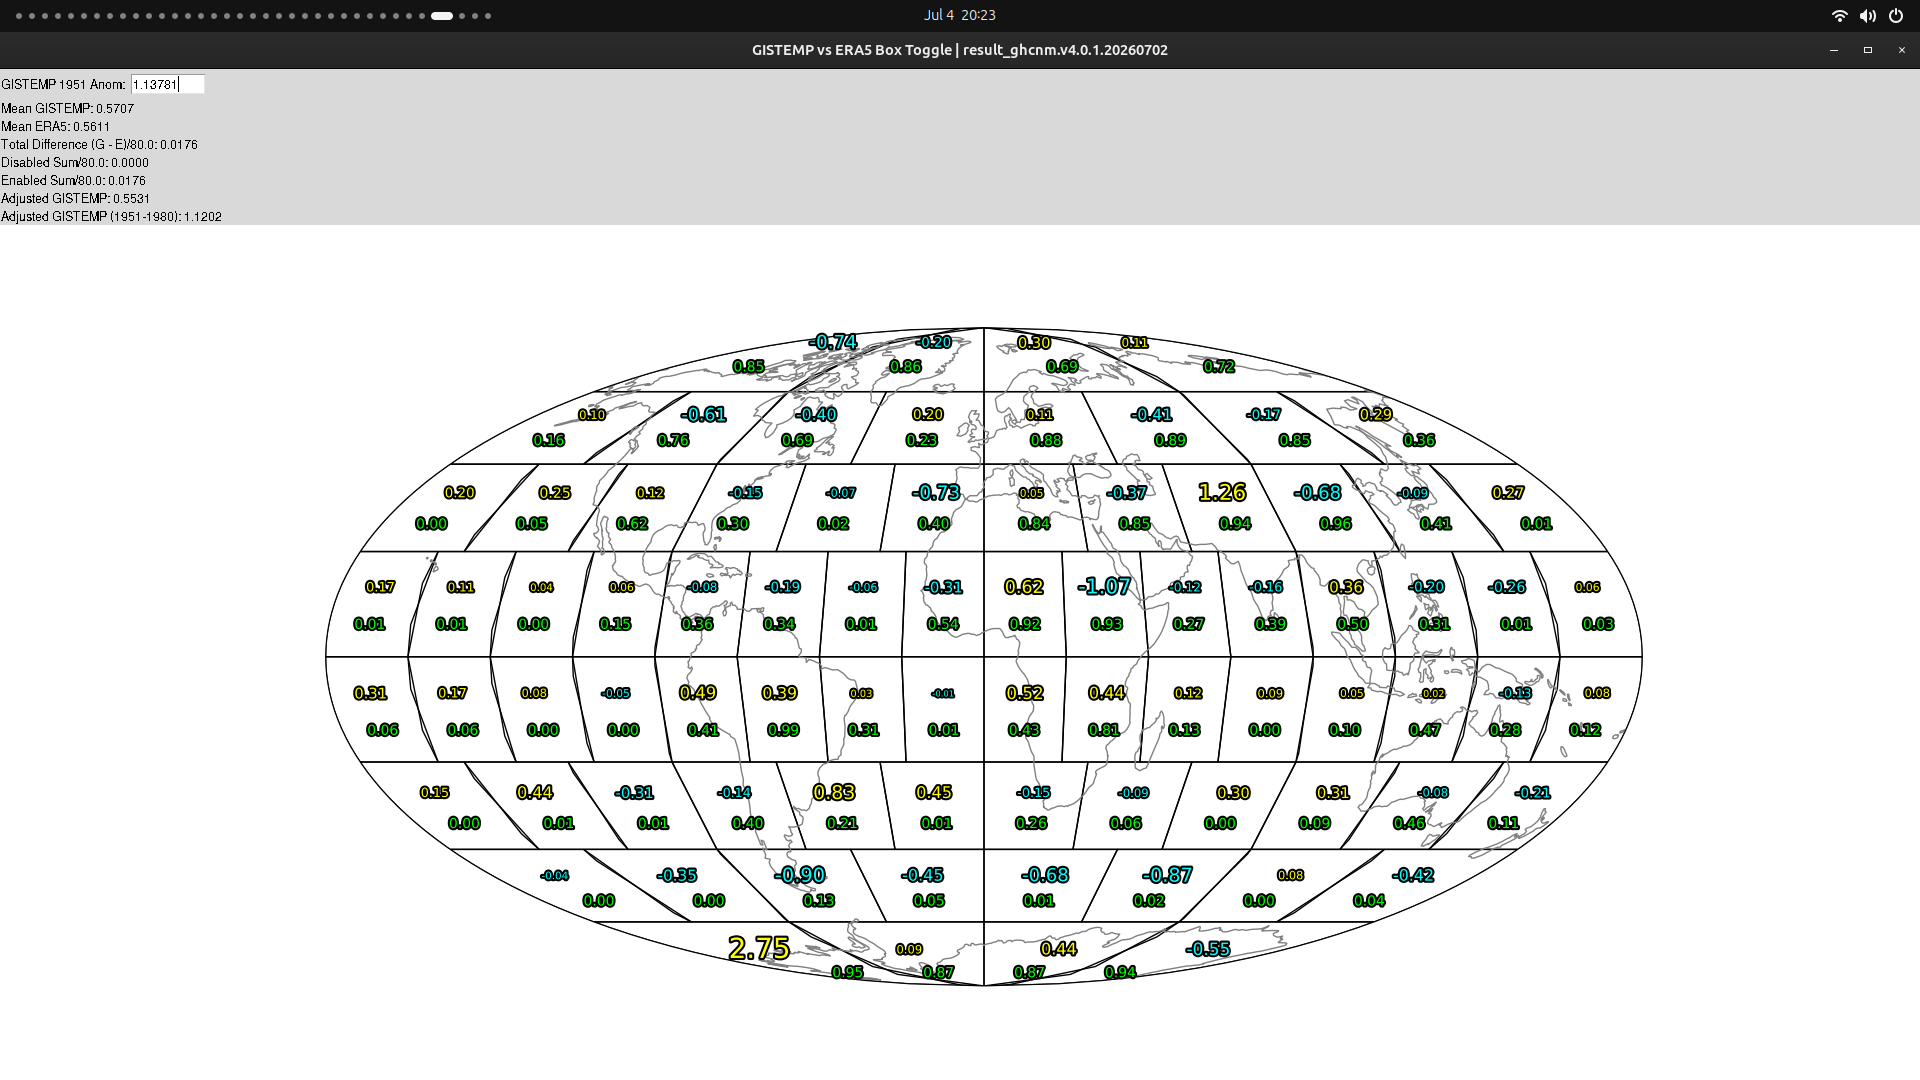
On the data we have so far its already fairly close to ERA5 (0.01 within each other), so even if I disable the boxes where we have fairly good coverage (but keeping the weights) the changes is near nil.
That being said, if we don't get Elizabeth (bottom left Antarctic Box) or nearby stations, it could rise something like ~0.014 C once we get box 78 and the rest of the data, as box 77 which contains Elizabeth is again the largest delta (contributor) between the datasets.
ghcnm.v4.0.1.20260703:
110.985
==
Edit v3: I've spotted another bug in the calculation of the weights for the toggle box program that works on the deltas (this only marginally changed the value). Weight for box 45 (Peru) looks correct now (approximately the land fraction given that it only has one subbox))
It also appears my reasoning for the weights decreasing (below) for box 77 might have been (accidentally?) correct despite it wasn't computing as intended for the missing subboxes.
I update the previous post above with the updated boxes for the older ghcnm for comparison.

tl;dr of below analysis: I do expect it to warm but to 1.1362 C
I'm late since I spent the morning tweaking things in some of the analysis code, plotters, and more importantly the ad-hoc algorithm I put into effect yesterday for the weights of the toggle boxes program.
(Edit3: tweaked plot)
==
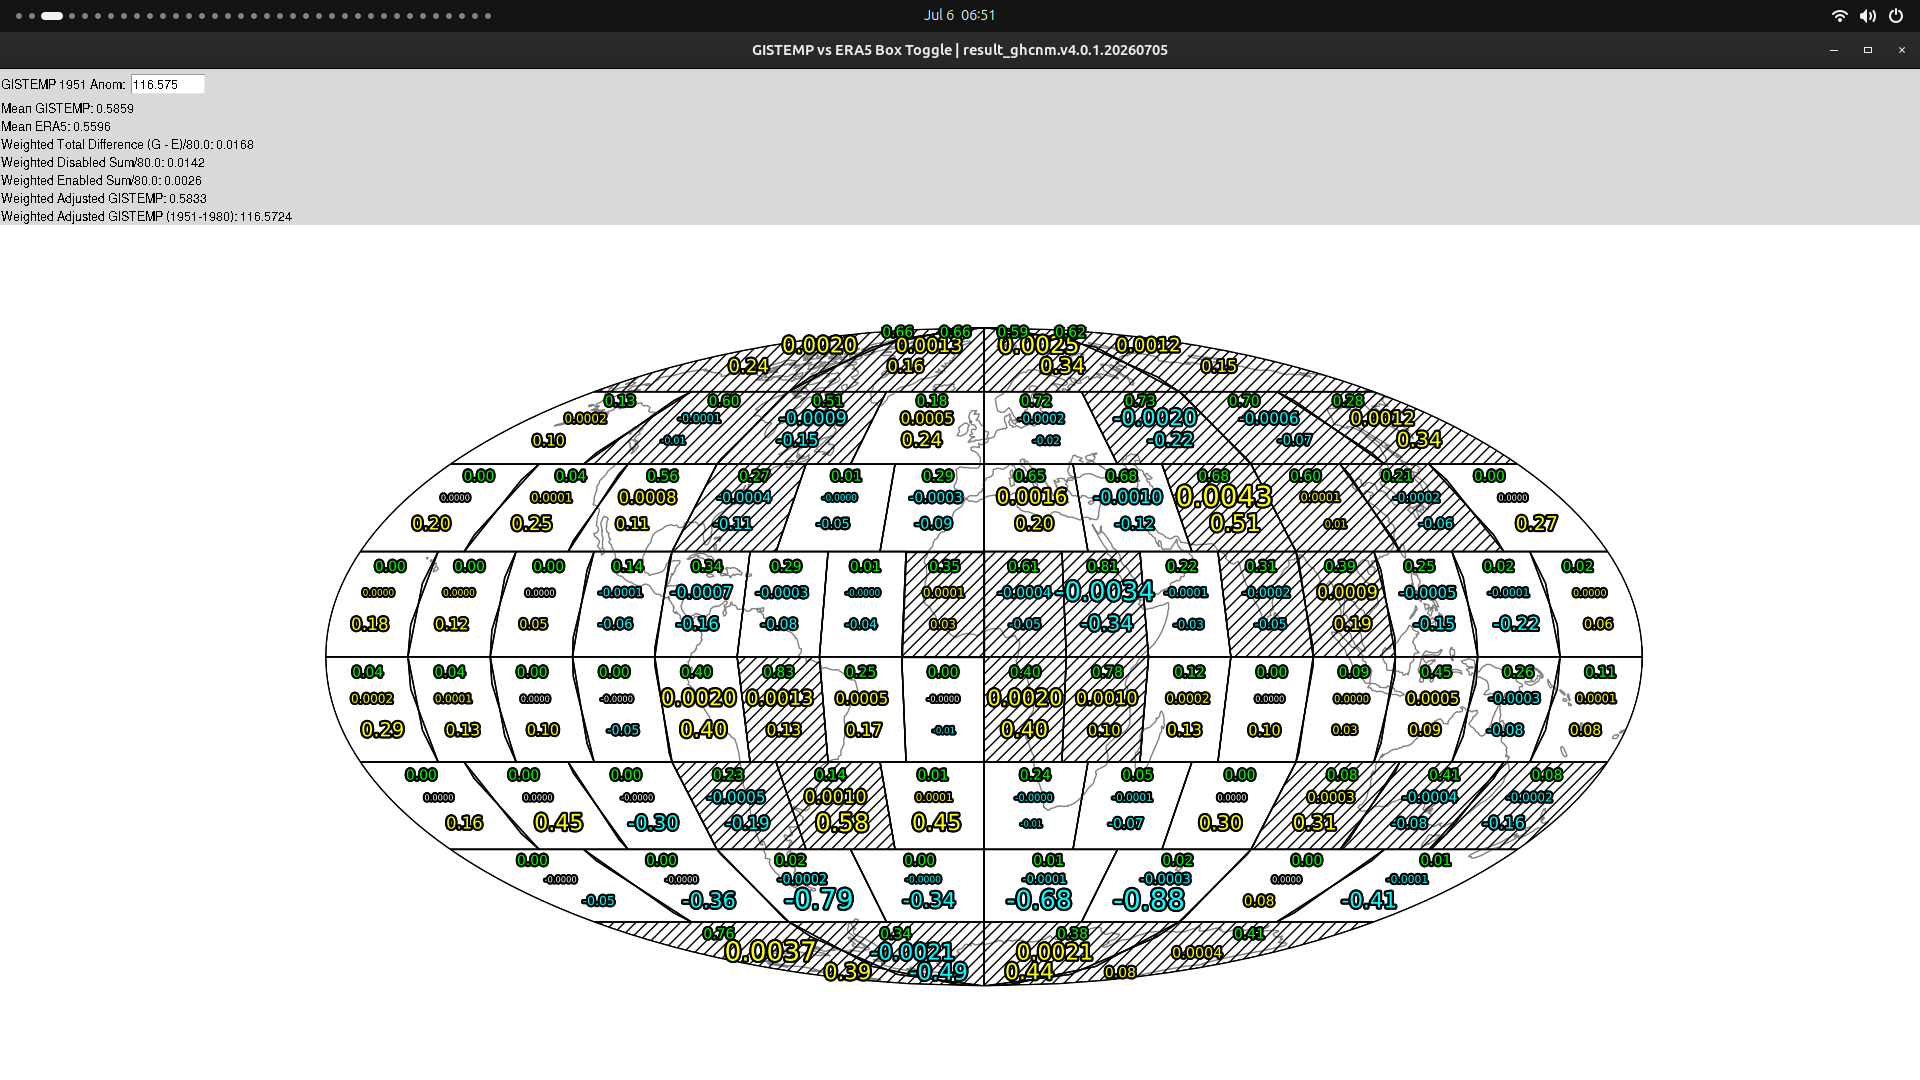
@zenarxy at this stage when we already have the ersstv5 data, and given I'm working off the delta boxes using the toggle program (granted over a different baseline), and now with the new modifications the t2m over ocean should be largely irrelevant now that I'm trying to account for the land/ocean num subboxes / contributing to the boxes and their respective quality (in the "box toggle plot" below, you'll notice all the ocean boxes are automatically weighted 0 by the algorithm, so the deltas don't contribute -- the only remainder is for mixed boxes which I try to account for using the ratio of contributing land subboxes to total contributing subboxes, as well as an ad-hoc "quality" measure that I've fine tuned more today based on very roughly how many land subboxes are expected as such.
Edit: Updated ERA5+super interpolated to subboxes:
===================================
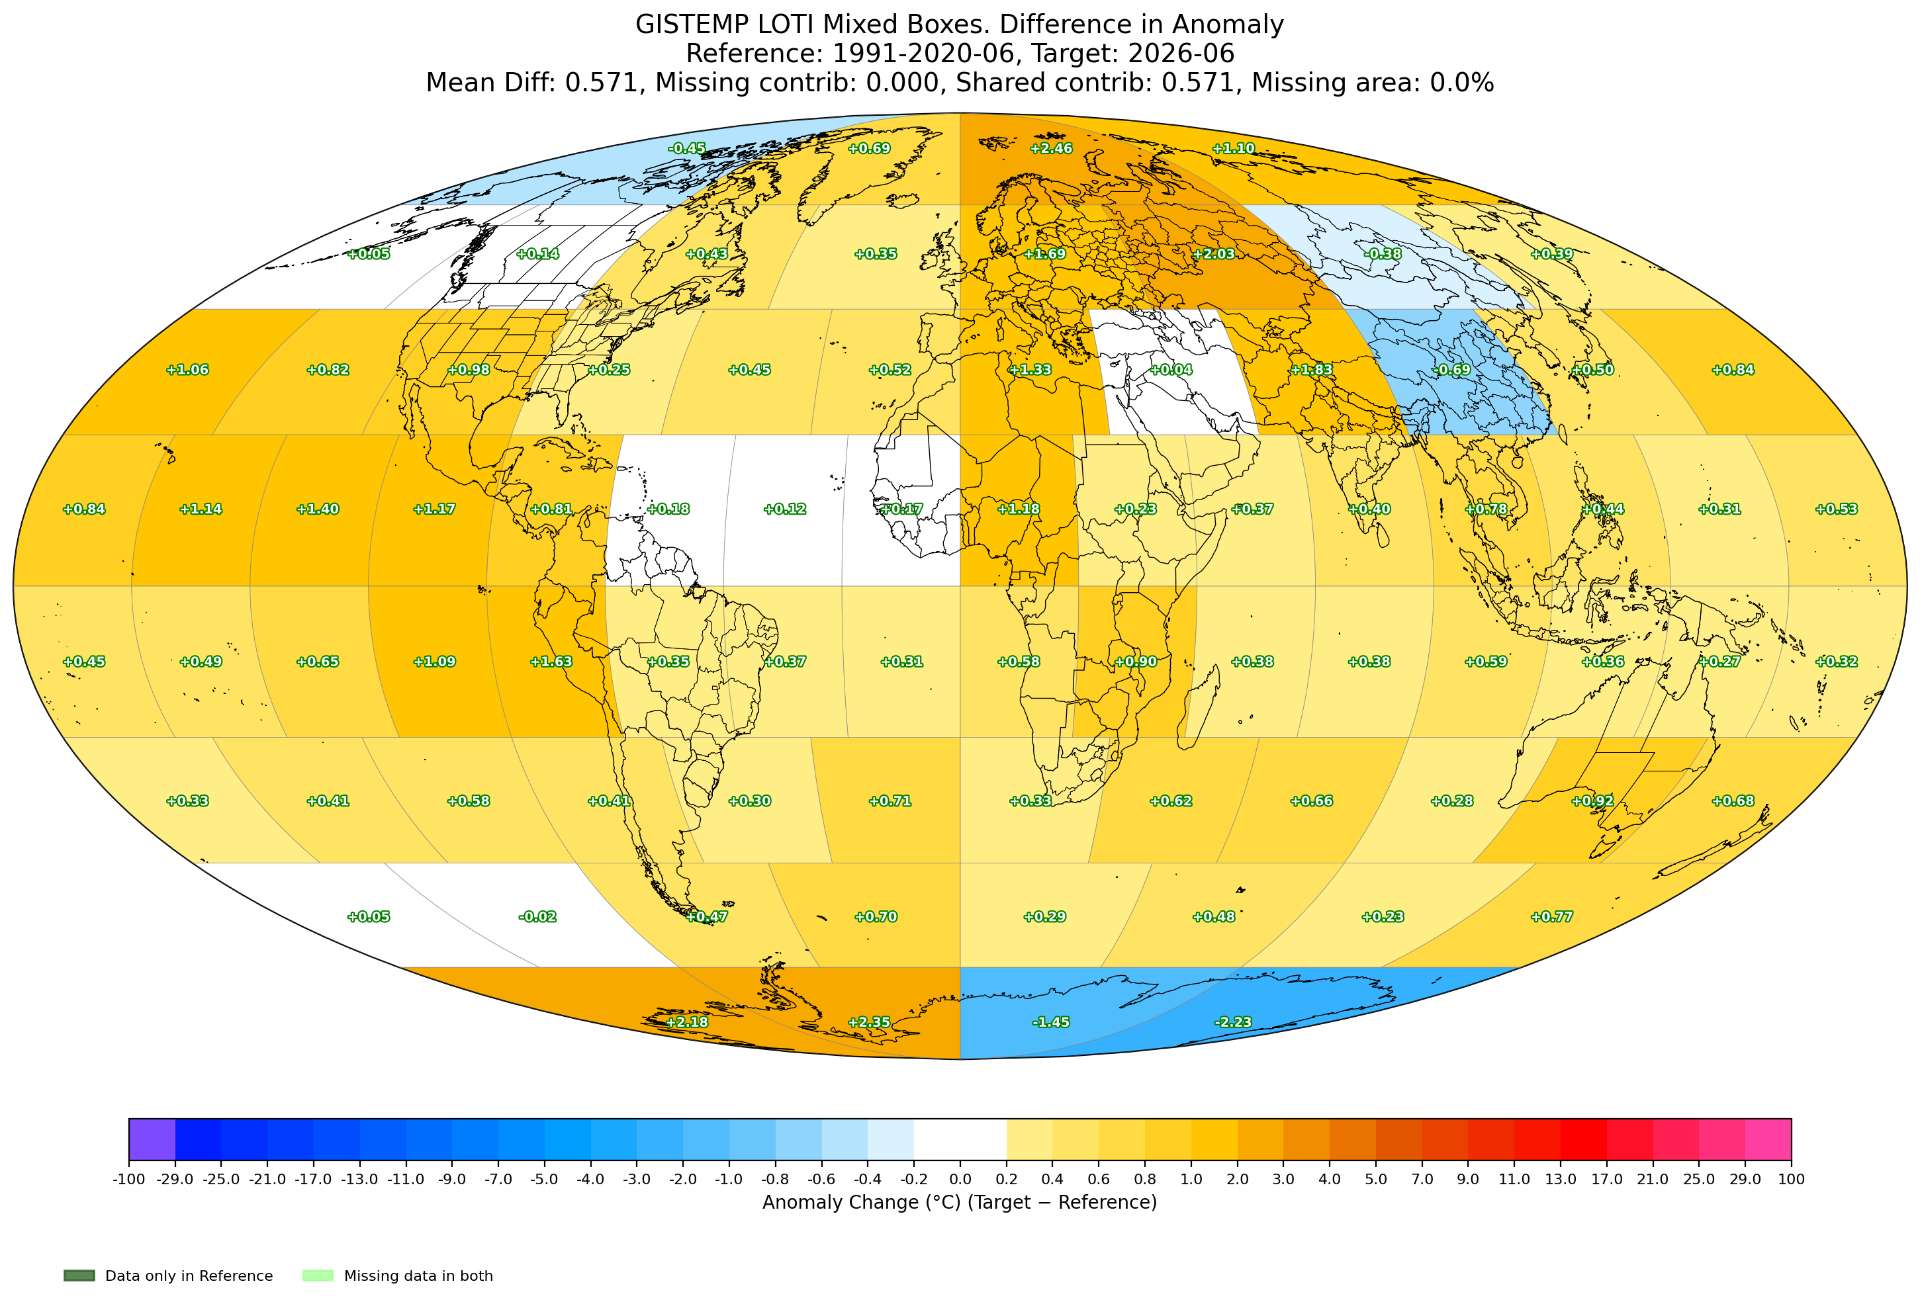
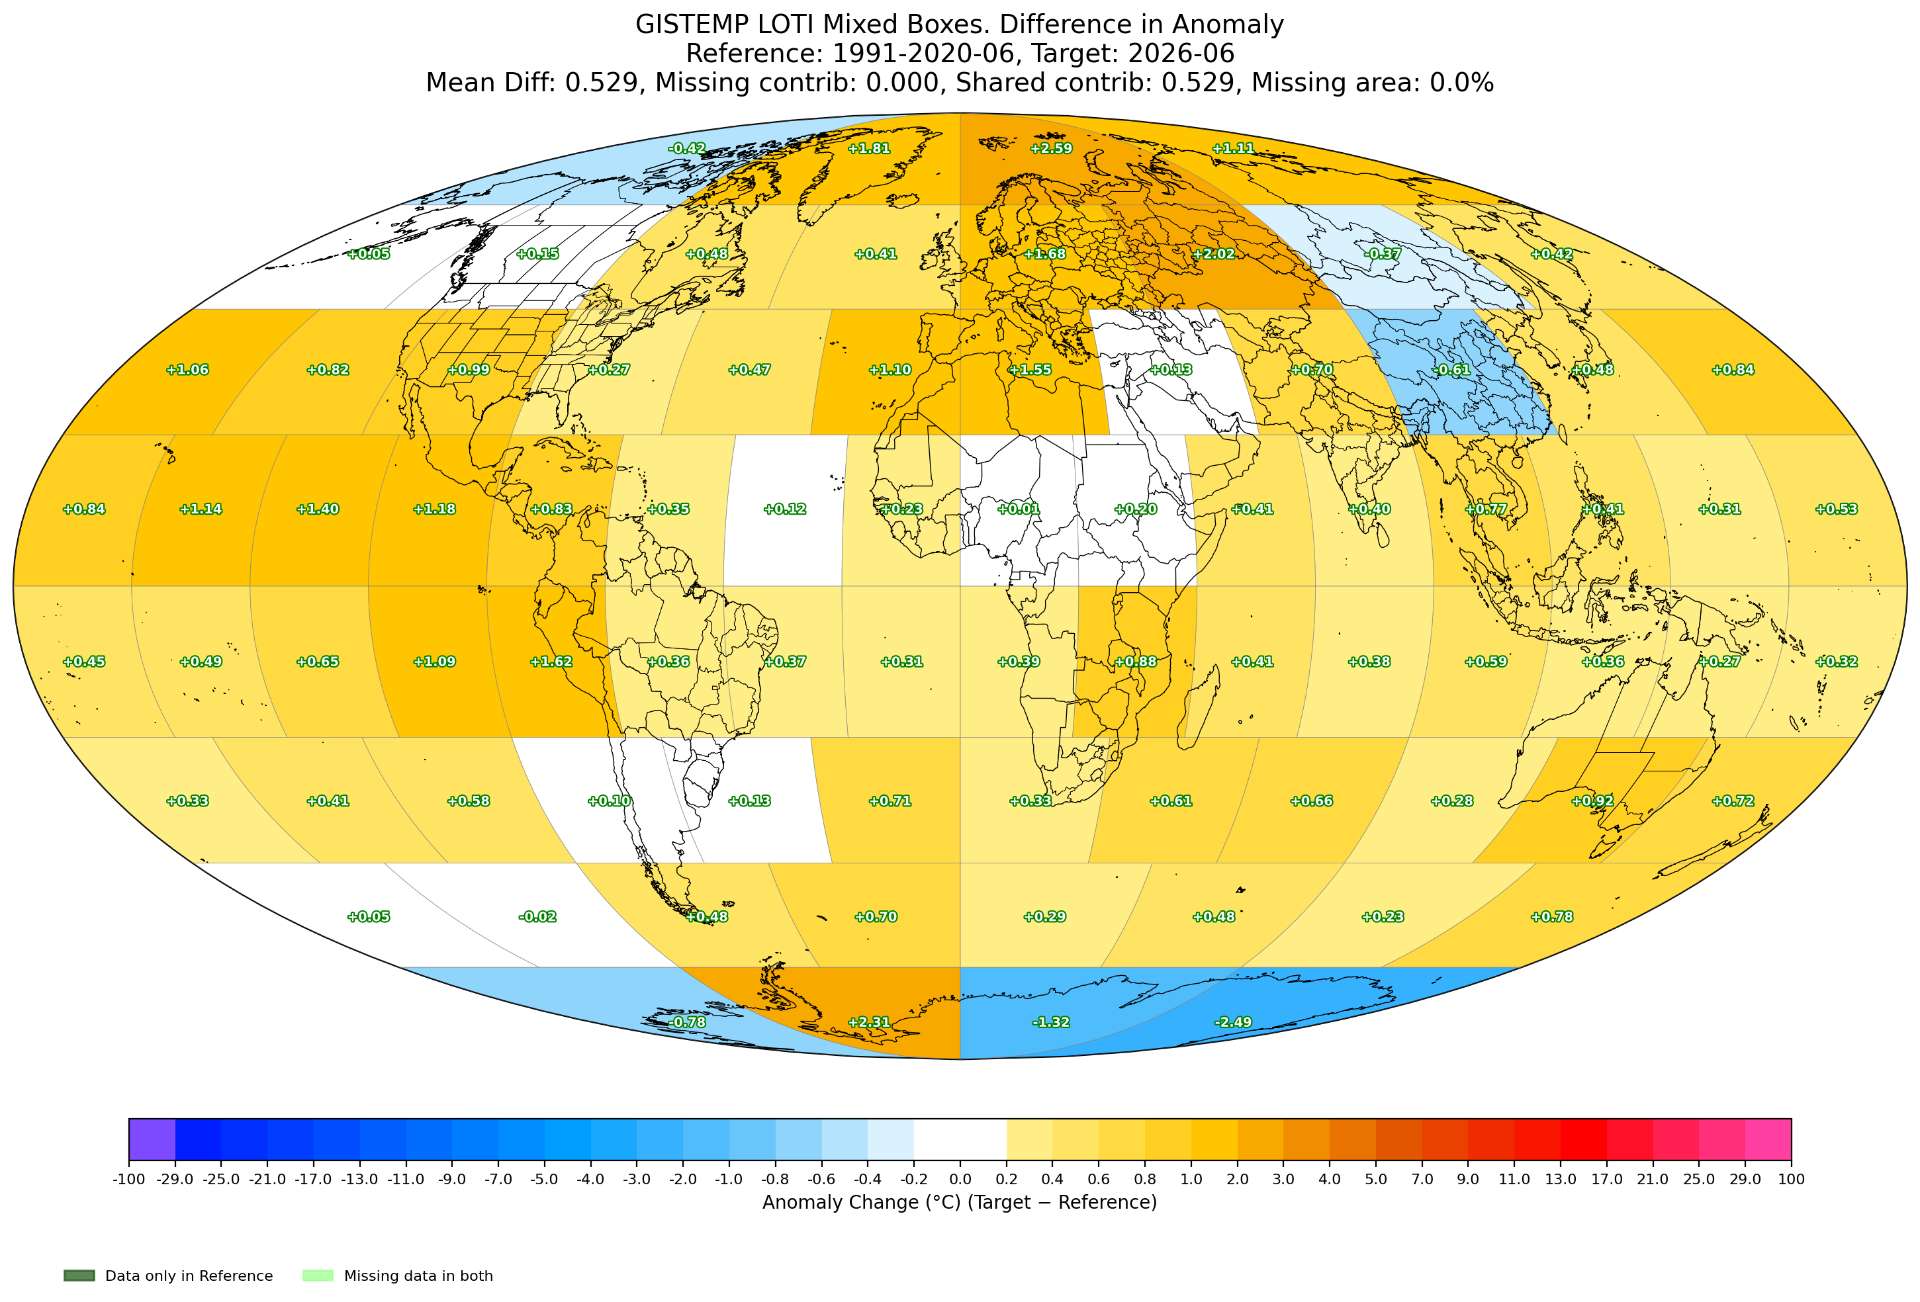
On the gistemp boxes program (below image), which again indicates 1.1362 C (for yesterday, the revised (again) figure was 1.1202 C; see notes below on revision to algorithm).
Edit3: new version with hopefully correct weights now..
The 1.1362 C above remains in best agreement with the delta2 method (the other program using delta boxes t2m method; the other figures are higher from the other models, weighting them I would expect 1.1446 though). So for the purposes of betting this gives me confidence in the similar delta t2m method for the box plotter and a lower figure, to increase my bankroll further, and since I don't have a good idea of much better this toggle method is relative to the mixed estimate below, stick with betting according to the same mixed estimate (yet increasing bankroll):
Point estimate (old, delta2 method, loti3 method) adjusted by prediction error mean: 1.1466, 1.1378 1.1551
Point estimate (mix), pre-adjusted by member prediction error mean: 1.1446
~
I modified the algorithm that generates the weights for the above from ECDF to the mean of ECDF and the ratio of (stations / max stations) in the window for the calendar month at each point in time. I also modified the previous post image using the updated algorithm (ghcnm0702, and the ERA5 data available at the time) -- the ERA5 data from last night was included in today's calculation (I had to redo it since I forgot to update it originally -- the change was a very small +0.0014 C with an additional day's data).
This makes more sense for how I am using it, as if there are usually fairly even station counts over time, we will end up always ranked 0 early on, and setting the quality 0 and thus weight to 1, which is ok if there are literally no stations, but if there are some but still the minimum it still sets the quality to 0 and weight to 1, which is not as intended.
A comparison of yesterday's weights and today's (where we got new data when there was none) mostly makes sense (except for maybe Peru as far as I cantell). The exceptions are as follows:
Edit-2: I note that the box for Peru has weight 0.02 ! It definitely normally has contributing land stations and land subboxes in the past (even if not yet any), so I'm confused as to why the weight for it is so low (had something like 20-50 stations per subbox). I'll look into this as this seems like a bug not to weight it higher (should be close to the land ratio which is roughly 1/4 or 1/5);
Edit-3: I've fixed the above (edit2) by correcting the algorithm to account for the missing subboxes (prior it was calculating the ratio of total actual contributing subboxes when we need to use the expected total contributing subboxes to get the ratios and weights right -- this also requried splitting up the calculation into the land subboxes contributing and land missing (but expected).
This change in algorithm is still not entirely intuitive when there are missing subboxes. Antarctica box 77 (bottom left one) is a good case example:
With Elizabeth station and many subboxes still missing from box 77, you might expect more station data (as we got last night from Box 80) that causes new valid subboxes (from this run compared to yesterday's) within the box to improve the "quality" of the box, but if the subboxes have very low number of stations filling them in historically (as is the case here) then the mean quality of the subboxes within the box will actually drop, and the weight (where we weight the ERA5 delta more) will correspondingly increase.
However, on average when this happens you also would expect the mean bias of the box to decrease overall (due to better spatial coverage) despite this so increasing the weight is actually preferred in this case (and also preferred in some cases where the bias might get worse). Today the bias for 77 got better (relative to ERA5) still with no Elizabeth because box 80 biased it cold now with a few new subboxes.
===================================
Below I look at some new diagnostics plotted to try to make sense of the ad-hoc quality measures:
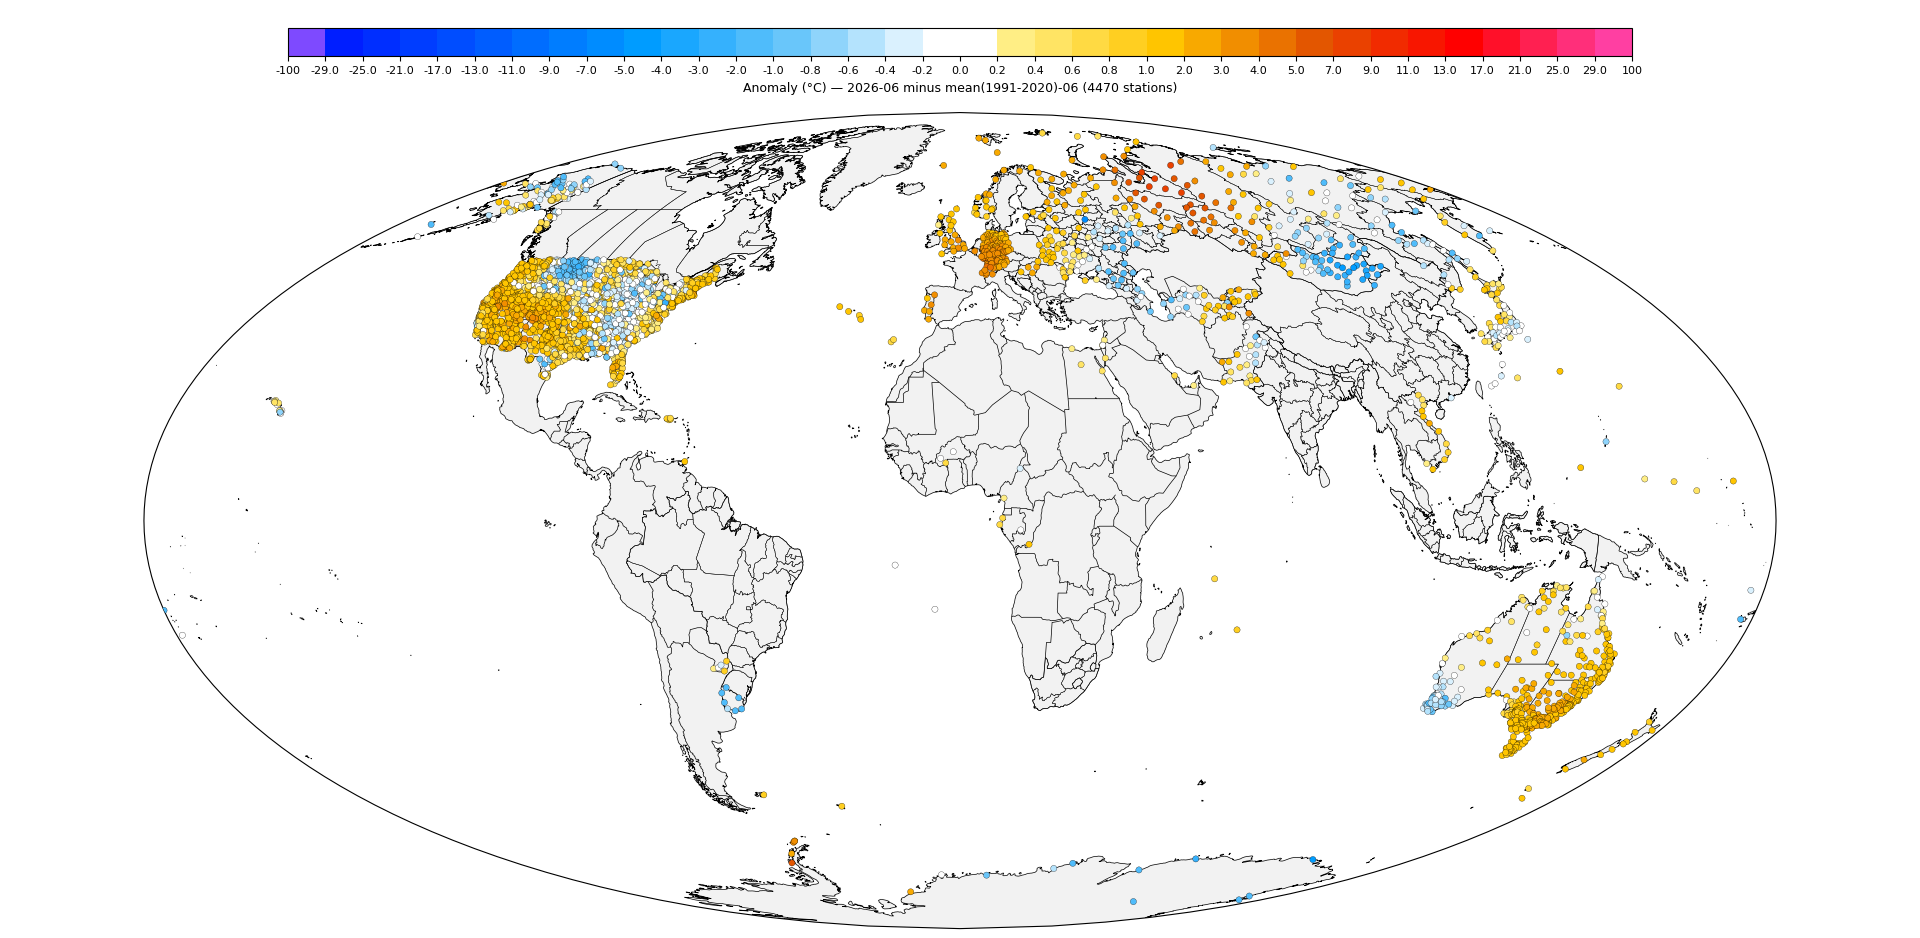
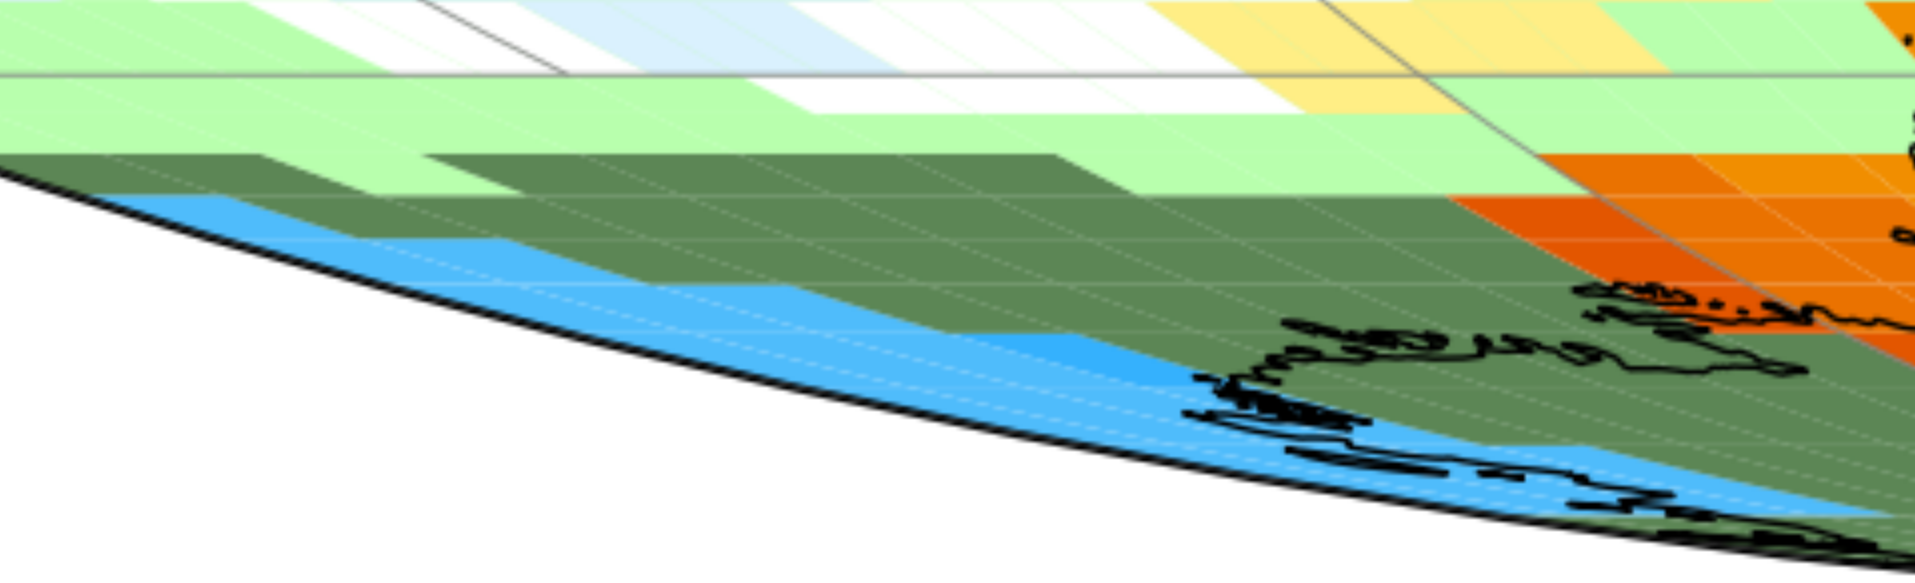
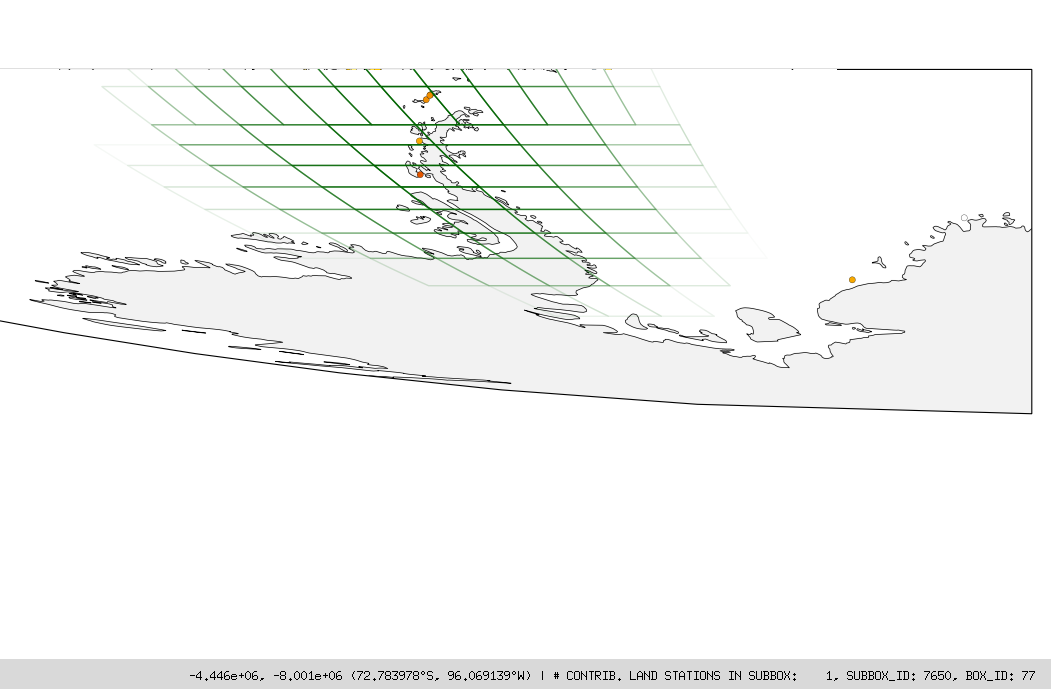
I've modied the anomaly station plotter to include the contributing station count data from the npz I produce now using the modified gistemp, as well as plotting the subboxes for an arbitrary selection of one or more stations, using the opacity as the max station weight (if doing it with more than one stations) using a rewrite of step3's incircle(). Note this the theoretical subboxes they COULD contribute to (not actual !) as I don't reference (not yet coded) whether its an land/ocean subbox yet (i.e. the warm 5 subboxes I mention below are actually 3 warm subboxes in the actual gisteemp data as the top two (7380, 7390) are an ocean subboxes that are ice masked)
Focusing on the 2 stations in box 80 that are contributing to box 77, notice they are mostly 2 station subboxes:
Elev. (m): 24.1, Station: AYM00089664, Name: MCMURDO_SOUND_NAF
LAT/LON: -77.88/ 166.73, Value: -24.40, Anomaly: -1.31, Last30yrs -> mean: -23.23, min: -32.02, max: -16.90, std: 2.75
Elev. (m): 150.0, Station: AYM00089666, Name: CAPE_ROSS
LAT/LON: -76.72/ 162.97, Value: -23.60, Anomaly: -1.55, Last30yrs -> mean: -21.17, min: -23.20, max: -17.18, std: 1.65 EXCEEDS 30-yr RANGE BY -0.40°C
Blow up of actual subboxes (from first gistemp subbox plot at top of post) (counting there are 19 cold subboxes from box 80, and 3 warm ones from box 78):
I looked at this because if you notice from the pllot yesterday, we had one of the stations in box 80, but it did not contribute to box 77. But now with the addition of one of them last night (McMurdo Sound), both are now contributing to box 77. This must be an effect of the stitching of GISTEMP's combine algorithm (verified this as Cape Ross has 20 years of data but 8 years of it are flagged so effectively only 12 years).
~
Importantly to the gistemp toggle box program, despite them being of low "quality" (per the adhoc algorithm mentioned) subboxes as a whole (when considering we will get more stations like Elizabeth to fill them in) they are bringing down the temp of the box too much at the moment, as subboxes they are given equal actual weight (individually when aggregated into boxes) as the (5 plotted) 3 subboxes from box 78 that are warmer are infilled by a single station:
Elev. (m): 33.0, Station: AYM00089062, Name: ROTHERA
LAT/LON: -67.57/ -68.12, Value: -2.85, Anomaly: 5.08, Last30yrs -> mean: -6.98, min: -17.10, max: -1.65, std: 3.27
Note that the although the 5 warm subboxes had only 1 station, and the cool subboxes from McMurdo/Cape Ross had several 2 station subboxes, the mean quality per the ad-hoc quality algorithm I used brought the weight down, indicating that the cold subboxes ( are usually filled in with more stations relatively normally compared to the 3 warm subboxes.
===================================
@zenarxy no -- milk takes longer to go bad
ghcnm.v4.0.1.20260704:
115.204
Canada came in a tiny bit warmer than expected. I won't be suprised if there is a revision in the next few days if/when more data comes in for existing stations.
Based on below expecting it to drop to 1.1476 C -- so expecting it will be close.
Given how close it is betting up to a vibey 20% seems fair considering my priors with the model would put it 40+%.
====
Updated the toggle box to just show the actual weighted delta contribution in the middle (how much LOTI will change (although the sign is OPPOSITE) since its G-E)).
Based on past data we should not expect any more stations in the Antarctica boxes (77-80), so I've toggled them off.
South America: Brazil is cooler in GISTEMP by about -0.007 so it should warm when those stations come in. Some slight cooling should come also from Peru, since land stations appear to be anomalously cooler relative to the very warm ocean from El Nino.
That leaves Asia and Africa.
We have quite a number of Asia stations but not all of them (notable is we are missing a few stations near western Tibet/India -- which is where the cold anomalies are in the region) that should codl temps there a bit).
For Africa Rwanda/Kenya those two stations have also been erratic (5/8 months I have plots on the 8th for neither are present) so I've disabled its boxes (otherwise 1.476 C rises to 1.514 perhps if we get them and the deltas are good).
Their absence will keep the boxes biased a bit cool since those couple stations should be relatively warm if they do come in, though the deltas suggest its mainly going to (warm) the northern box 50 by about 0.005 C if it does come in, and not affect the southern box 34 much despite the high weight -- judging on 34 this seems perhaps wrong since mostly in box 34 its cooler in the middle) -- if this is wrong it may be due to poor coverage that the calculation comes up with the wrong delta here.
South Africa is missing a couple stations but the impact should be marginal per both the weights and the deltas.
ghcnm.v4.0.1.20260705:
116.575

@zenarxy It looked reasonable to me (yesterday) -- yeah its going to end up being 1.17.
We got all the warm combinations (Brazil, east Asia, Africa), and only Western Tibet (but no Peru) to marginally cool it (and even then wasn't enough) so of course it went up. Bangui, etc in the CAR really infilled the last bit of cool subboxes with warm ones, so Rwanda/Kenya won't change it much now even when it does come in. Don't know why China ended up being so much warmer.
The fix is in barring some major revisions to existing stations otherwise I would sell the rest of my shares in the other bins.
Looks like for the toggle program the weights are too high for too many places, and it was anchoring it to ERA5. Reducing the window size didnt' help. Looks like I still need to manually toggle most of the areas that have plausibly enough coverage rather than certainty that they won't change at all.
@parhizj you gotta put a frog in your milk
Can Putting a Frog in Milk Keep It Fresh? https://share.google/LoFJ4trOT7pUj41TG


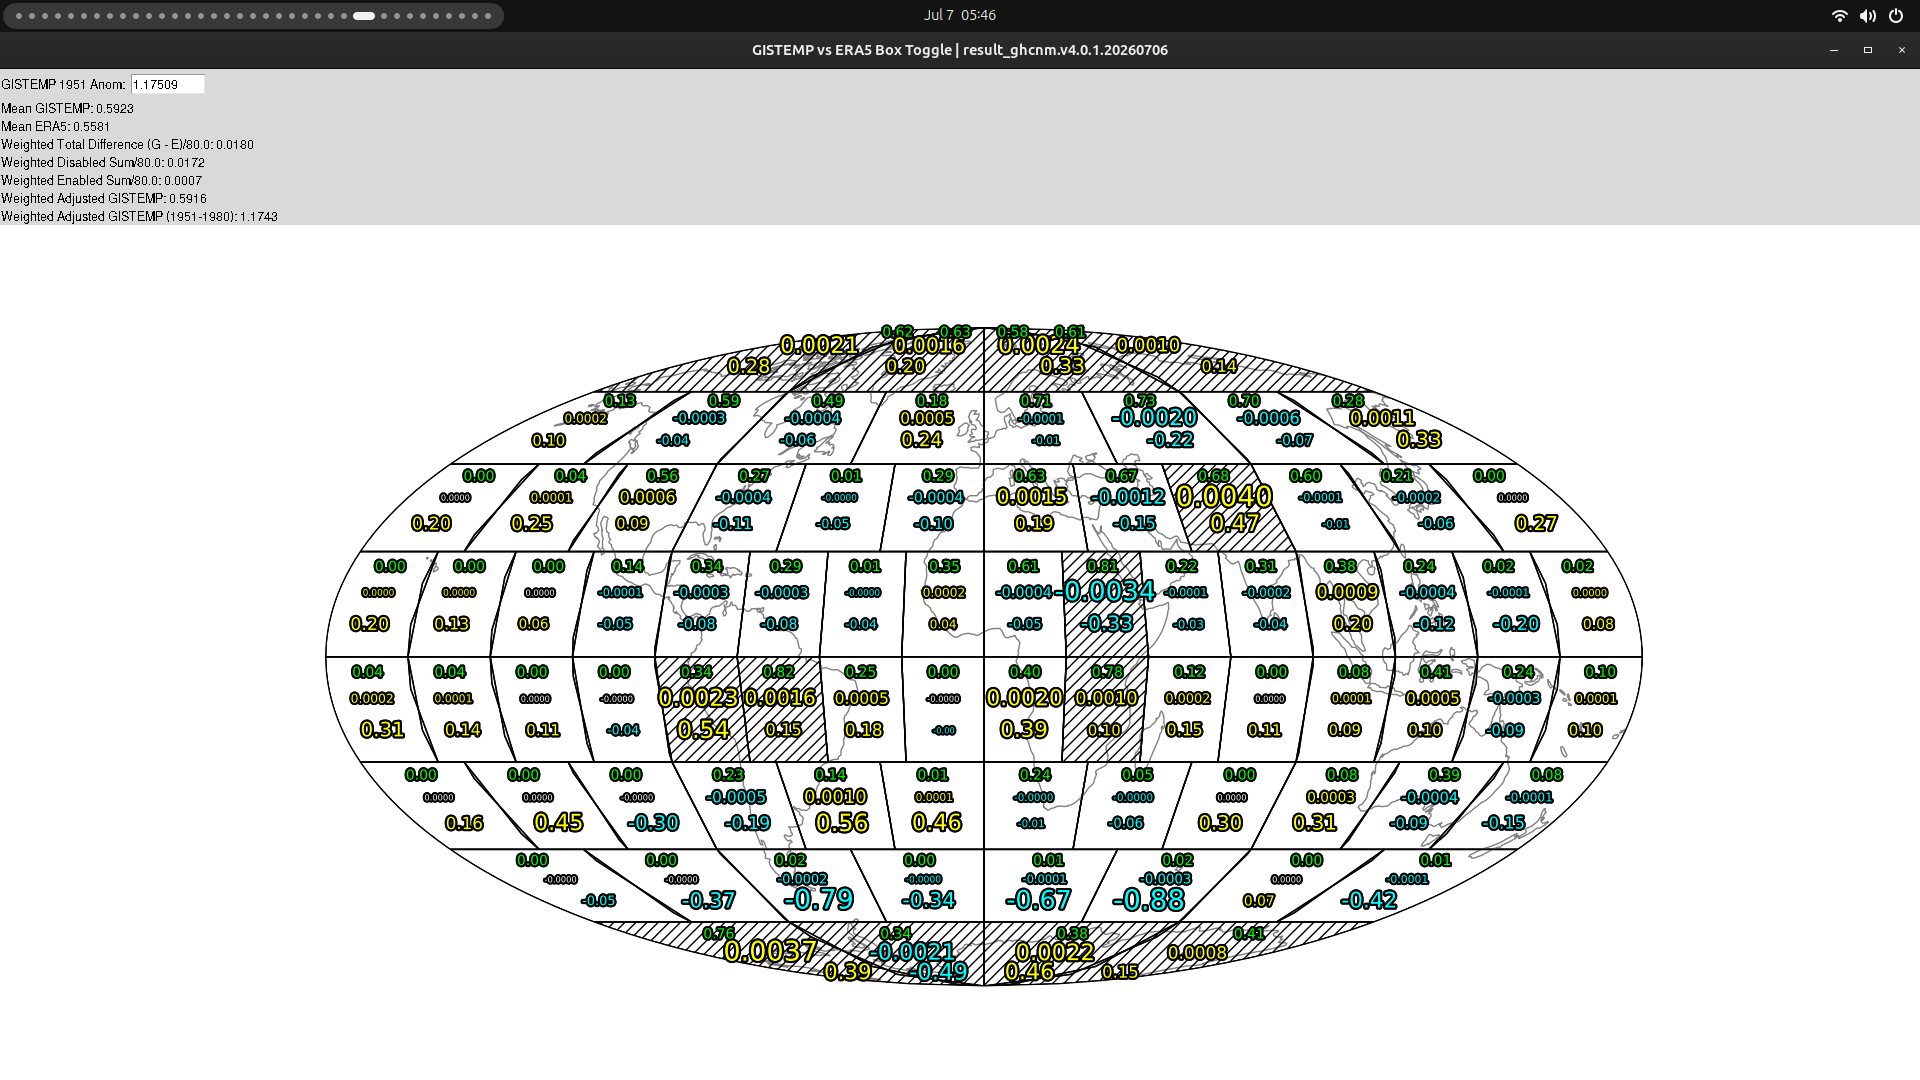

breakdown of where/how GISTEMP was warmer than ERA5 this month (post mortem of toggle boxes).
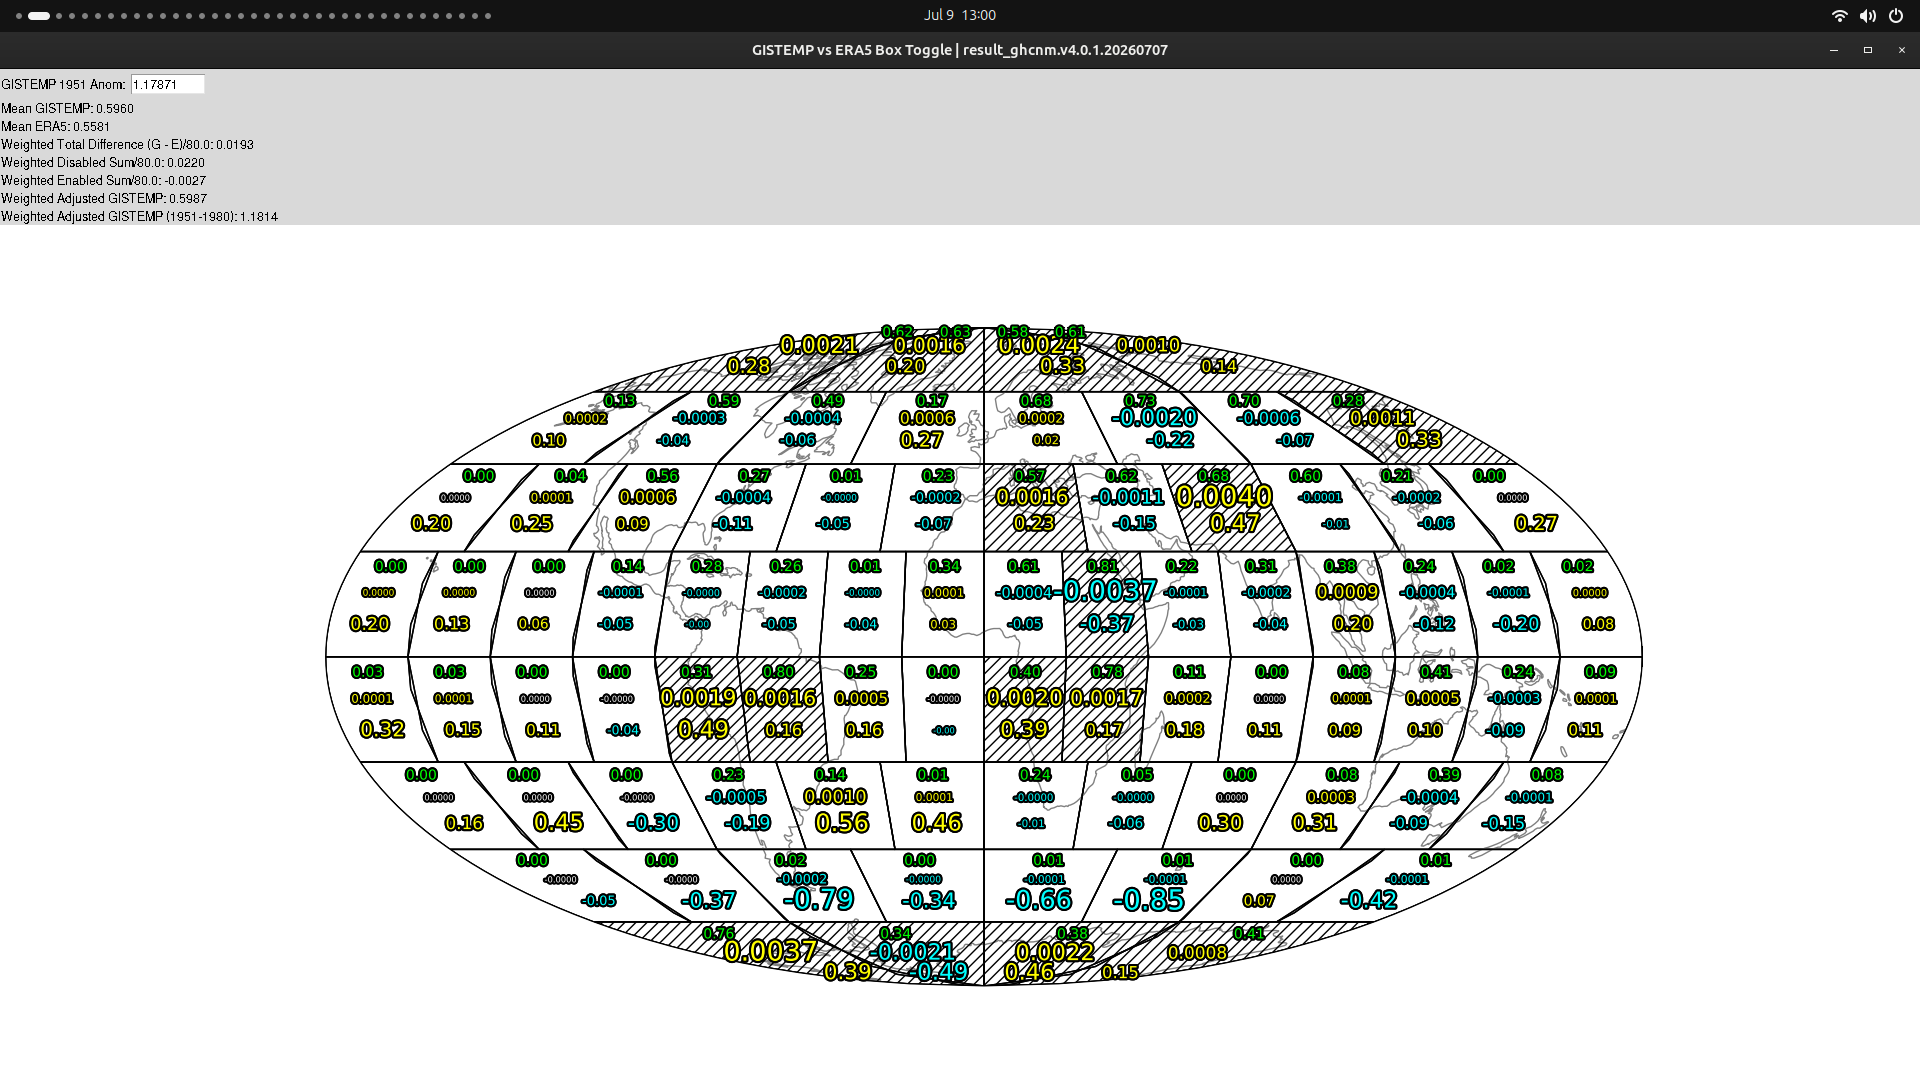
(the dashed (disabled) boxes are what I examine, using differences in subbox temps/box temps, and the gridded ERA5 anomaly plot and station anomaly plots)
weighted total difference: +0.0193 (i.e. GISTEMP was ~ +0.02C warmer than ERA5)
weighted diabled sum: +0.0220
weighted enabled sum: -0.0027 (not accounted for in below)
weighted disabled sums (GISTEMP - ERA5); most of ocean boxes are weighted 0, and mixed
boxes are weighted close to appropriate:
(I've grouped boxes together where I thought appropriate), (delta below is total weighted delta for the boxes (based on station quality/number of land-ocean subbox ratio etc.):
N pole (boxes 1-4, aka band 1):
+0.0072 (in decreasing order: Box 3, 1, 2, 4; for box 3 despite Russia being warmer in ERA5, ERA5 is colder than the station anomalies suggest near the pole (station RSM00020046 (POLAR_GMO_IMETKRENKELJ) at Franz Josef Island for instance) -- this probably also effected box 4; for Box 1 Montana/Canada was much warmer in GISTEMP than it had a right to be as looking at the station anomalies its clear GISTEMP's large gridding radius smothered the cold anomaly here despite the high station density in Montana; for box 2 Greenland's west coast the 3 station anomalies that made it into GISTEMP are cool but they got infilled neutral, in combination with the pole subboxes it overall got biased a bit warm despite some subboxes in eastern Greenland/Canada being much warmer in ERA5).
S pole (boxes 77-80, aka band 8):
+0.0046 (box 78 was cooler than ERA5 so the delta was not as bad as it could have been, as it usually has the most variation in comparing the datasets of any other band over time)
The arctic/antarctic bands account for nearly 0.012 C of GISTEMP being warmer than ERA5
Western China/Pakistan (box 21):
+0.0040 (despite some cool stations in Pakistan and one in Western China (SHIQUANHE) that are more reflective of ERA5, the poorer coverage/relative less density of stations compared to the much warmer and higher density of stations in Kyrgyzstan, Uzbekistan, Tibet led to it being biased warm it seems). This box is one of the boxes that compared to its neighbor boxes (and its band as well) that has more variability over time in comparing ERA5 to GISTEMP.
Algeria/Libya, Congo (boxes 19, 49):
+0.0036 (despite neutral stations along SE Algeria/Libya border, lack of coverage in Libya means those subboxes along the border and in Libya as a wole got infilled too warm from the denser warm stations across northern Algeria; lack of coverage in central Africa means Congo infilled what would likely be otherwise cool subboxes across northern Angola, Zambia, and southern part of DRC).
Brazil, Peru (boxes 46, 45)
+0.0036 (coastal land was warmer in Peru than expected and warmer in SE Peru as well).
Sea of Okhotsk (box 12):
+0.0011 (land was warmer marginally (ocean much warmer than t2m), but weighted this makes sense).
Rwanda/Uganda (boxes 34, 50)
-0.0021 ((not unexpected) lack of timely data provided net cooling).
((Not discussed is box 10 over NW Russia where GISTEMP is -0.0020 C cooler than ERA5, which accounts for most of the remaining difference ))
~
Reviewing the above there still remain two problems with the toggle box idea (for after I get preliminary ERSSTv5/GHCNm data to initial GISTEMP runs):
1) Excluding the ocean boxes (which seems to be done well), with so many land boxes with high weights, the deltaboxes ERA5 will typically anchor the interpolated estimate in between the current/preliminary GISTEMP estimate and the ERA5 baseline. So, if the range between the ERA5 value and the preliminary GISTEMP value doesn't contain the future GISTEMP value of interest it will have a hard time interpolating in between even with weighting (this happened repeatedly here where the values were too cold it ended up on the wrong side, and when the preliminary values were too conservative, it made it even more conservatively warm).
2) The estimates of the weights being off for "completed" boxes (i.e. the weights should be 0 for Antarctica for instance but it's still considering station data that will likely be added in the coming days/weeks, so the station quality is lower than it should be at this point in time -- this is not unfixable, but requires more data (this is doable perhaps: despite not having older ghcnm data for every day/month perhaps it can be approximated using old ghcnd diffs -- although for Arctic/Antarctica data I don't recall if that is included in ghcnd or not)). It's unknown how much the ongoing transition to ghcnh and ssod would affect this prediction.
Edit: deleted
Models shifted upwards marginally again for today/tomorrow:

Getting 1.1476 as a point prediction, and the three different methods I'm using are within 0.014 C:
Point estimate (old, delta2 method, loti3 method) adjusted by prediction error mean: 1.1482, 1.1423 1.1565
Point estimate (mix), pre-adjusted by member prediction error mean: 1.1476
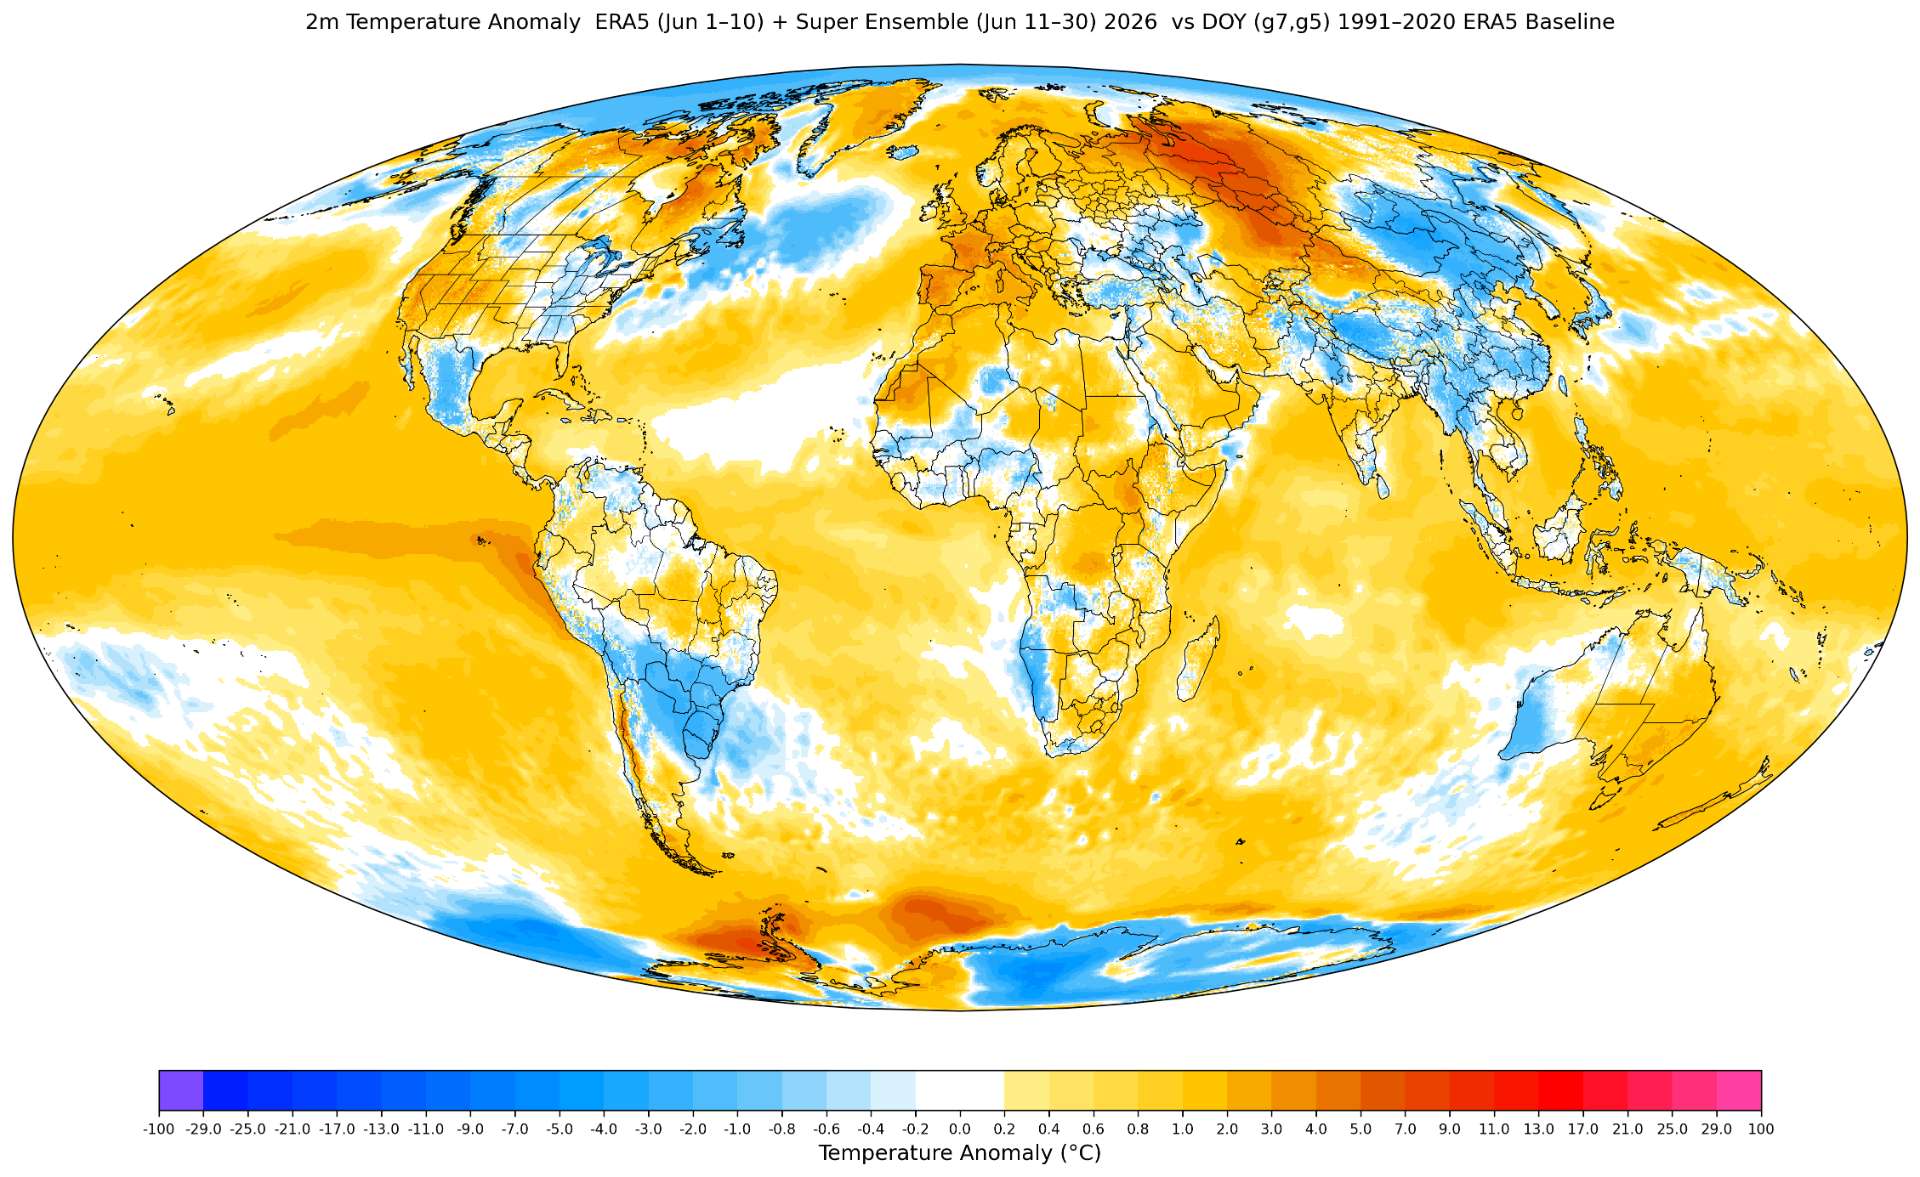
The variant using the doy climatology (g7 for analysis, g5 for forecast) for the latter two of the methods gives a slightly cooler prediction:
Point estimate (old, delta3 method, analog3 method) adjusted by prediction error mean: 1.1482, 1.1342 1.1342
Point estimate (mix), pre-adjusted by member prediction error mean: 1.1379
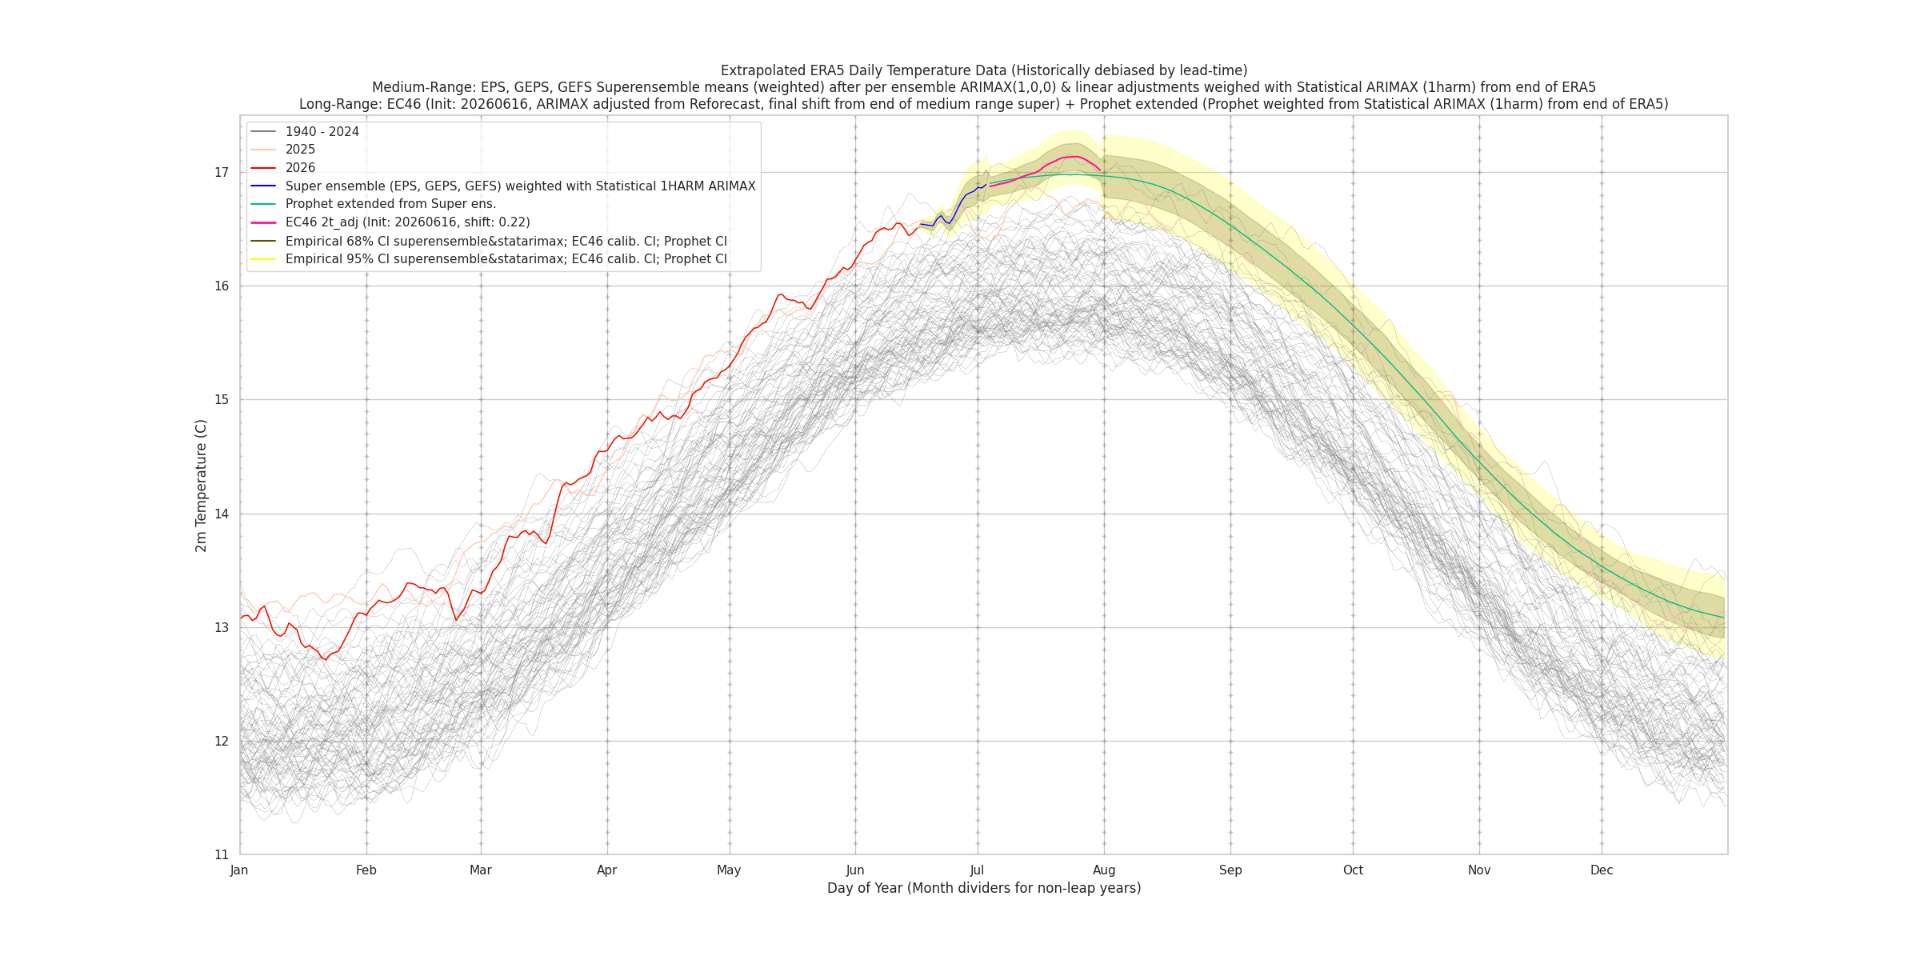
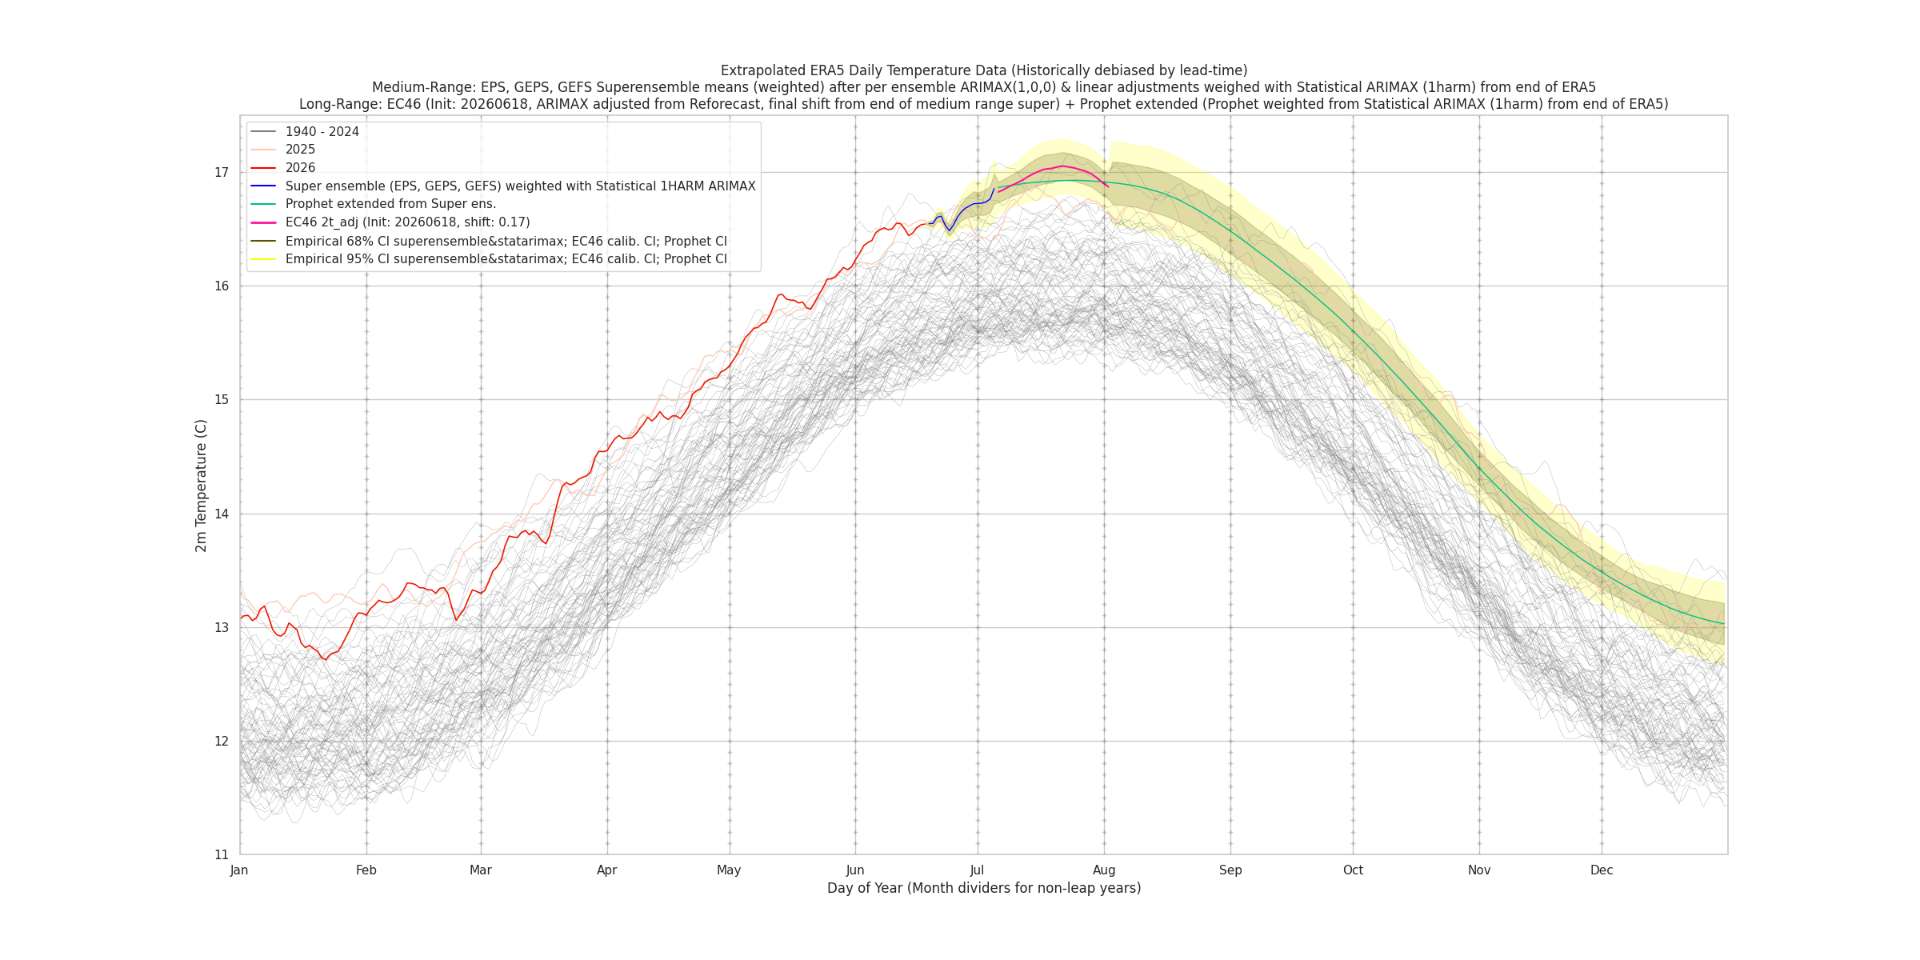
For the first time since I added it the subseasonal EC46 (from a couple days ago) comes into fairly good agreement with the end of the medium range (today) of the super ensemble, and its not much different from climatology for second half of July.
Edit: (July notebook version with July final adjustments only)

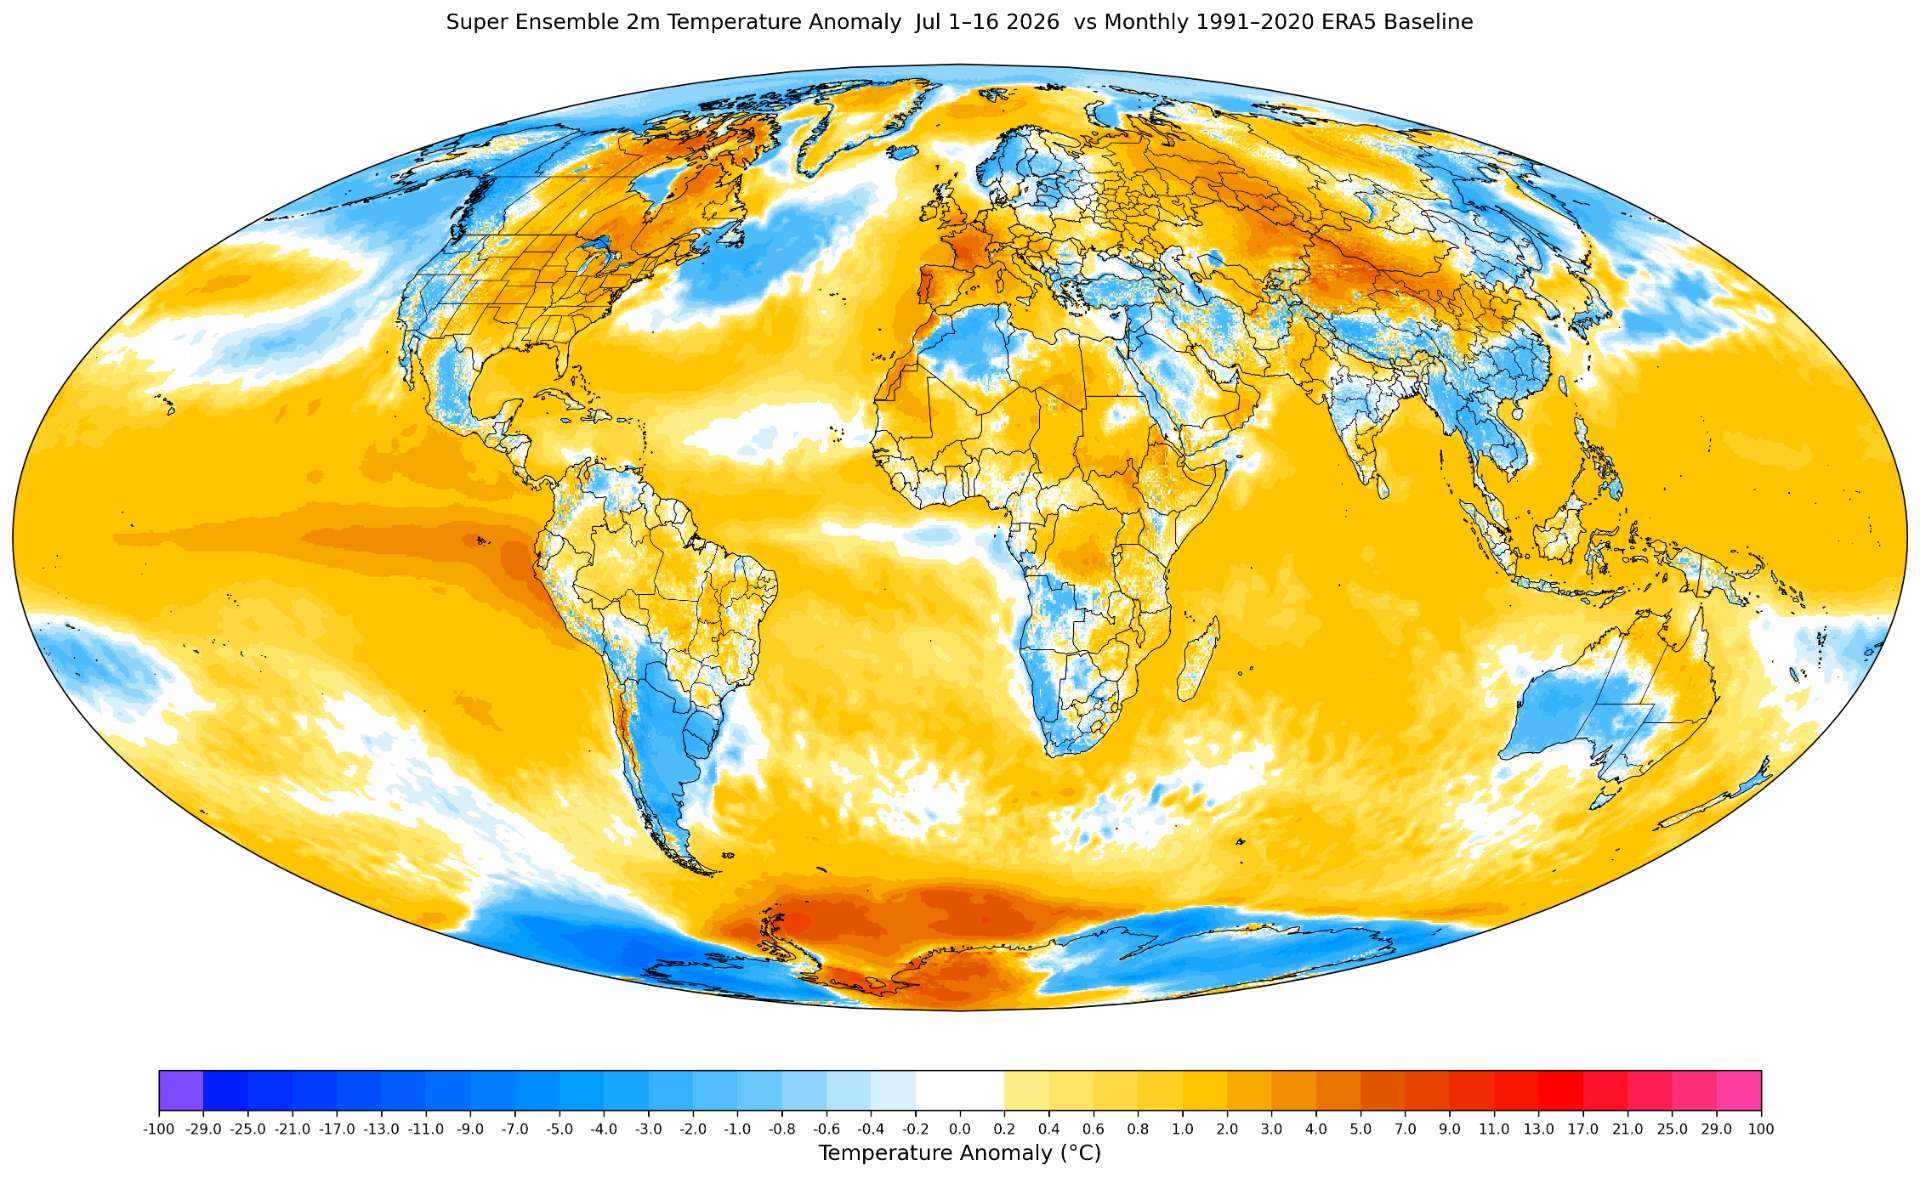
MTD anomalies for first two weeks of July (superensemble):
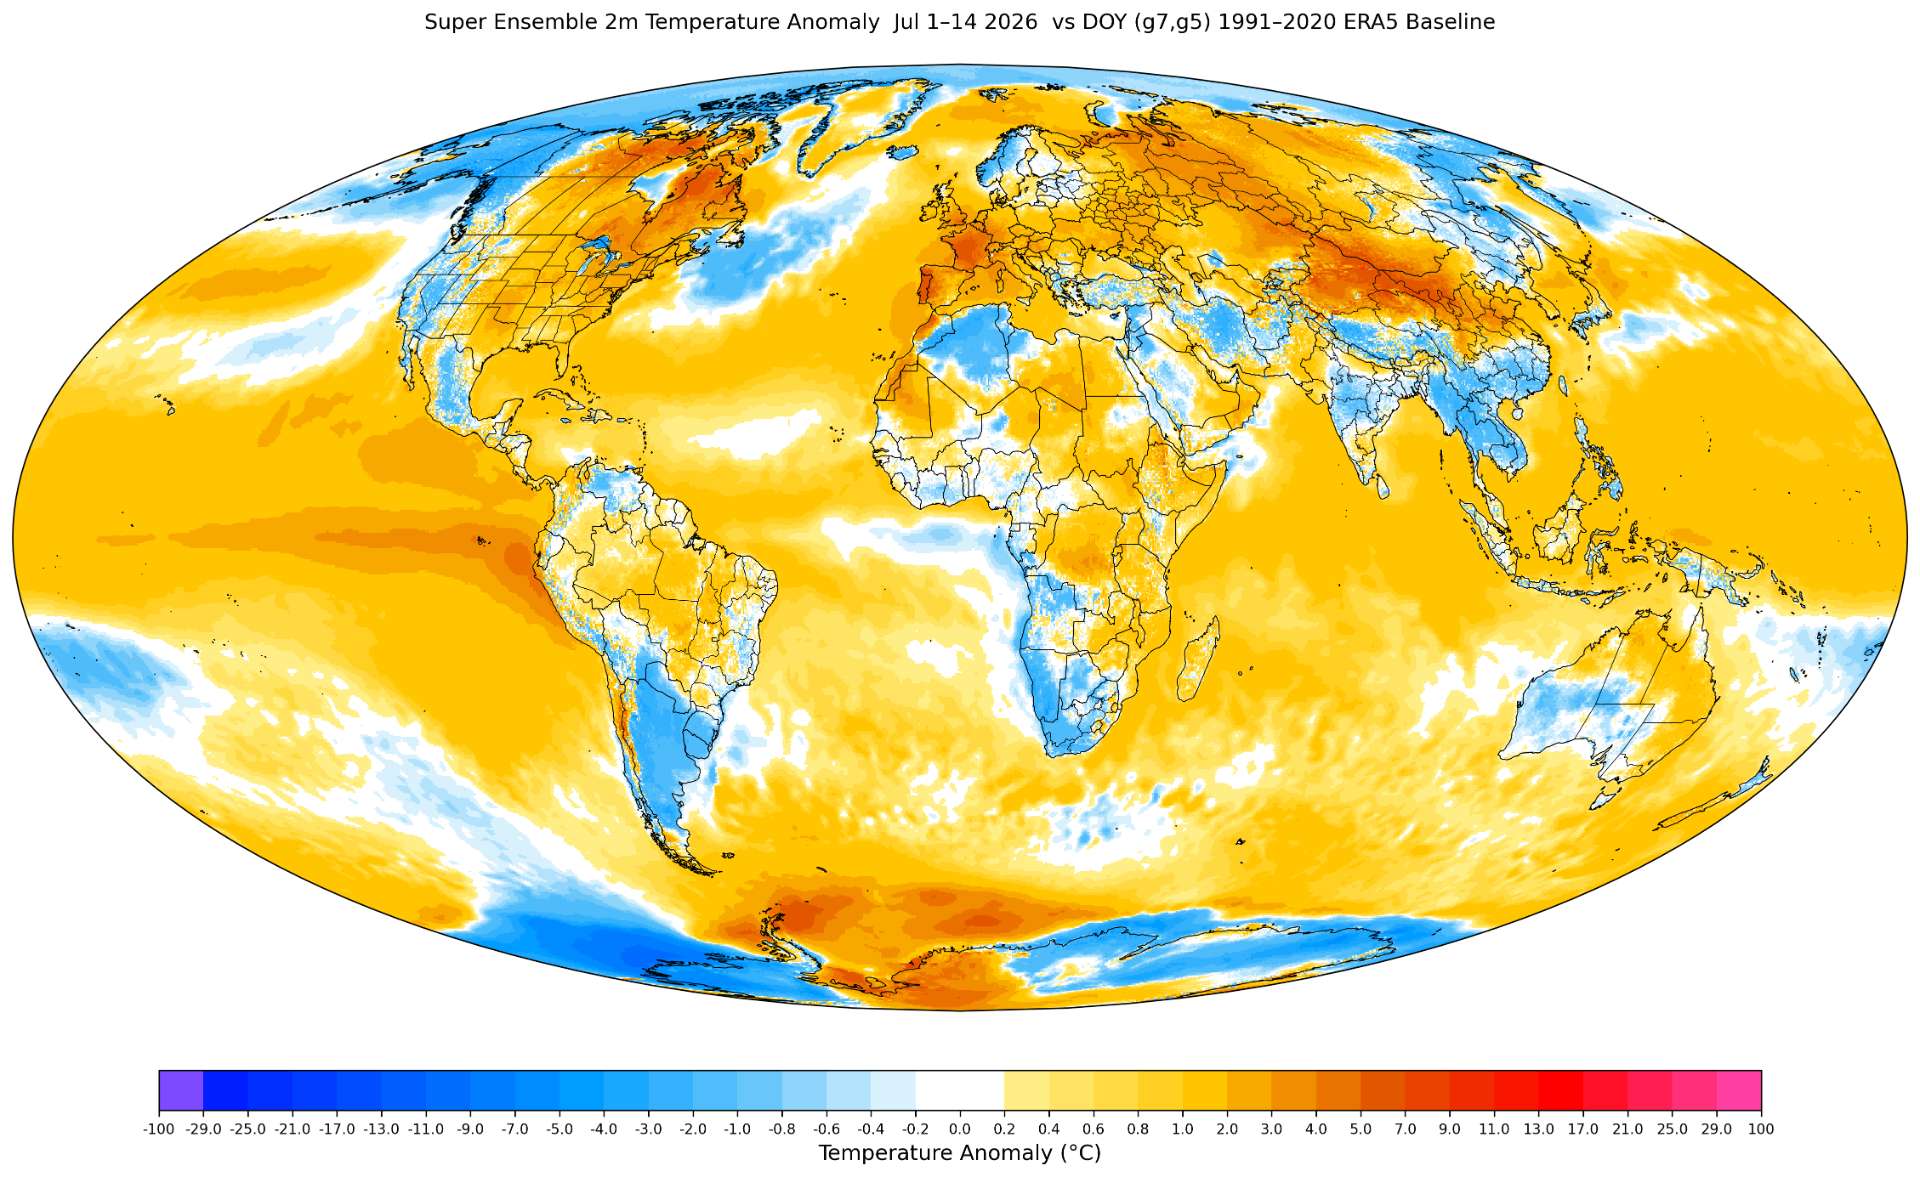
Still anomalously warm (like last month): Weddell Sea/Antarctica, NE Canada.
New warm anomalies: northern China & southern Mongolia, western Europe (Portugal, France). All nino warm anomalies continue to strengthen. In the EPAC we also see a warm anomaly south of Mexico. The North Pacific anomaly (the Blob) is notable, but not as extreme as 2003 in terms of peak anomaly it seems.
July 2023 for same MTD (first two weeks) for comparison:
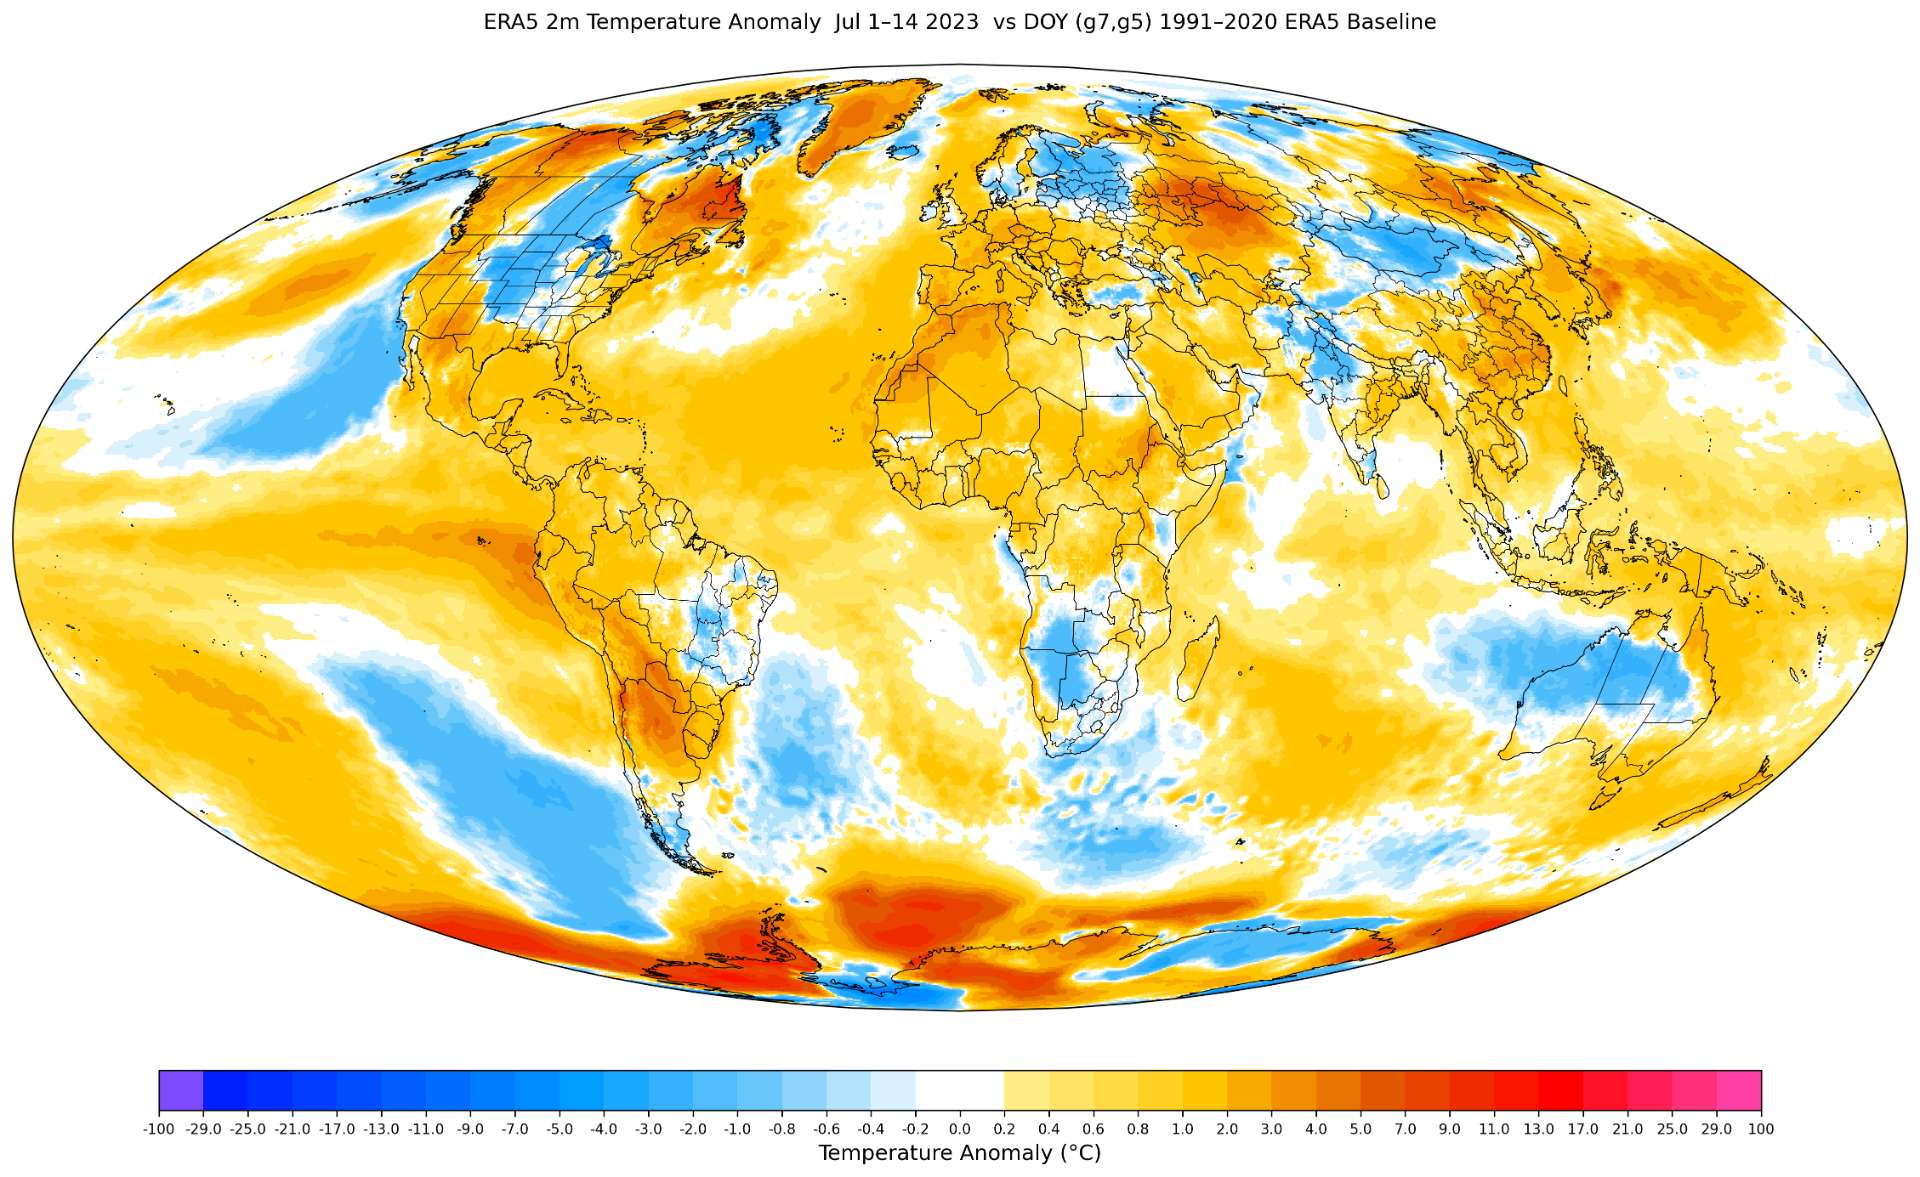
~
My poorly calibrated (biased too cold, not enough spread) EC46 shows the Nino regions getting warmer in latter half of July (Especially Nino 1+2):
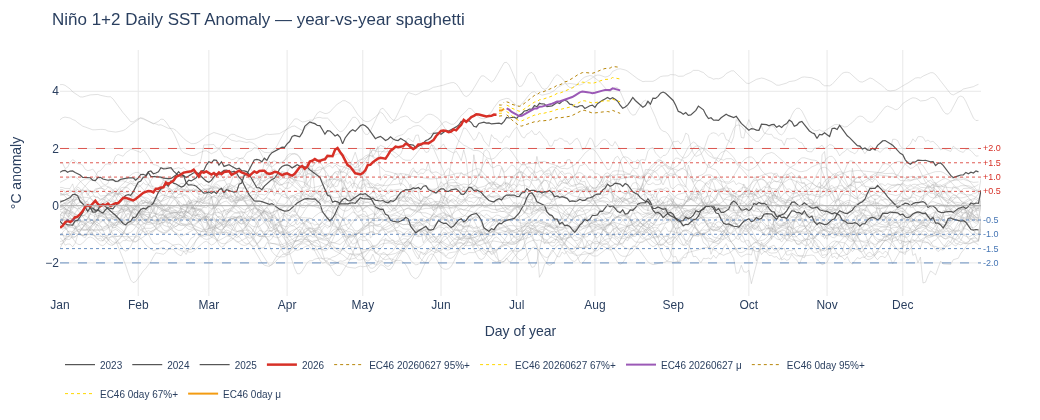
Daily RONI only behind 1997 for latter half of July...
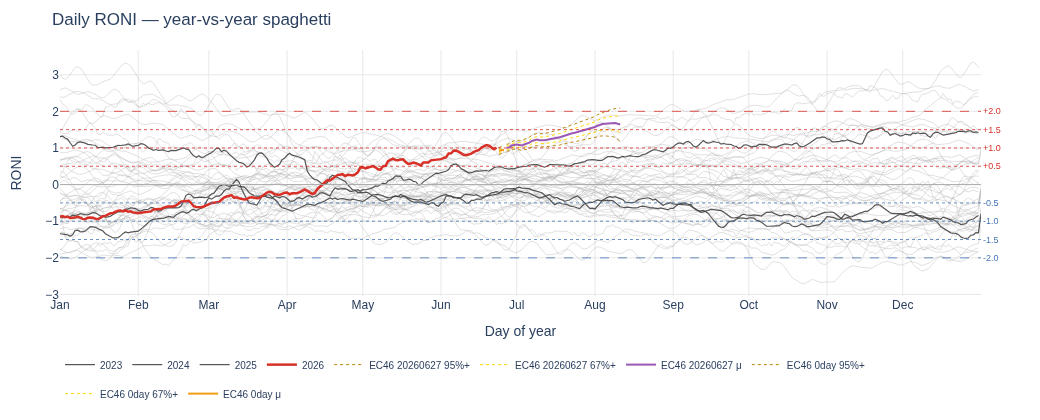
So if these forecasts even come close to validating as conservative as they are, the anomalies should go higher than even the MTD plot shows.
~
As it is right now July LOTI looks like ~ 1.21 +- 0.1 C from just the normal superensemble+climatology.
@zenarxy I have a feeling it's going to be close to the bin edges again, but we'll see.
If ERA5 is accurate Amundsen is going to bias warm the subboxes north of the 40 S. pole subboxes if we don't get Elizabeth this time to balance it out.
@parhizj if we don't get South Africa by 8th then likely 1.16, otherwise 1.17, small difference anyway
@zenarxy We usually get at least 2 SA stations by then based on my past plots, but based on ERA5 it should be fairly homogenous there regardless.
I'm more concerned about Elizabeth. If we don't get Elizabeth (or one of its close neighbors) it will shift away towards the bin edge and closer towards your center point prediction.
I'm confused. It went up slightly in my models for the rest of the month with the last couple days data (to around 1.14-1.15 range) but not all the way up into the next bin!
Yes with El Nino the monthly RONI and Nino34 anomalies for this month are going to be about 0.5C warmer than 2023 was, but that was the case for last month as well, and it doesn't look like it's going to translate into the whole ocean...
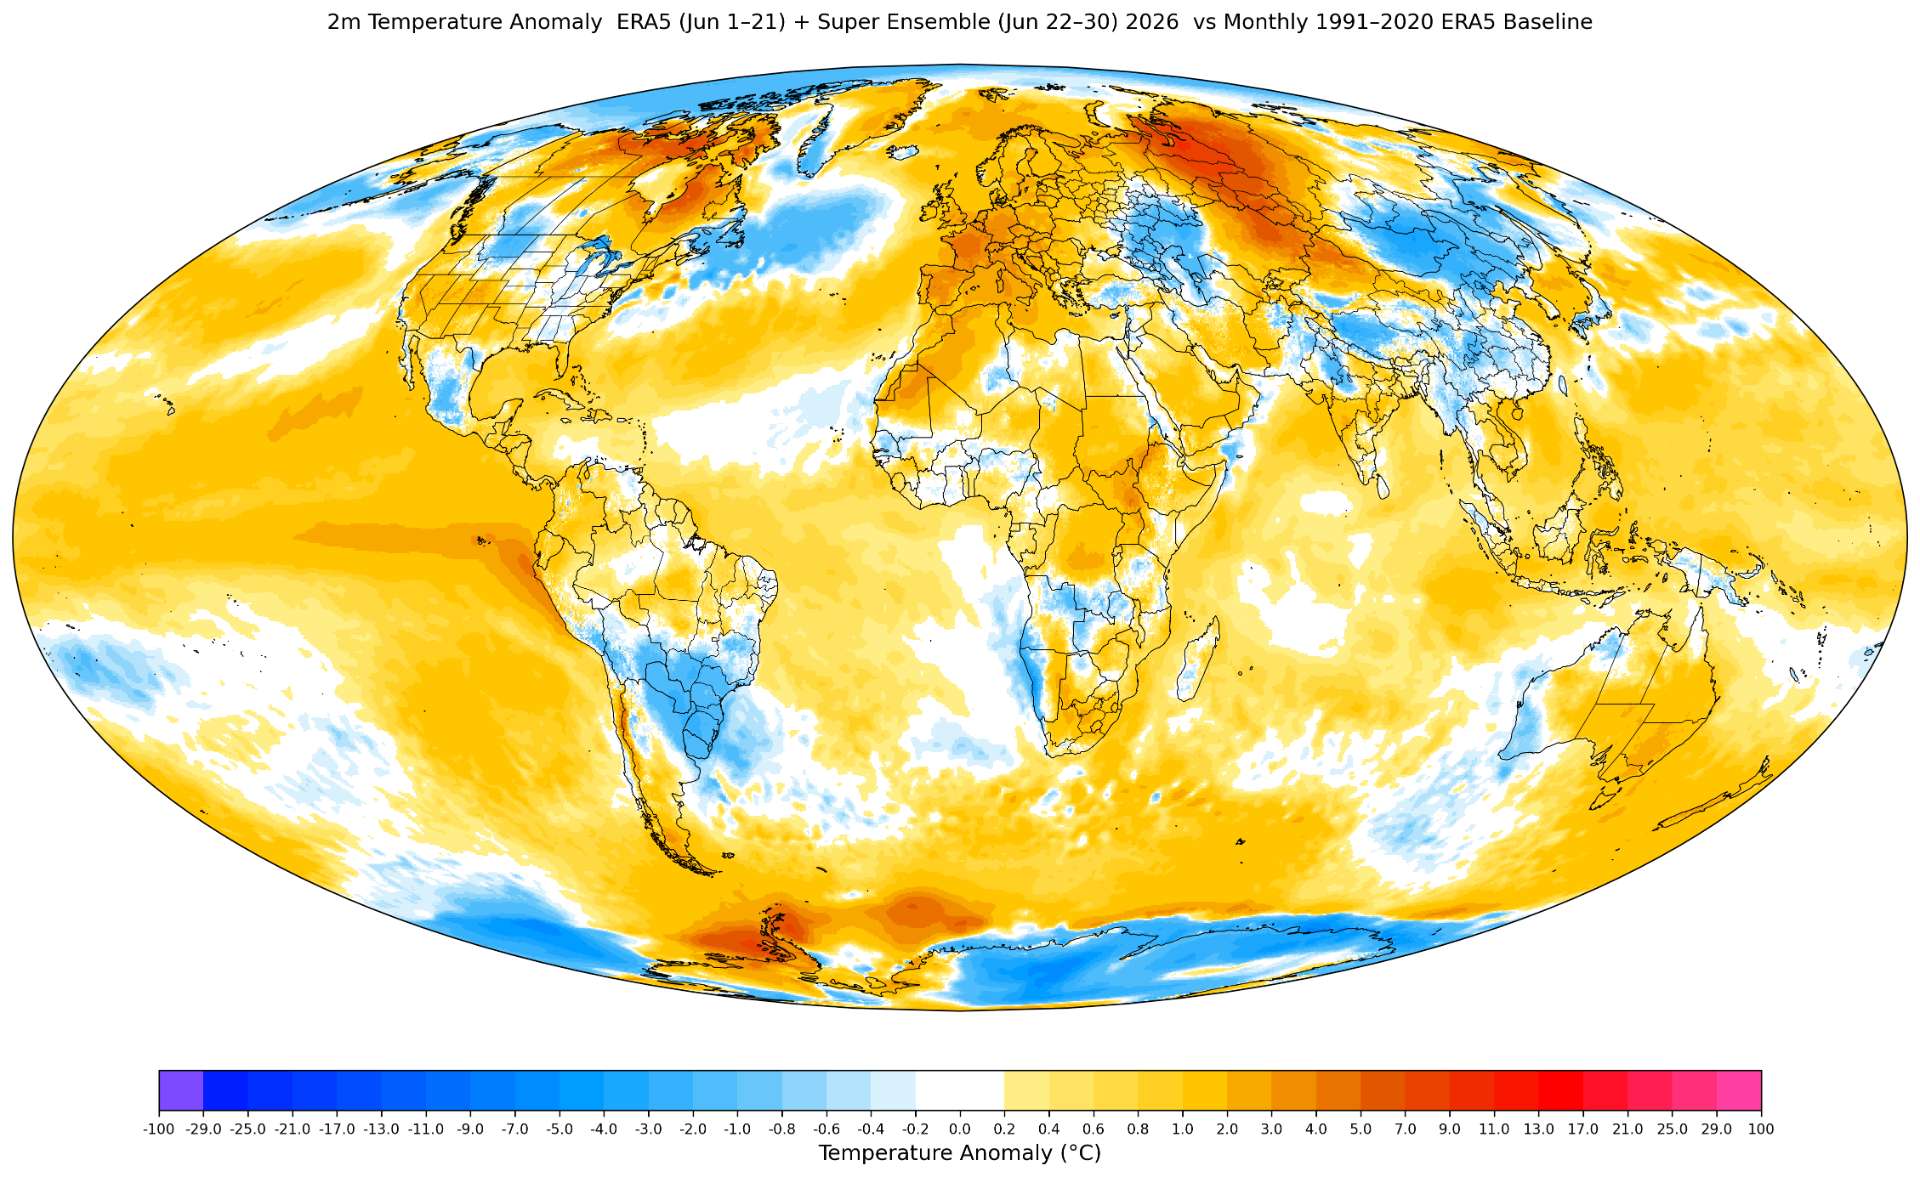
For comparison, I pretend 2023 as the climatology and plot June 2026 (this shows how much cooler/warmer June 2026 was compared to June 2023):
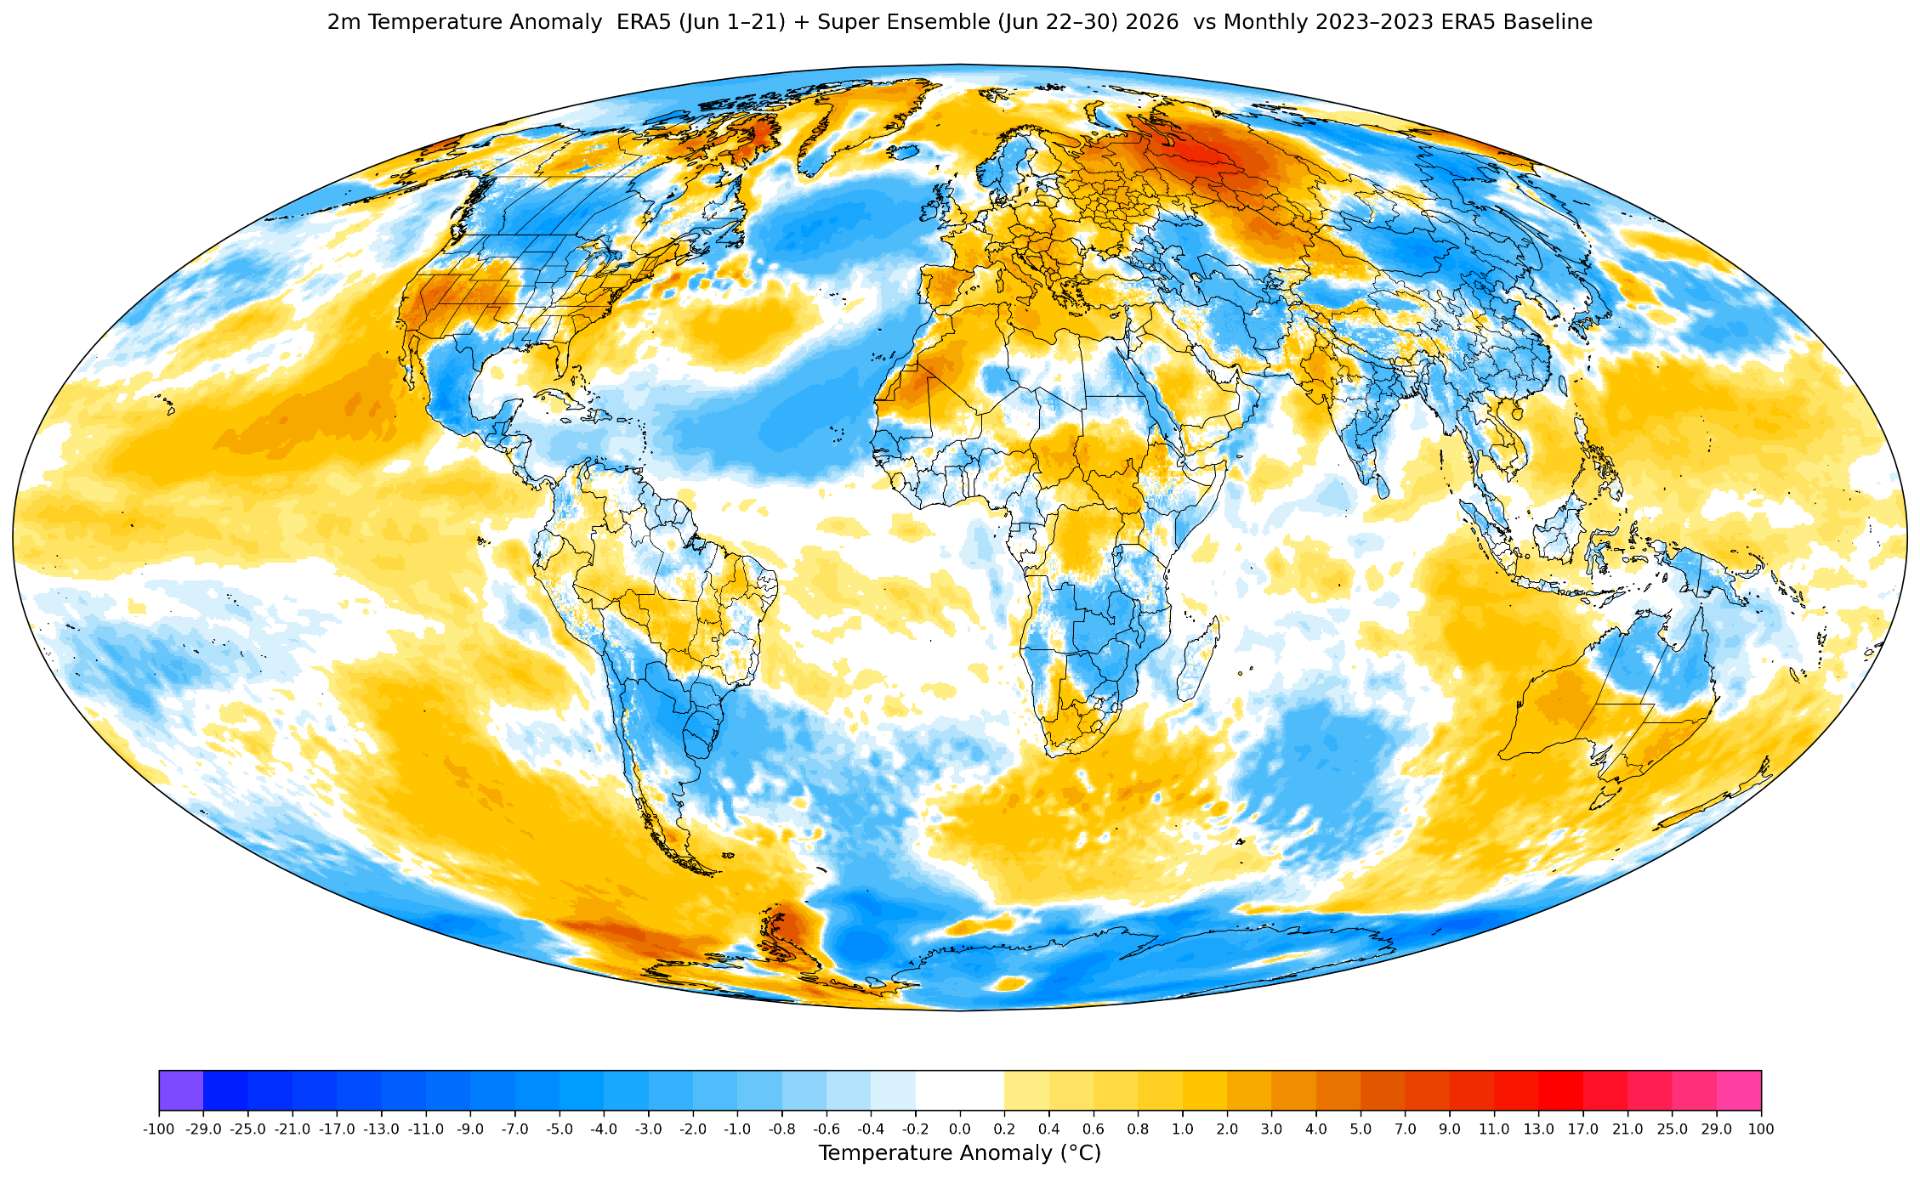
Although warmer overall (especially from Russia, which ERA5 may be overdoing relative to what we usually see after GISTEMP's homogenization), for the southern Hemisphere its mixed over the ocean. Although the anomaly over the tropics in the EPAC is significant. Looks like the warm anomaly over the Canada will also likely be underestimated by GISTEMP if the usual pattern follows. So I'm not seeing this huge hint that it will move beyond the spread of whatever moving average correction I'm already using.
1.1486 is my latest center point prediction...
I hope my hedging this month pays off better than the last....
The ensembles appear to have shifted downwards the last two runs for t2m around the 24th..
Compare the anomaly from 2 days ago to today's estimate
The exercise to discern why it is colder in today's run (especially around the 24th) is left to the reader.
center point prediction now of 1.134 C
End of month dropped again (judging visually, last few days dropped by about 0.08 C).
EPS showing a different scenario for NW US from the 26th onwards (jet stream meandering further south with a (originally mid-level low merged from two other mid level lows over Alaska) low that drops now further south than the other models (AIFS also shows this scenario).
(Eastern) Antarctica got cooler as well.
Yesterday's run for last day of month:
Today's run: