Data is currently at
https://data.giss.nasa.gov/gistemp/tabledata_v4/GLB.Ts+dSST.csv
or
https://data.giss.nasa.gov/gistemp/tabledata_v4/GLB.Ts+dSST.txt
(or such updated location for this Gistemp v4 LOTI data)
January 2024 might show as 124 in hundredths of a degree C, this is +1.24C above the 1951-1980 base period. If it shows as 1.22 then it is in degrees i.e. 1.22C. Same logic/interpretation as this will be applied.
If the version or base period changes then I will consult with traders over what is best way for any such change to have least effect on betting positions or consider N/A if it is unclear what the sensible least effect resolution should be.
Numbers expected to be displayed to hundredth of a degree. The extra digit used here is to ensure understanding that +1.20C resolves to an exceed 1.195C option.
Resolves per first update seen by me or posted as long, as there is no reason to think data shown is in error. If there is reason to think there may be an error then resolution will be delayed at least 24 hours. Minor later update should not cause a need to re-resolve.
June 2025 market
 1,000
1,000🏅 Top traders
| # | Trader | Total profit |
|---|---|---|
| 1 | Ṁ828 | |
| 2 | Ṁ128 | |
| 3 | Ṁ86 | |
| 4 | Ṁ64 | |
| 5 | Ṁ50 |
People are also trading
ghcnm.v4.0.1.20250606:
106.982
Final ERA5 data is now in for May.
My point prediction using ERA5 is 1.111 C
(adjusted upwards from the linear-corrected yearly model of 1.097 C)
Not sure how such large downward corrections are justified in everyone's models if they are relying on ERA5 data only at this point?
I.e. the residuals for the linear corrected yearly model for May have a mean of 0.02 for the last 20 years, which justifies to me the upwards final correction I do using my own recent past errors.
Edit:
It's painfully obvious now I made a simple error here in the above diagnostic. I should have checked the residuals of the yearly model, not the monthly model, which it automatically switched to instead of the monthly model. The yearly model had a mean residual of -0.058 for the last 20 years, and the variance was also higher, making it empirically worse. From now I'll use a much laxer p-value to filter out the monthly models, and only mainly use it diagnostically, but instead use a score model on the recent 20 years of model residuals (mean^2+variance) to decide on which model (year/monthly) to pick.
This leaves May with a prediction of 1.083 C (unadjusted 1.069 C) using the monthly model.
@parhizj I think it should work better, now I guess final number will be 1.05-1.06 the upper bin 95% win
the raw hourly ERA5 data is now available for the 14th:
15.79 for the 13th
and 15.78 for the 14th
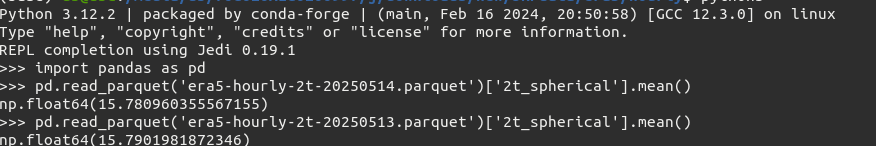
Didn't change my predictions at all...
ECMWF/CDS was undergoing maintenance today so maybe we will get more of the advanced data tomorrow morning I hope?
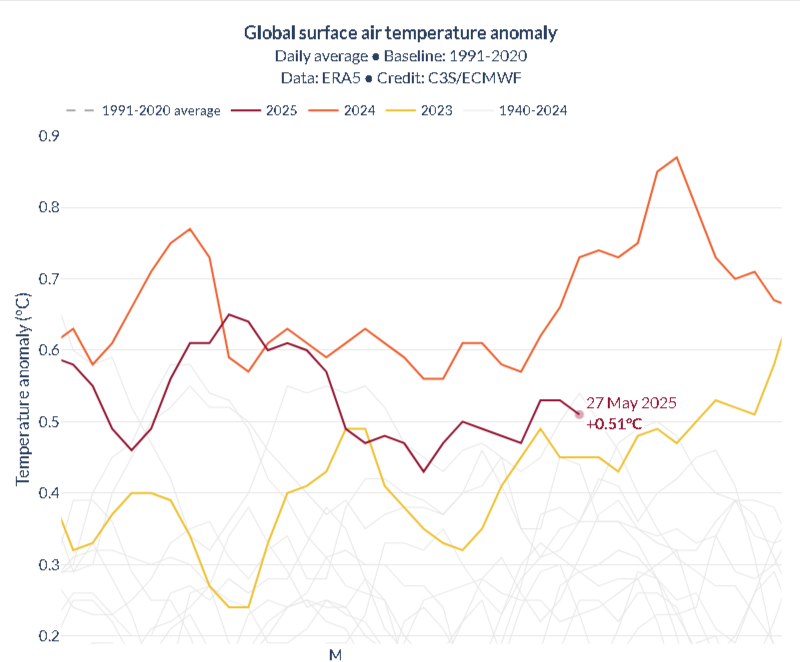
After comparing 2024 and 2025 I sort of can imagine how Polymarket and others are predicting 2025 will be cooler than 2024. After all the first week has been cooler in 2025 than 2024, and it will be a couple days more before it seems before 2025 daily temp meets 2024 daily temps.
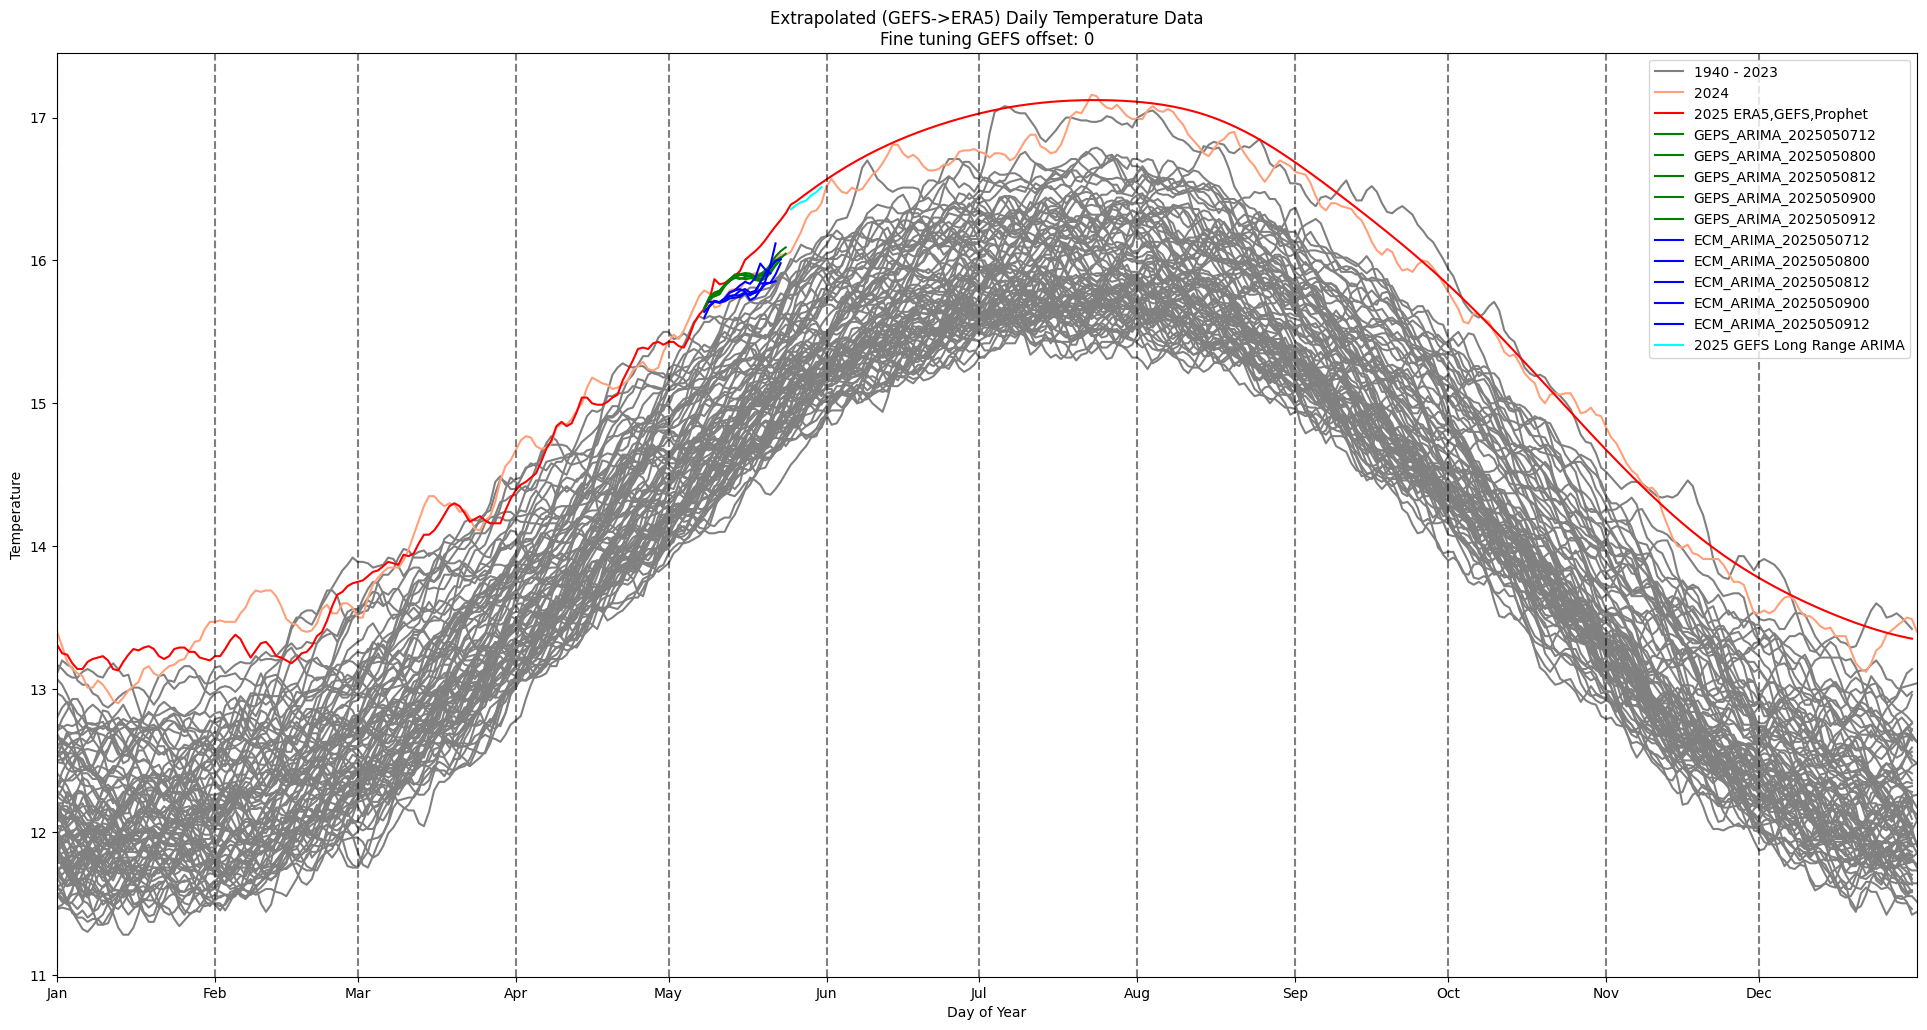
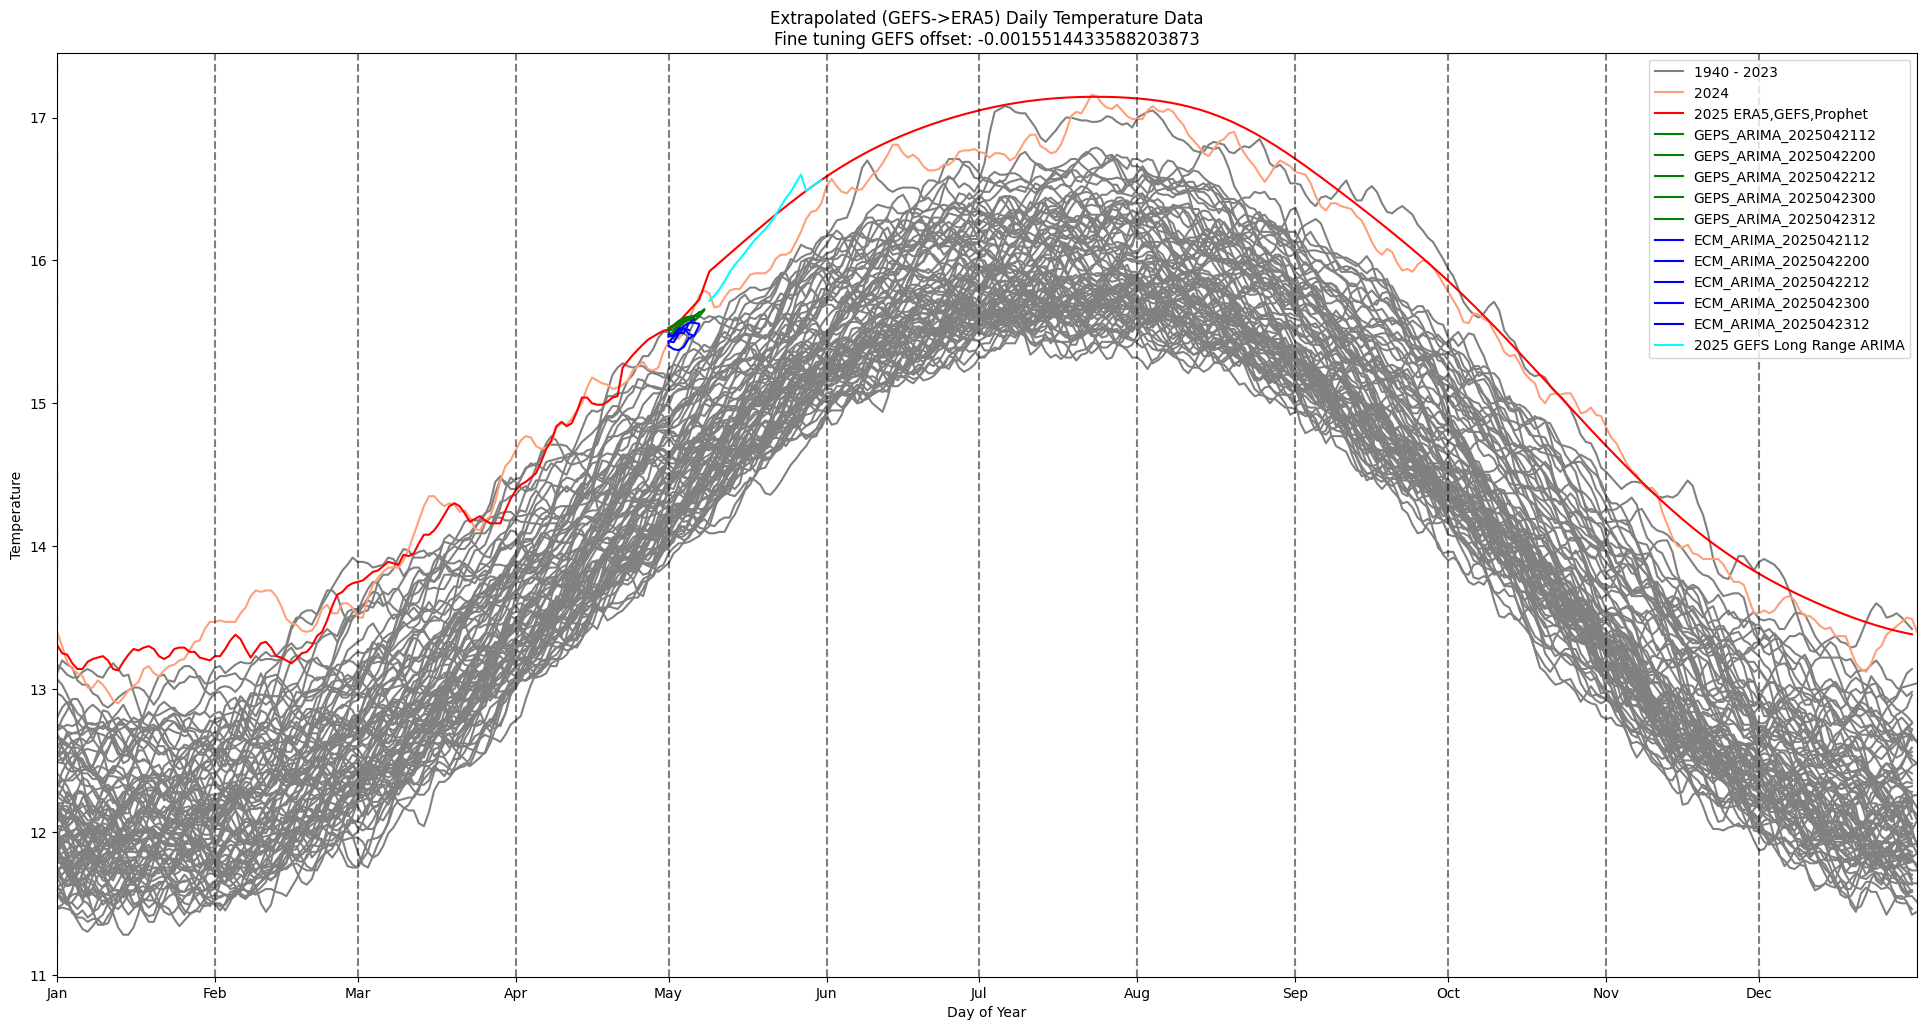
If ECM is to believed it will stay on par with 2024 for the next 2 weeks. GEPS predicting slightly higher temps for a short period within the next week, and GEFS medium range predicting way higher temps at the end of the two weeks, which looks less plausible next to the other models, the historical temps, and recent model error trends; the simple statistical model I use is more in line with GEFS.
As the statistical model I use now is sensitive to only the most recent day's temps, the lowest prediction it would make over this period would be near the middle of the month. For now, despite the slight noisiness in the prediction of the mean temp, the predictions so far have kept within its wide 95% CI for the predictions made recently, so at least its internally consistent (cyan=last prediction, orange=2024, other lines are other predictions for mean temp); mean temp predictions (15.923 C ERA5 -> LOTI of 1.26 +- 0.13 C (95% CI combining the uncertainty from the linear ERA5->LOTI model and the uncertainty from the statistical (ARIMAX) model):
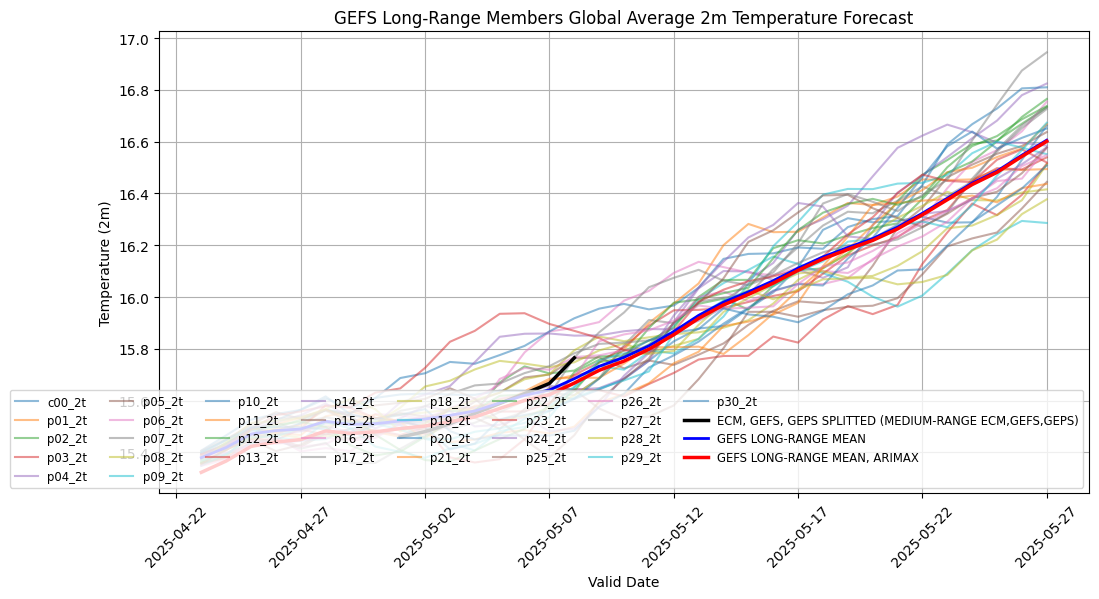
GISTEMP long range from yesterday is already out of date and is ~0.15 C warmer than the split offset between the 3 ensembles.
GEFS medium-range still being the highest of the three in the middle of the month. (long-range is even with prophet extended GEFS)

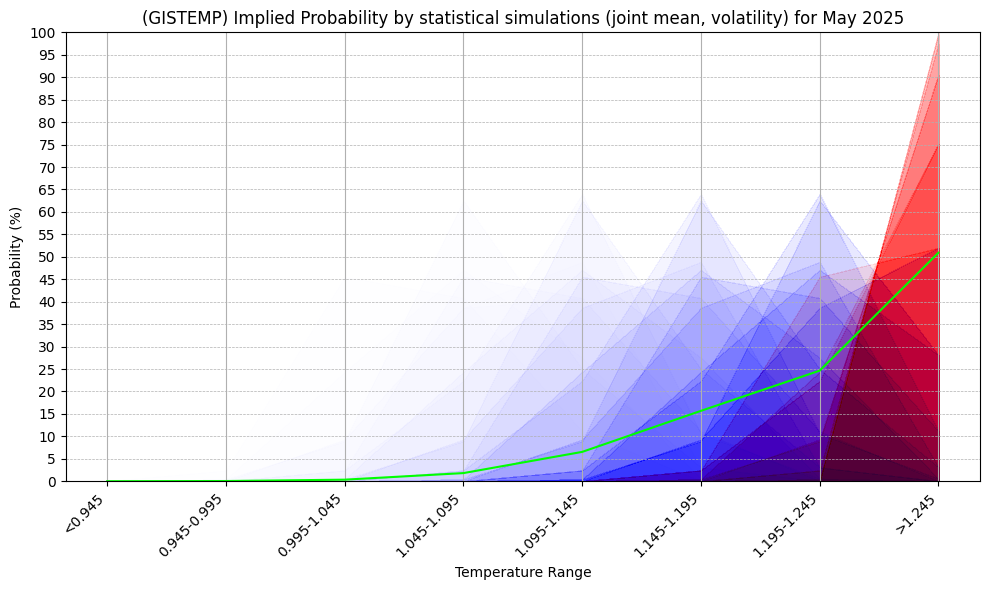
If I was going by intution on these dynamic models alone, I'd say there was still more room for correction, and I'd put more probability mass in the 1.145-1.195 bucket than the 1.22 C suggested by the medium range models alone. (An offset of -0.15C versus -0.10)
However, the pure statistical model is still pointing towards the upper most bucket as deserving of most of the probability mass (latest 1.26C). Today I ran a pure simulation using GARCH on the residuals from the ERA5->GISTEMP linear regression so I could jointly simulate a distribution about the mean temp (from the std dev derived from the statistical ARIMAX model) and accounting for the volatility of these residuals. Rather than a simple count for efficiency I relied on just sampling different ranges of CI (alpha=0.005 to 0.995 in order to cover both sides of the upper and lower CI); the result is a pseudo density-looking map (red upper CIs, blue lower CIs), where far from the green (expected) probability I interpret as probabilities less plausible given by this simulation (nearly white or nearly black areas as implausible):
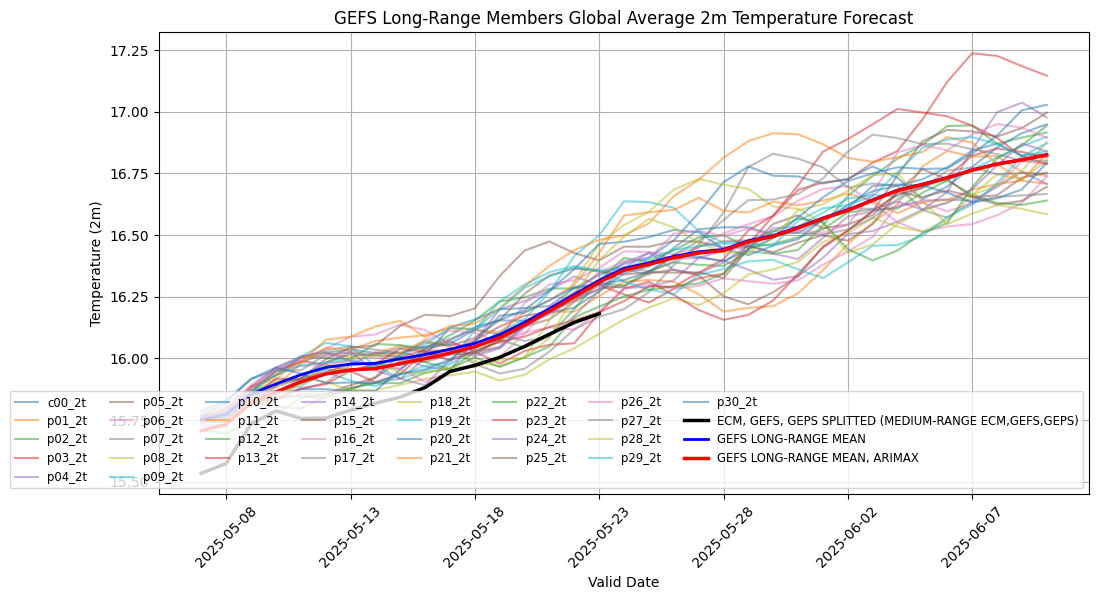
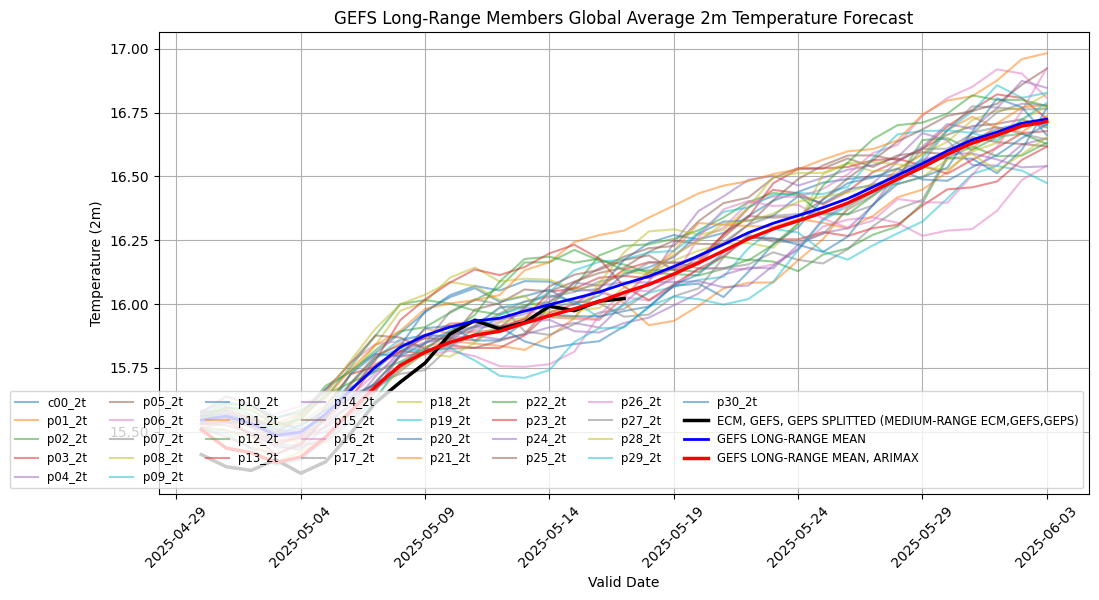
GEFS long-range run finished ~ hour ago. Slightly cooler than last week's temps for the same period, but still showing seemingly implausible temps (low confidence this far out).
The end of the medium range models (~15 days) continue to show high temps tracking near 2024 for the start of May (if not a bit cooler at the end of the first week). 2024 anomaly was 1.32 C.
For the current GEFS long range, the implied 1.4 C anomaly for April seems implausible given a slightly cooler start to April though.
GEFS long range from Wed. (ARIMA adjusted to ERA5) still shows some seemingly implausible temps. The end of the medium range GEFS (tau=384h) is also quite a bit above the recent GEPS means and recent ECM runs.
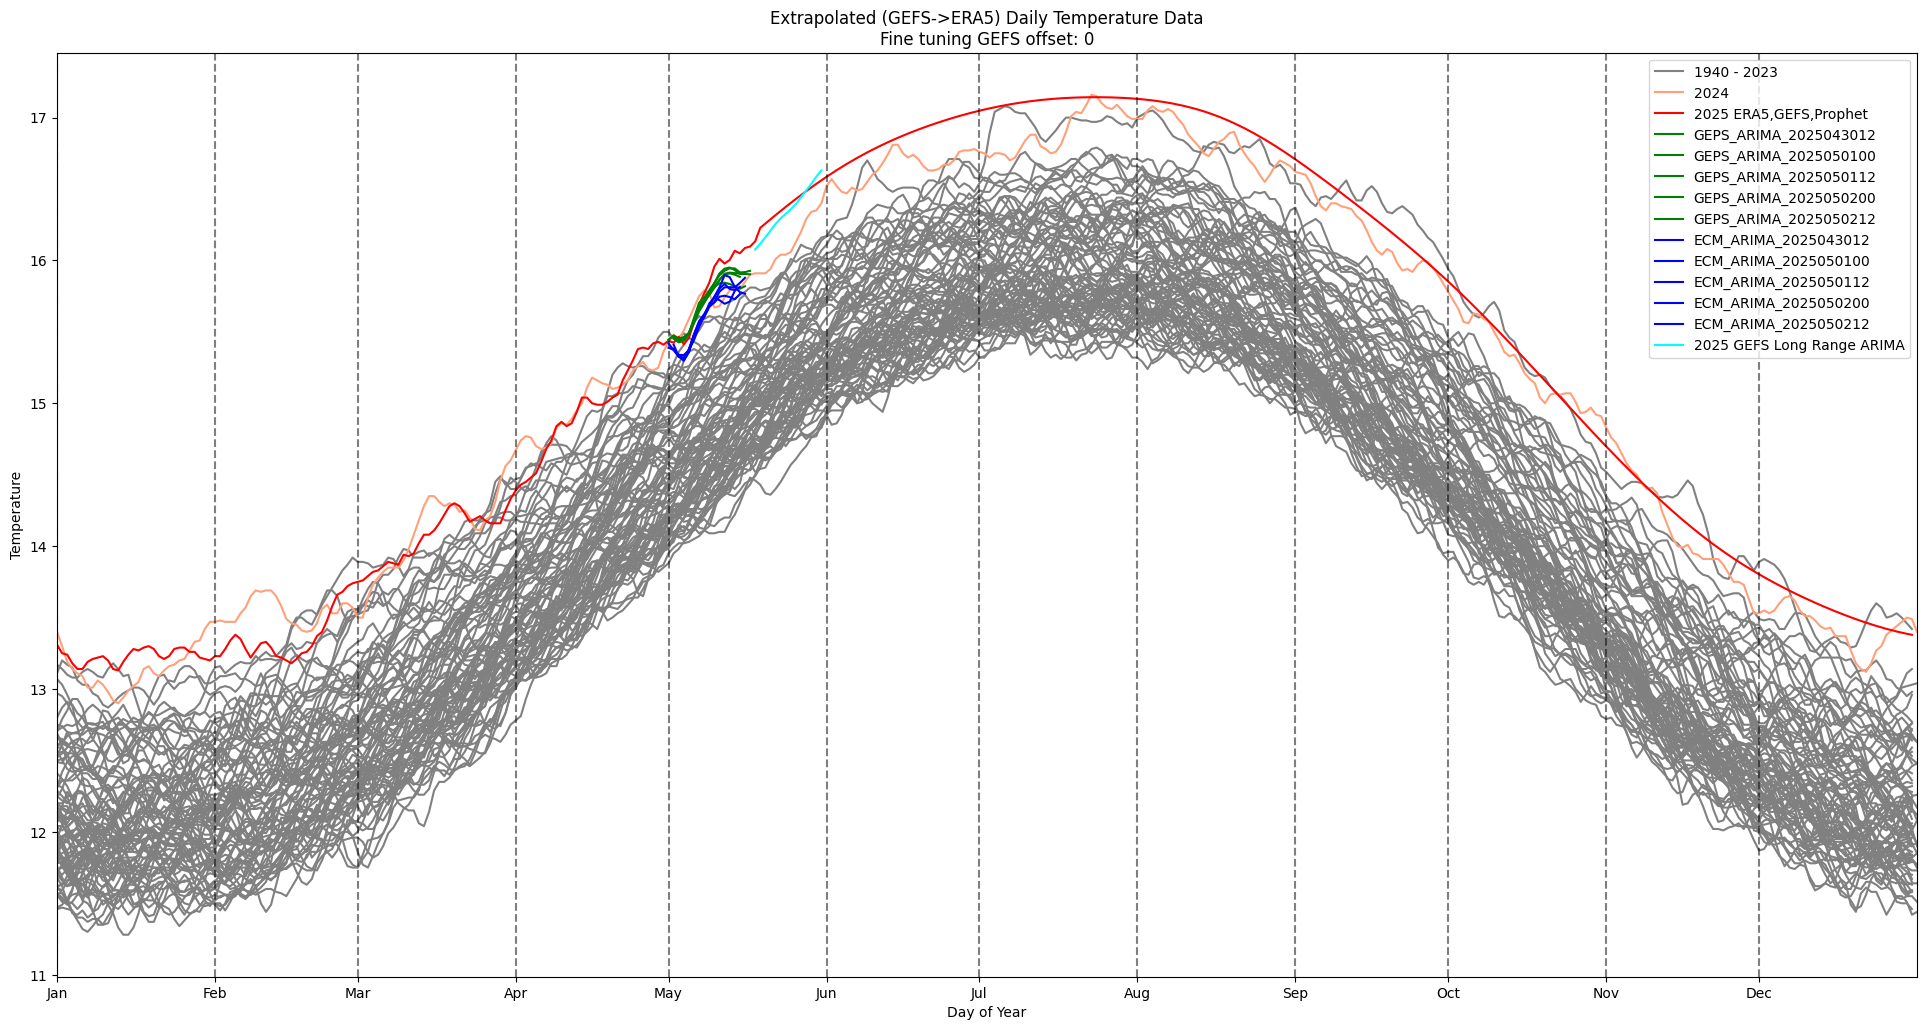
Only two of the (non-arimax) members for May 31 are below 2024's temp (16.52) for the same day. The arimax-adjusted mean is ~ 0.1C higher at 16.63 C for May 31, 2025 compared to the previous year.
This is suggesting an anomaly of ~ 1.35 C for May which still looks on the high end given GEPS, ECM trending a bit lower for the middle of the month. (The mid range split offset between the three models + Prophet for the latter half alone suggests 1.28 C)
@parhizj Interesting. Polymarket's next to least favourite at 22% is >1.24
most favoured 1.05-1.09 32% and 1.1-1.14 32%
https://polymarket.com/event/may-2025-temperature-increase-c
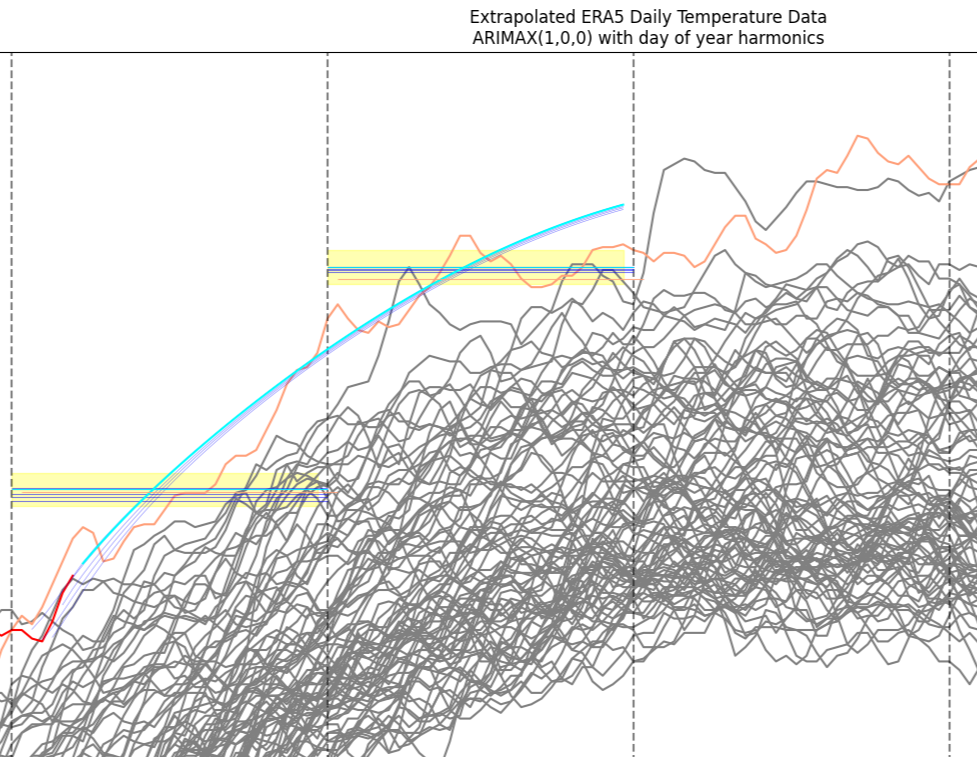
@ChristopherRandles I didn't comment for lack of time, but I've reworked and validated a new purely statistical model over the last few days using only ERA5 data (ARIMAX with a single pair of day of year harmonics as exogenous seems the best model); this suggests an anomaly for ~ 1.26 C for May (15.93 C ERA5 temp) (the variance is almost entirely dominated by the ERA5->GISTEMP uncertaintly).
This temp is roughly coincident with the medium range estimate from the models that is extended by Prophet; the long-range GEFS though estimate is even higher as GEFS though is on the highest end.
@parhizj That is true, total 122% when I just looked. How you spread that between the options is likely to reduce the difference. There is also a range between buy and sell. So for example you can only buy over 1.24 at 10% despite the 7% headline figure shown.
Still a good value option if you think it likely?
@ChristopherRandles i see that's a bit odd but I am not betting there only here, but I agree it is cheap
both the dynamic model predictions, medium and long range suggest the highest bin ; the pure statistical (arimax) model is very sensitive so it did shift the mean temp down now a bit lower by one bin recently, but most of the probability mass is by far still in the highest bin -- its the most conservative estimate I have and I still am betting much more conservatively than it suggests based on the shifting trend, and how many future chances there are to update
@parhizj I actually think it is normal to have a gap between the buy and sell price and it is this site that "is a bit odd". Can now buy >1.24 at 3.4c for a $ while 1.10 to 1.14 has quite a wide range of 37c to 50c for a $.
So >1.24 seems to have got less likely per the polymarket trades and also per traders here but still a higher price here.
@ChristopherRandles The advance era5 data that comes from pulse Copernicus hasn’t been updated in days… I checked the era5 data on CDS this morning and it is the same, only covers fully up to the 13th, and only about half the day of the 14th.
This made me wonder if people are temporarily going back to cfsr for more up to date data or mixing the two? The model updates alone haven’t shifted the probabilities for me more than 1-2% total in the most relevant bin since the last update…