
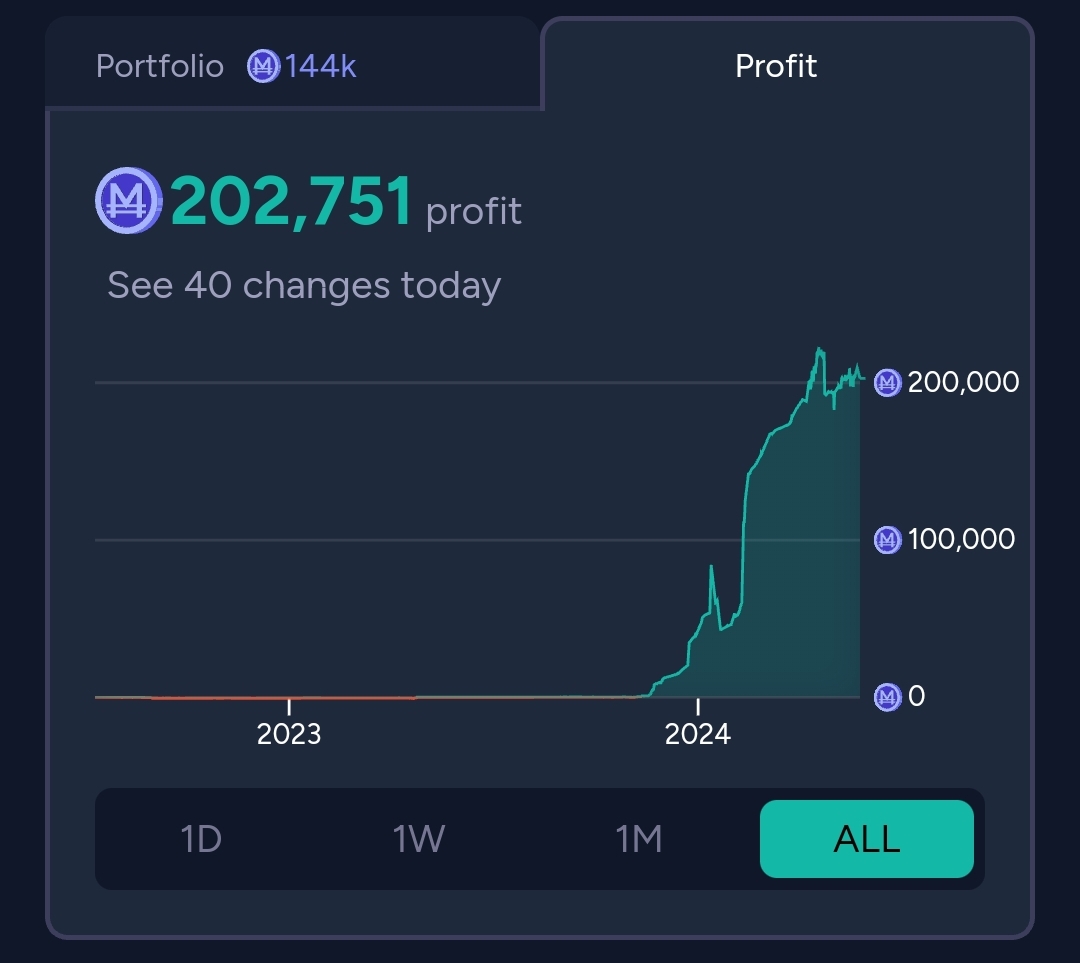
seemed consistent-ish for a while, then funky stuff happened. Back on a 10 day funky-less streak now. Can I keep my all-time profit above this line until the end of the year?
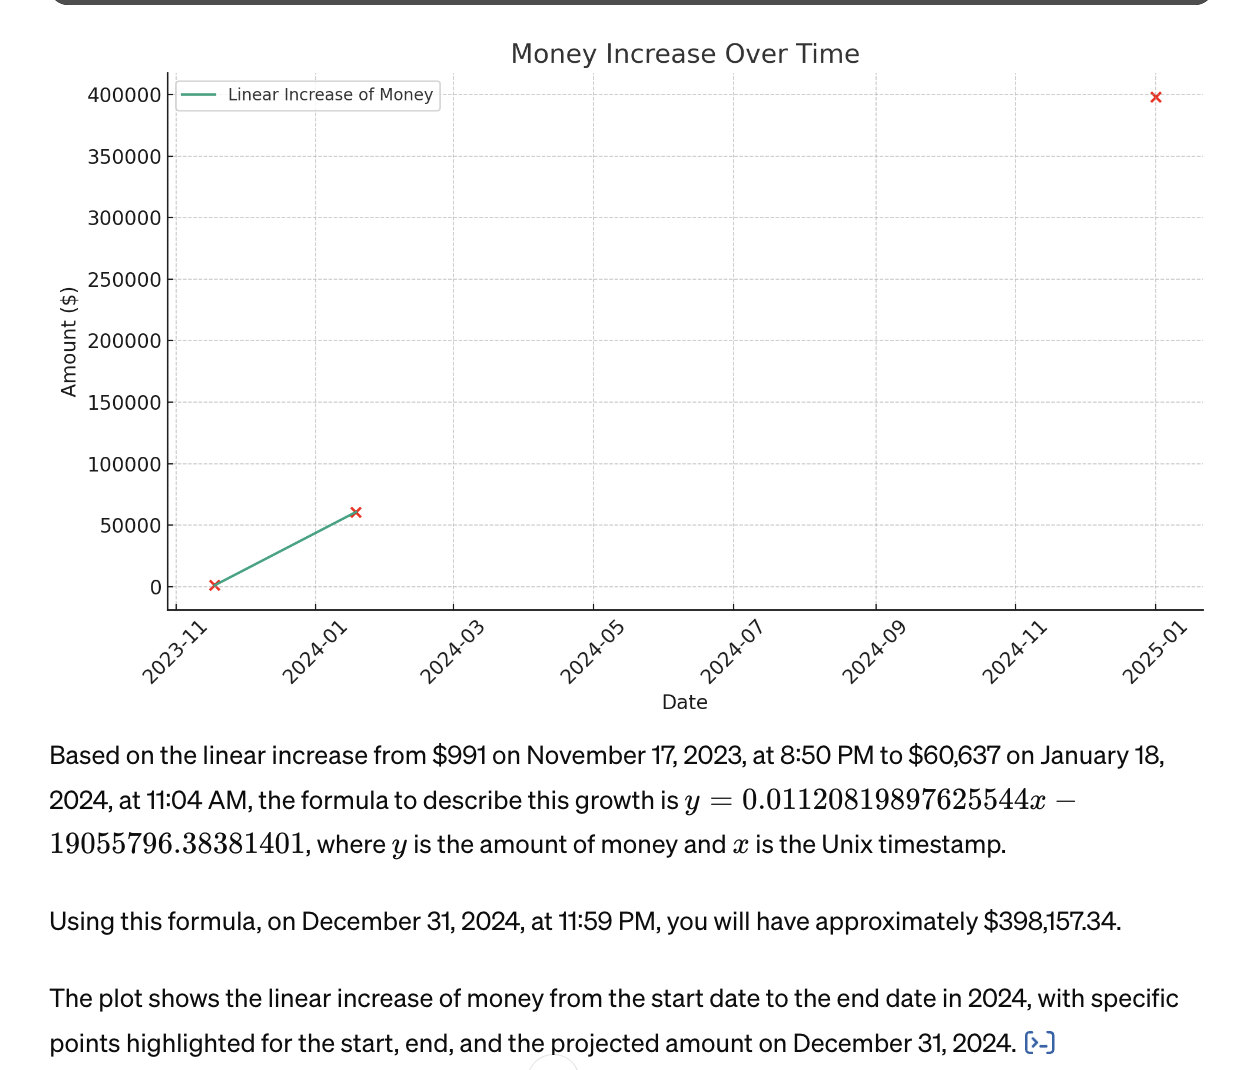
Details: Unless I (or chatgpt lol) made a mistake somewhere, the precise curve I'm going with is such that:
Y(X) = profit at time X
resolves to all((Y(X) > 0.01120819897625544 * X − 19055796.38381401) for X in {timestamps in 2024 but after market creation})
 1,000
1,000🏅 Top traders
| # | Trader | Total profit |
|---|---|---|
| 1 | Ṁ301 | |
| 2 | Ṁ78 | |
| 3 | Ṁ61 | |
| 4 | Ṁ56 | |
| 5 | Ṁ51 |
People are also trading

@Bayesian which, upon saying that, is making me realize that this will be tough (unless manifold grows or wild stuff happens. that seems likely, but yeah if it doesn't and the year is boring then it's a bit of a hassle and i'll probably be less active in a few months)
@mattyb Let's say the first datapoint is
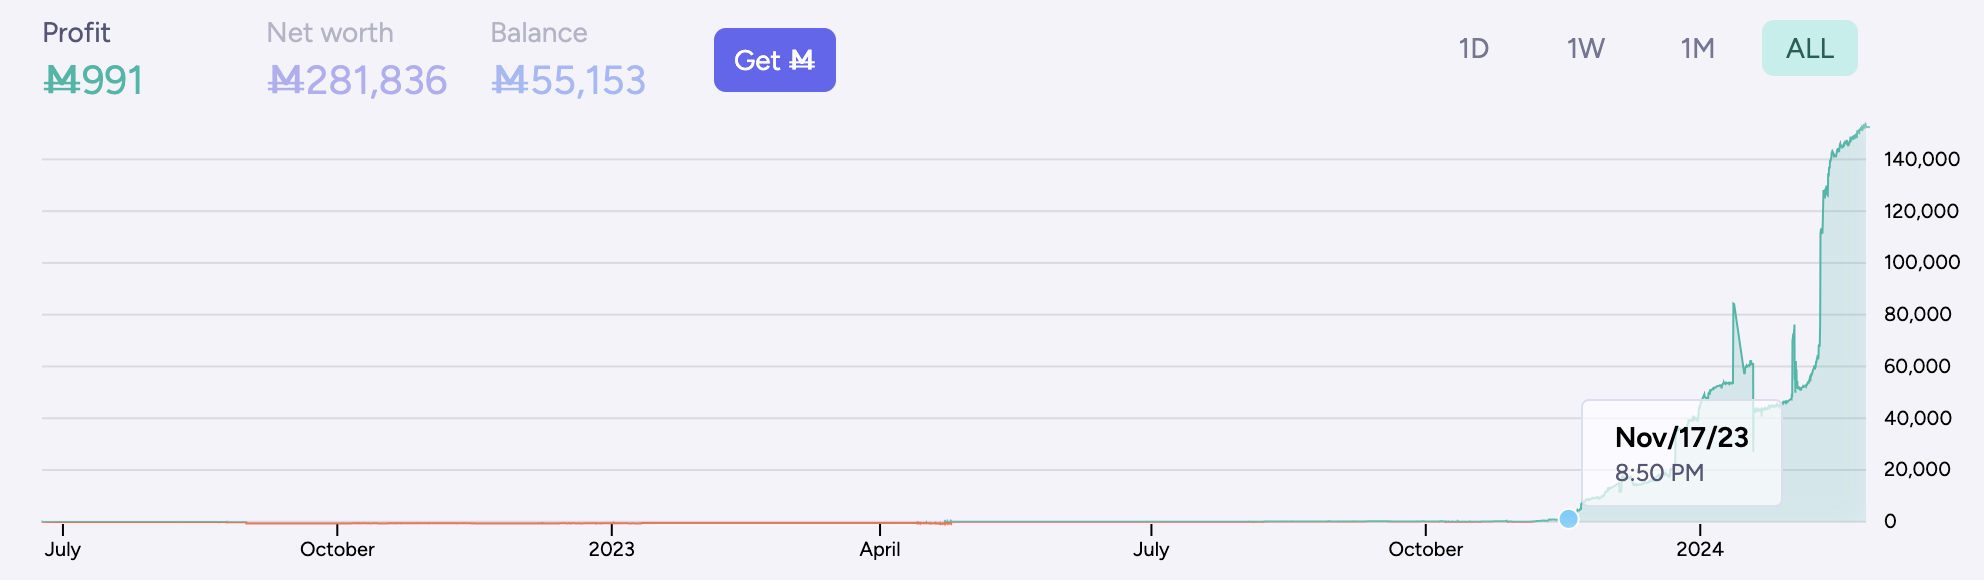
and second is

So
Y(X) = profit at time X
resolves to all((Y(X) > 0.01120819897625544 * X − 19055796.38381401) for X in {timestamps in 2024 but after market creation})
(unless I made a mistake in that formula in which case it resolves to whatever I meant to say instead of the mistake)