🏅 Top traders
| # | Trader | Total profit |
|---|---|---|
| 1 | Ṁ6,683 | |
| 2 | Ṁ1,728 | |
| 3 | Ṁ1,550 | |
| 4 | Ṁ1,514 | |
| 5 | Ṁ1,085 |
People are also trading
Can someone explain me something, on the site I see :
Number of shares outstanding as of June 2024 : 2,462,000,000
Price = $135.58
So market cap should be : 3.337 * 10^11 ??
Also :
Earnings in 2024 (TTM): $34.07 B
Market cap: $3.335 T
P/E ratio as of June 2024 (TTM): 10.3
But $3.335 T / $34.07 B = 97.89 ??
https://www.tipranks.com/stocks/nvda
Here they say :
Shares Outstanding : 24,598,341,970
Price to Earnings (P/E) : 76.6
(also not what I get when I try to do the math (I am >90), but I am unsure if I am using the correct value for the earning)
What I am missing ?
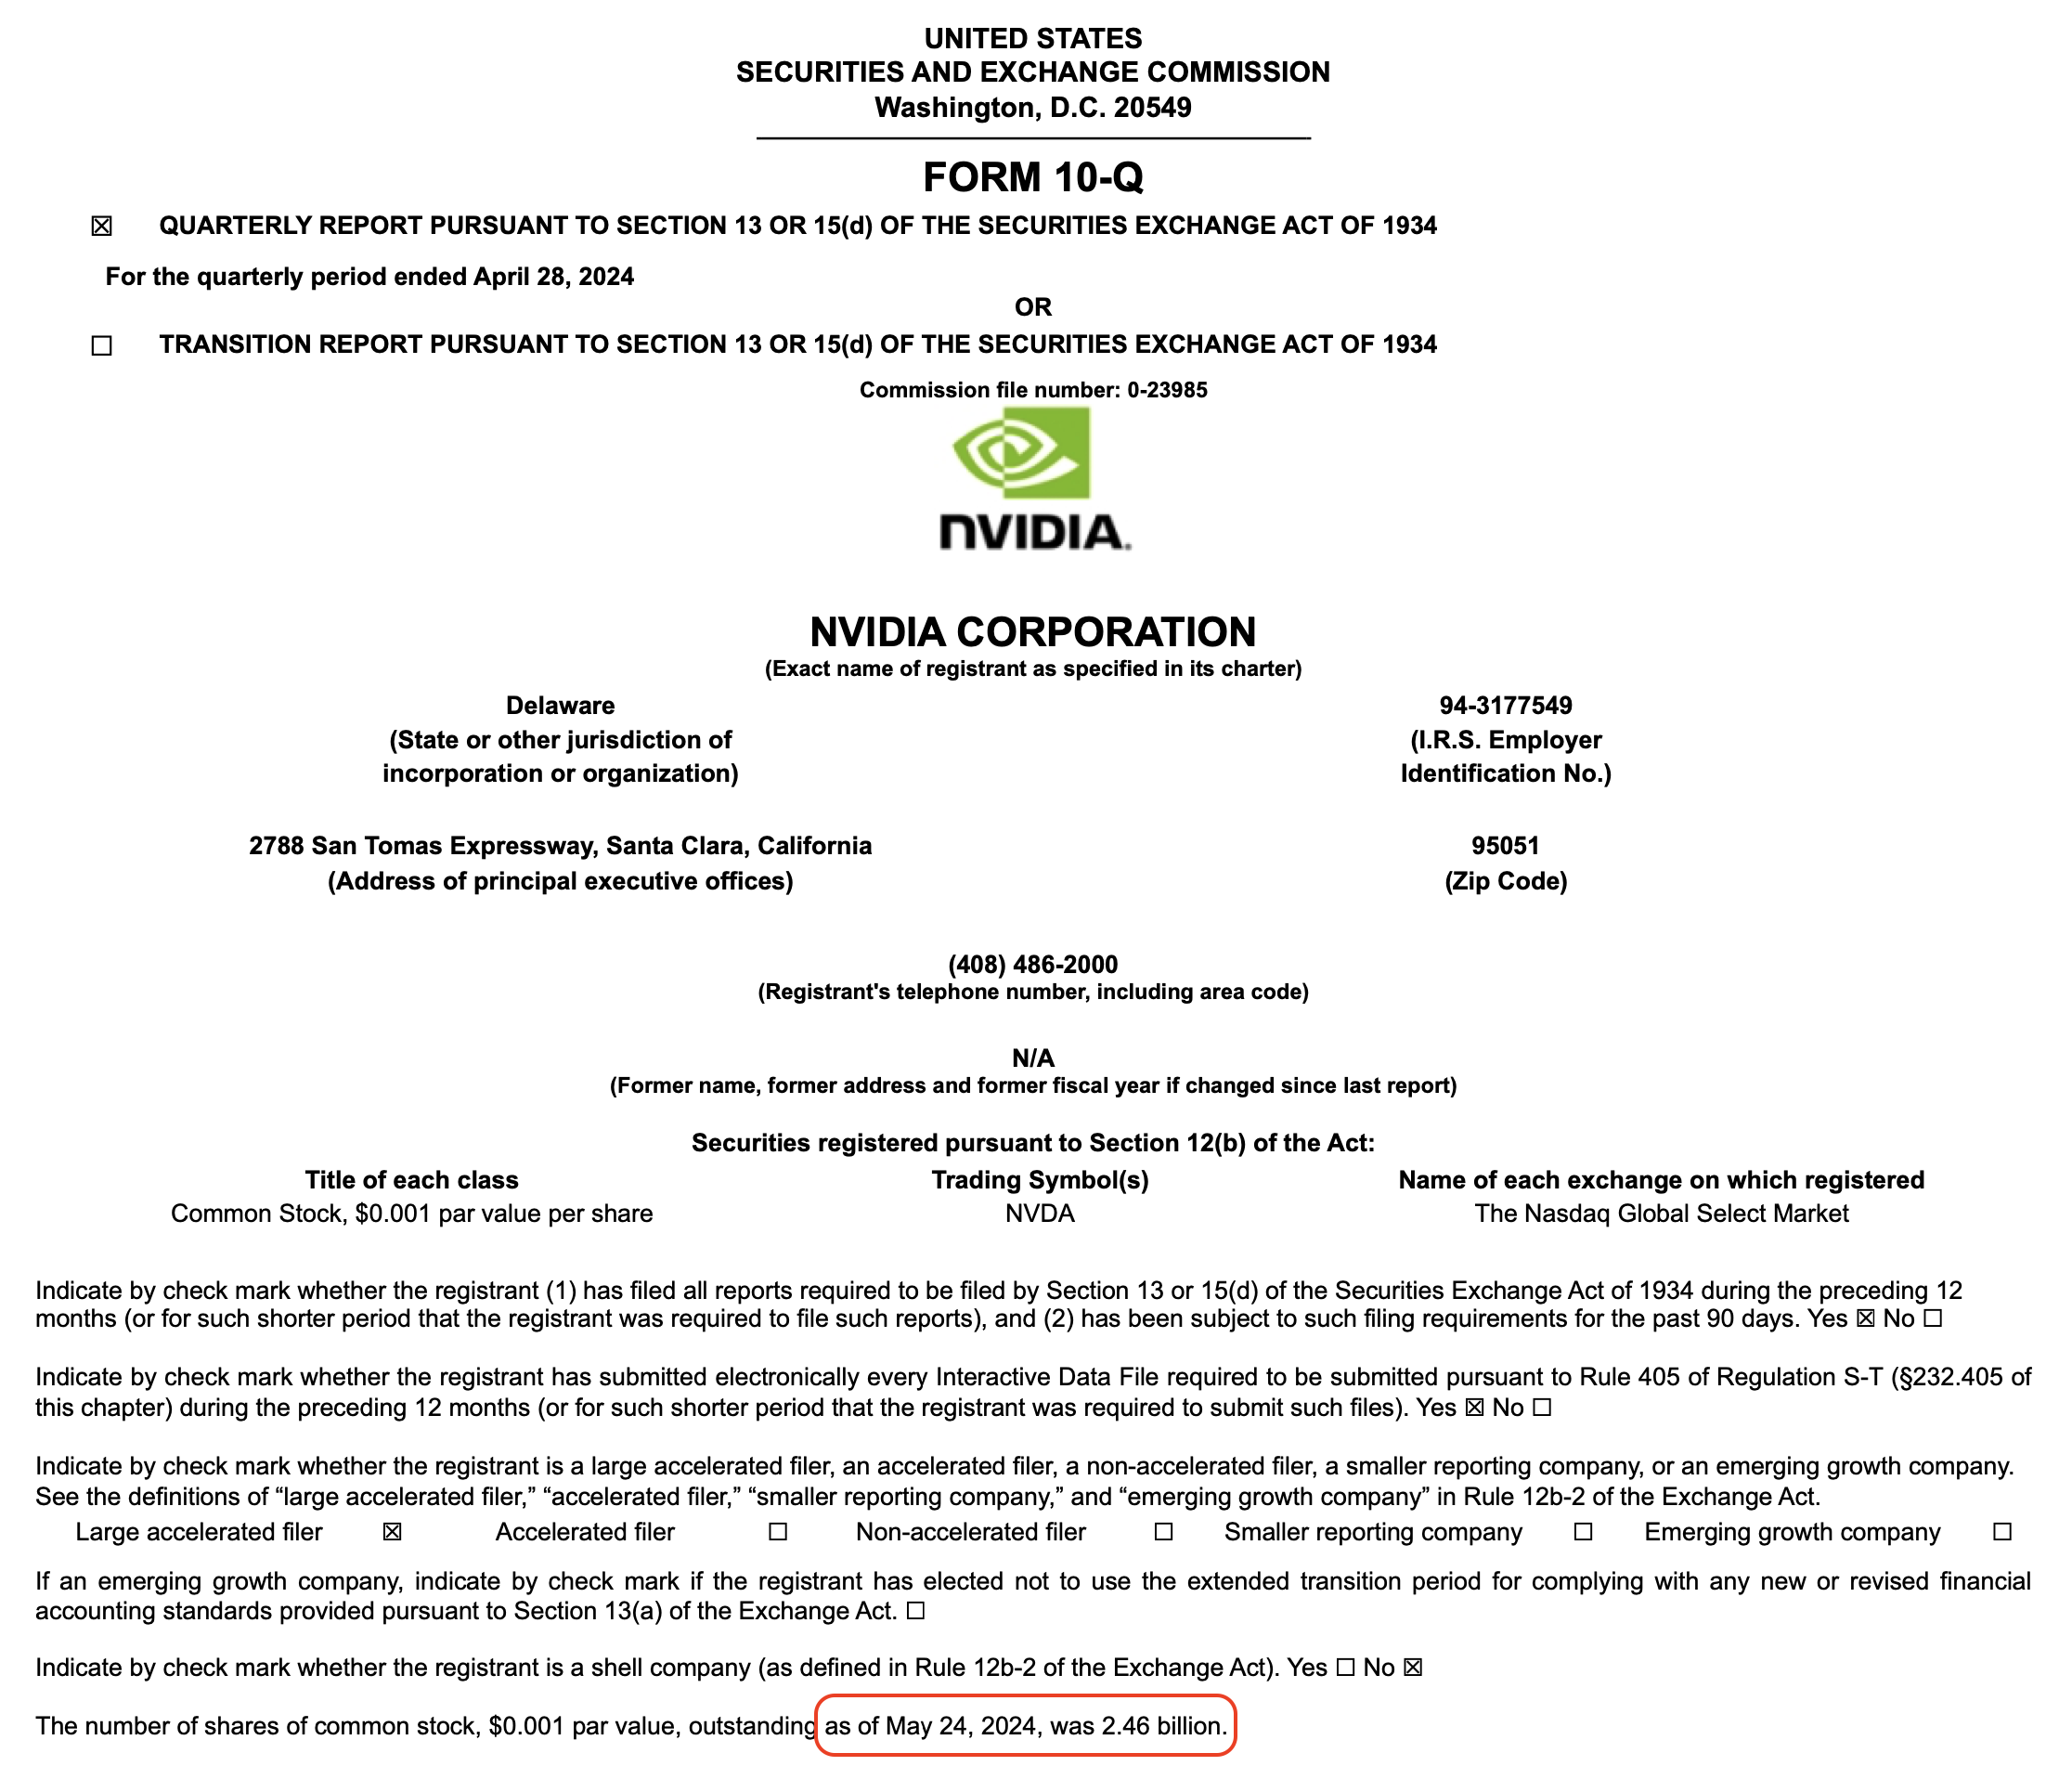
The shares outstanding at 28 April 2024 were 2459million
https://s201.q4cdn.com/141608511/files/doc_financials/2025/q1/NVIDIA-10Q-20242905.pdf
but the $135.58 price is after their 10 for 1 share split so it is mainly that you need to multiply your 3.337 x 10^11 by 10 to get 3.337 x 10^12 or 3.337T
Using shares as at 28 April (instead of weighted average over quarter) 2459 M * 135.58 * 10 =3.334T also make a small difference and is a little nearer.
P/E ratio quoted is normally the fully diluted figure so if there are lots of stock options that may to be granted to directors and employees that might reduce 97 towards 76? but I have not tracked down all the figures to properly check and ones I have seen suggest it is not that.
eg Qtr ending April 28 Earnings 14881 million
Basic weighted average share 2462 million
Diluted weighted average shares 2489 million
Basic EPS for qtr 6.04
Diluted EPS 5.98
Those 6.04 and 5.98 are too close to explain 97 vs 76 difference
135.58/5.98 = 22.67 but that is only a quarters earning so multiply by earning 34.07 for year /14.881 for quarter to get ~60. This is a rough estimate, it is possible that prior to 10:1 split number of shares has been going down due to share repurchases.
Not sure if this helps on this one but that is as far as seems sensible to go.
Market cap always uses the latest known share count, currently 2.46b as of May 24, 2024 (from Chris' linked 10-Q cover page), adjusted for the split which happened on June 7, so x10 = 24.6b shares.

In this case it coincides with Chris referenced 2459m as of April 28 (taken from same 10-Q p.6 Condensed Consolidated Statements of Shareholders Equity), but the right figure to use is from the cover page, and can be slightly different if issuance/repurchases happen in the interim between EoQ and 10-Q redaction.
So, market cap as of Friday close was 126.57*24.6 = $3113.6b
As for P/E and EPS, must use the diluted numbers as Chris said instead of the latest share count as in market cap which explains some of the difference, but the bigger issue with that site info is they didn't adjust EPS for the split so they have it almost an order of magnitude off. And then sometimes the data providers do non-GAAP EPS which smoothes some stuff, and/or exclude one-time items like restructuring charges and such all of which can get pretty obscure, but not always. Anyway, let's see if using the GAAP figures I can get a closer P/E to the 74 given in various sites.
For EPS (ttm=trailing twelve months) must add up the last 4 quarterly reports, not just the latest $5.98 as Chris did for Q1 FY2025 (ended in April 2024), and then adjust for the split. So, we'll also need the EPS for Q2, Q3, and Q4 of last Fiscal Year 2024 (periods ending in July 2023, Oct 2023, and Jan 2024, yeah I know that's confusing). However, the Q4 filing is a 10-K annual report which only gives the EPS for the whole year, so instead we might subtract last year's Q1 EPS from the full year EPS then add that to the $5.98 for this Q1. But instead of looking at the 10-Qs and 10-K I'll get the figures from the corresponding press releases (all linked here), look for the line "GAAP earnings per diluted share" mentioned near the top:
Q2 $2.48
Q3 $3.71
Q4 $4.93
Q1 $5.98
----------
ttm $17.1
split adjusted: $1.71
P/E 126.57/1.71 = 74.02 ...phew! 😅
upgraded to basic
