I think I spotted a mistake in @EliezerYudkowsky's post Causal Diagrams and Causal Models, published in October 2012.
My comment with the mistake description: https://www.lesswrong.com/posts/hzuSDMx7pd2uxFc5w/causal-diagrams-and-causal-models?commentId=7HQBtja6xTA5JA8L3.
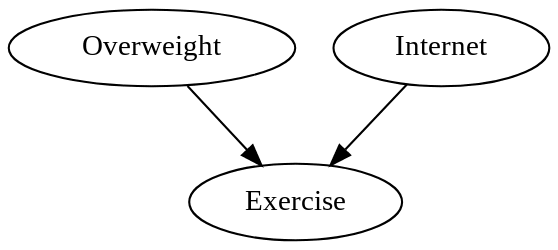
There are hundreds of comments under the post, but I couldn't find anyone calculating/comparing P(O|I & not E), P(O|not E), P(I|O & not E), P(I|not E). Yudkowsky's model would suggest that the first should be less than the second and the third should be less than the fourth, but actually, the two pairs are approximately equal. People calculated those with E instead of not E, and it works out fine; I suspect that the numbers in the data have not been generated to let the reader correctly infer the causal graph.
Is this a real mistake, or am I missing something?
Resolves Yes if Yudkowsky says it's a real mistake.
Otherwise, resolves to an opinion of a majority of >4 people who've read Pearl's book on Probabilistic Inference, if the opinion of a majority exists.
Otherwise, resolve to a consensus among people who've read the sequence, if it exists.
Otherwise, resolves No if Yudkowsky says it's not a mistake.
Otherwise, resolves No if someone persuades me it's not a mistake.
Otherwise, resolves N/A.
(Please don't make dishonest statements to manipulate the market.)
(I'm not going to hold a No position on this market.)
If the mistake is left intentionally, it still counts as a mistake for the purpose of this market.
Edit: for the purpose of the resolution criteria, anyone legitimately saying something on behalf of Yudkowsky counts as Yudkowsky saying that
 1,000
1,000🏅 Top traders
| # | Trader | Total profit |
|---|---|---|
| 1 | Ṁ1,985 | |
| 2 | Ṁ752 | |
| 3 | Ṁ158 | |
| 4 | Ṁ109 | |
| 5 | Ṁ68 |
People are also trading
Resolved to No, as I think the data could’ve been generated in a valid way, even though it does not represent the causal structure well, doesn't allow inferring it the way the post says you should infer this kind of causal structure, and the data doesn’t have properties you’d expect it to have according to the post
I think I don’t buy the story of a correct causal structure generating the data here in a way that supports the point of the post. If two variables, I and O, both make one value of E more likely than the other, that means the probability of I conditional on some value of E is different from the probability of I because I explains some of that value of E; but if you also know O, than this explains some of that value of E as well, and so P(I|E=x, O) should bd different.
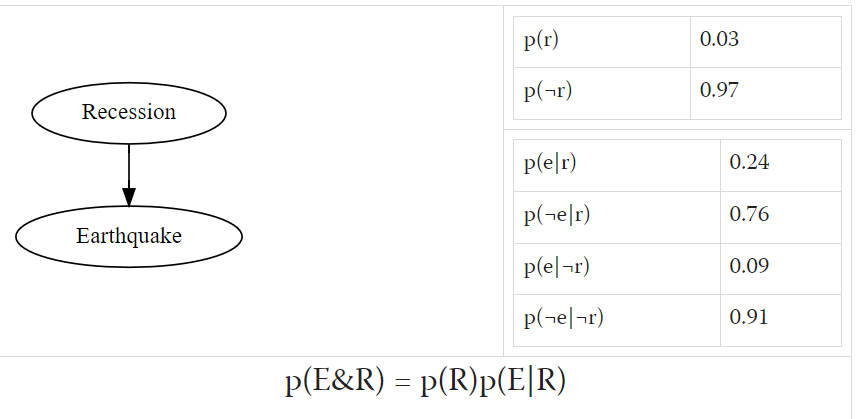
The post describes this example:
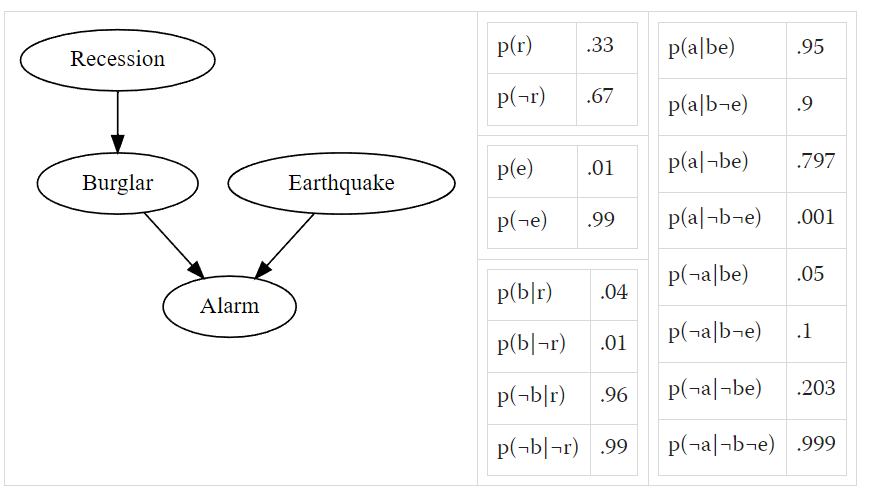
> This may seem a bit clearer by considering the scenario B->A<-E, where burglars and earthquakes both cause alarms. If we're told the value of the bottom node, that there was an alarm, the probability of there being a burglar is not independent of whether we're told there was an earthquake - the two top nodes are not conditionally independent once we condition on the bottom node
And if you apply this procedure to “not exercising”, we don’t see that absence of conditional independence, once we condition on the bottom node. Which means that “not exercising” is not at all explained away by internet (or being overweight)
but if you also know O, than this explains some of that value of E as well, and so P(I|E=x, O) should bd different.
You don't need this for every value of x to be consistent enough with the causal graph, you just need it for some value of x. And the data in the post have that for some value of x.
@DanielFilan Maybe a better way of putting it is this:
Question: What's a different causal graph that does let you infer that I is independent of O given E=yes, but does not let you infer that I is independent of O given E=no?
Relevance of that question: If you found such a causal graph, you'd prefer it to the graph shown in the post.
Answer: There is no such causal graph, because that isn't the sort of thing causal graphs can express. You either infer conditional independence of I given O for all values of E, or you don't infer conditional independence for any value of E.
@DanielFilan the procedure described in the post, when there’s a value that’s explained and can be explained away, doesn’t work, because the value increased by O and I is E=N.
(E is a binary variable; it doesn’t make sense for one of its value to be explained, but not for the other)
A Python script simulating the process: https://colab.research.google.com/drive/18pIMfKJpvlOZ213APeFrHNiqKiS5B5ve?usp=sharing
@ms I agree with David Johnston that the alleged error isn't an error. I think the problem you're having is modelling the conditional probability of E as coming from two numbers: one for the influence of I on E, and one from the influence of O on E. But the causal graph only says that it can be modelled with four numbers (probability of E given each setting of O and I). So the probabilities can violate your model but still be consistent with the causal graph, and with what Yudkowsky says about the graph (at least under my interpretation of what he's saying).
https://x.com/OrionJohnston/status/1728372665231245498?s=20 seems like someone that has read pearl believes it isn't an error (and is the first person replying to a twitter question on the subject)
@TheBayesian I don’t expect more relevant people to see it & don’t want it on my Twitter page
I think I may have realized one source of misunderstanding: in the lesswrong comment you say "That would imply that P(O|I & not E) should be less than P(O|not E); and that P(I|O & not E) should be less than P(I|not E). But actually, they're approximately equal!" while in later comments you use language like "I sent the post to my IMO-gold-medal-holding friend, he's read it, we talked, and he confirmed he thinks P(O|I & not E) should not be equal to P(O|not E) in this causal graph". To make my position clear, I believe that for the O->E<-I model, P(O|I & not E) exactly equals P(O|not E) has zero probability of being true, while there are many ways for P(O|I & not E) approximately equal P(O|not E) to be true [for example the data given in the lesswrong post, or my spreadsheet]. Did your gold medaller explain why its impossible for the distance between P(O|I & not E) and P(O|not E) to be less than 0.01?
@rb in real life, it wouldn’t be impossible for data to be any way, just highly unlikely. But the data in the post was generated to show correspondence to a specific causal graph. The process of generation contained a mistake. Two of the four inequalities are correct (5% vs. 10% and 6% vs. 11%) and two are incorrect, not demonstrating the strong inequality you’d expect to see with the causal graph. It’s not that “it’s unlikely for the numbers to be exactly the same”; it’s that the probabilities should be noticeably different in a specific direction. It’s not the case that Yudkowsky generated the data correctly, but added pseudo-randomness did something with, like, a <1 in a trillion chance and made the causal graph not correspond to the data. It’s the care that there was a mistake in the process of generating the data.
@ms These responses keep going in circles, I say your assertion is wrong and this counterexample disproves it, you respond that your assertion is true and the counterexample violates the assertion therefore disproving the example.
I think I should go back to spelling out my counterexample. To reiterate my earlier comment: you say "Overweight and Internet both make exercise less likely. That would imply that P(O|I & not E) should be [much] less than P(O|not E)". If that is true, then if I start with the O->E<-I model where Overweight and Internet both make exercise less likely, and end up showing P(O|I & not E) NOT being much less than P(O|not E), I must have made a mistake somewhere. Since nothing in my example is any more complicated or advanced than anything in your spreadsheet, it will be easy to point out my mistake.
@ms A. You say "Overweight and Internet both make exercise less likely. That would imply that P(O|I & not E) should be less than P(O|not E)"
B. I say that is wrong, and provided a counterexample where the O->E<-I model is true, Overweight and Internet both make exercise less likely, and P(O|I & not E) is approximately equal to P(O|not E)
These can't both be true. If you're being sincere, it should be simple to point out what in my counterexample you disagree with.
I'll repeat my example in more detail here. Hopefully this will make it easier to find exactly where we disagree and what needs more clarification.

@rb 2. I'm following the lesswrong post's symbols, where "p(o|i¬e)" means probability of overweight given internet and not exercise. This is the same as your spreadsheet's "P(O|not E & I)"
@rb 3. The probabilities to define this model are:
p(o)
p(i)
p(e|oi)
p(e|o¬i)
p(e|¬oi)
p(e|¬o¬i)
with the complementary probabilities:
p(¬o)
p(¬i)
p(¬e|oi)
p(¬e|o¬i)
p(¬e|¬oi)
p(¬e|¬o¬i)
@rb 4. My example assumes the following true probabilities:
p(o)=0.21
p(i)=0.14
p(e|oi)=0.09
p(e|o¬i)=0.21
p(e|¬oi)=0.38
p(e|¬o¬i)=0.46
with the complementary probabilities:
p(¬o)=0.79
p(¬i)=0.86
p(¬e|oi)=0.91
p(¬e|o¬i)=0.79
p(¬e|¬oi)=0.62
p(¬e|¬o¬i)=0.54
@rb 5. With those probabilities, overweight makes exercise less likely:
p(e|oi)<p(e|¬oi) 0.09<0.38
p(e|o¬i)<p(e|¬o¬i) 0.21<0.46
and internet makes exercise less likely:
p(e|oi)<p(e|o¬i) 0.09<0.21
p(e|¬oi)<p(e|¬o¬i) 0.38<0.46
@rb see a comment in the original thread, https://manifold.markets/ms/did-i-just-spot-a-mistake-in-yudkow#oeyF7QtF0vSAJcblR6Xg. Your probabilities are not consistent with the causal graph. There's a difference between "makes" in terms of conditional probabilities and "causes" in terms of causal reasons- what causes what (e.g., in the real world). Conditional independence means P(A|B) = P(A|BC), not P(A|B & not C) = P(A|BC)
@rb if you're sure you understood the post correctly, even with an IMO medalist saying I'm correct here, feel free to put more mana into the market
@rb ms please explain specifically how the probabilities are not consistent with the causal graph [for example, p(o)=0.21 is wrong, p(o) must be = 0.1]. What would be a set of valid probabilities?
@rb one of the things is that p(o|¬e) should not be equal to p(o|¬ei). From the post: "This may seem a bit clearer by considering the scenario B->A<-E, where burglars and earthquakes both cause alarms. If we're told the value of the bottom node, that there was an alarm, the probability of there being a burglar is not independent of whether we're told there was an earthquake - the two top nodes are not conditionally independent once we condition on the bottom node". With your probabilities, the two top nodes (variables O and I) are conditionally independent, once you condition on the bottom node (variable E).
@ms Thanks for giving a specific example. Notice replies 3-4 by themselves do not specify p(o|¬e) and do not specify p(o|¬ei). This is because they give the assumed true probabilities that underly reality for the model where overweight and internet cause exercise. It would make sense to define p(o|¬e) for a model where exercise causes overweight, or define p(o|¬ei) for a model where exercise and internet cause overweight, but those aren't the models being used. The model defined in replies 1-4 can generate simulated observed data, and the fraction of non-exercisers who are overweight can be observed. And in fact, for the model defined in replies 1-4 the top two nodes (overweight and internet) are not conditionally independent once we condition on the bottom node (exercise). Do you still disagree with anything in replies 1-5 or do you want me to continue with later details?
@rb Sorry, not sure I want to spend much more time on explaining this. Your examples don’t represent probabilities that we’d observe with the causal graph in question. Please read the post, without skipping anything.
@ms Please give a specific example of how you would implement the O->E<-I model then. I think you'll find some interesting things. As I said above, if I'm wrong it should be easy to point out specifically where I made a mistake. Vague statements to "read the post", which I of course have done, are disappointing. Obviously if my example has no mistakes it makes sense that you wouldn't be able to point out anything specific, but I don't understand why someone who sincerely believes my example wouldn't want to bring up the mistake (that appears in my example, not bring up things like p(o|¬e) which doesn't appear in in replies 1-5).
"Your examples don’t represent probabilities that we’d observe with the causal graph in question."
This is surprising to me. Do you believe that
from the lesswrong post are mistaken? I'm doing the same thing, except with the O->E<-I model.
@rb Sorry, I don’t think this is a good use of my time. If you think you’re right, feel free to bet mana
@ms I'm picking back up after step number 5. The purpose is to find my specific error(s), so if you don't disagree with anything in a given post you don't need to respond, just wait until later when the actual mistake appears.
@rb 6. The probabilities for every combination of exercise/overweight/internet are:
p(eoi) = p(o)*p(i)*p(e|oi)
p(eo¬i) = p(o)*p(¬i)*p(e|o¬i)
p(¬eoi) = p(o)*p(i)*p(¬e|oi)
p(¬eo¬i) = p(o)*p(¬i)*p(¬e|o¬i)
p(e¬oi) = p(¬o)*p(i)*p(e|¬oi)
p(e¬o¬i) = p(¬o)*p(¬i)*p(e|¬o¬i)
p(¬e¬oi) = p(¬o)*p(i)*p(¬e|¬oi)
p(¬e¬o¬i) = p(¬o)*p(¬i)*p(¬e|¬o¬i)
@rb 7. The calculated probabilities for every combination of exercise/overweight/internet are:
p(eoi) = 0.21*0.14*0.09 = 0.002646
p(eo¬i) = 0.21*0.86*0.21 = 0.037926
p(¬eoi) = 0.21*0.14*0.91 = 0.026754
p(¬eo¬i) = 0.21*0.86*0.79 = 0.142674
p(e¬oi) = 0.79*0.14*0.38 = 0.042028
p(e¬o¬i) = 0.79*0.86*0.46 = 0.312524
p(¬e¬oi) = 0.79*0.14*0.62 = 0.068572
p(¬e¬o¬i) = 0.79*0.86*0.54 = 0.366876
@rb 8. Some formulas relevant for what we want to calculate:
p(¬eo) = p(¬eoi) + p(¬eo¬i)
p(¬e) = p(¬eoi) + p(¬eo¬i) + p(¬e¬oi) + p(¬e¬o¬i)
p(o|¬e) = p(¬eo) / p(¬e)
p(¬ei) = p(¬eoi) + p(¬e¬oi)
p(o|¬ei) = p(¬eoi) / p(¬ei)
@rb 9. Rounded resulting values:
p(¬eo) = 0.026754 + 0.142674 = 0.169428
p(¬e) = 0.026754 + 0.142674 + 0.068572 + 0.366876 = 0.604876
p(o|¬e) = 0.169428 / 0.604876 = 0.28010369
p(¬ei) = 0.026754 + 0.068572 = 0.095326
p(o|¬ei) = 0.026754 / 0.095326 = 0.28065795
p(o|¬ei) is approximately equal to p(o|¬e)
@rb I am sorry, I wish I could help you, but would like to avoid spending a lot of time this way. If you read my previous comments, you should find the explanation. (Focus on conditional dependence/independence of two nodes on their own or conditioned by the third.) Alternatively, you can try to define random variables: two with some probability of being one way or another, the third is eg the sum of some coefficients multiplying the first two plus some random noice coefficient, and if the value is below some number, the third variable is one way, if it’s above, then another. Then, look for the probabilities.
@ms Thanks for explaining your model. I'm going to interpret comment as saying replies 3-4 are invalid and the linear equation with noise you give is a correct model. Let's use that model then.
Assume p(o)=0.21 and p(i)=0.14
Assume exercise is true if -0.706*o -0.205*i -0.329*o*i + normal(mean=-0.1, stdev=1) > 0
What is the "-0.329" overweight*internet interaction term? Perhaps there is a subreddit for overweight people where they encourage each other not to exercise. Or it could be anything really, the lesswrong post explains lack of exercise causing overweight as "due to divine punishment for the sin of sloth", so it isn't really trying to be plausible.
With these numbers, the resulting (rounded) probabilities are:
p(e|oi)=0.09
p(e|o¬i)=0.21
p(e|¬oi)=0.38
p(e|¬o¬i)=0.46
These are the same as in my reply 4. So even using your exercise model, we get the same result: p(o|¬ei) is approximately equal to p(o|¬e)