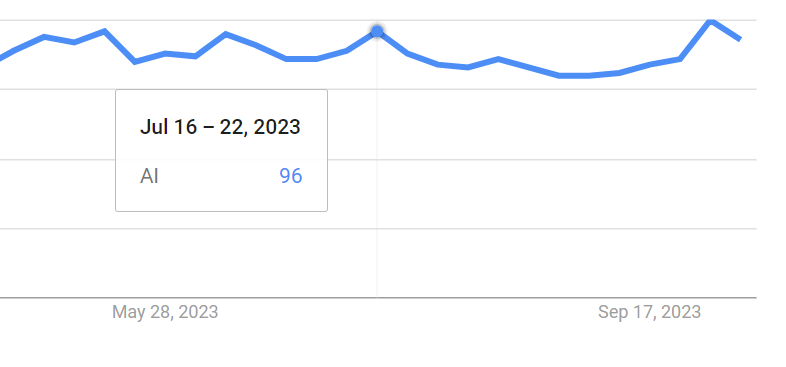
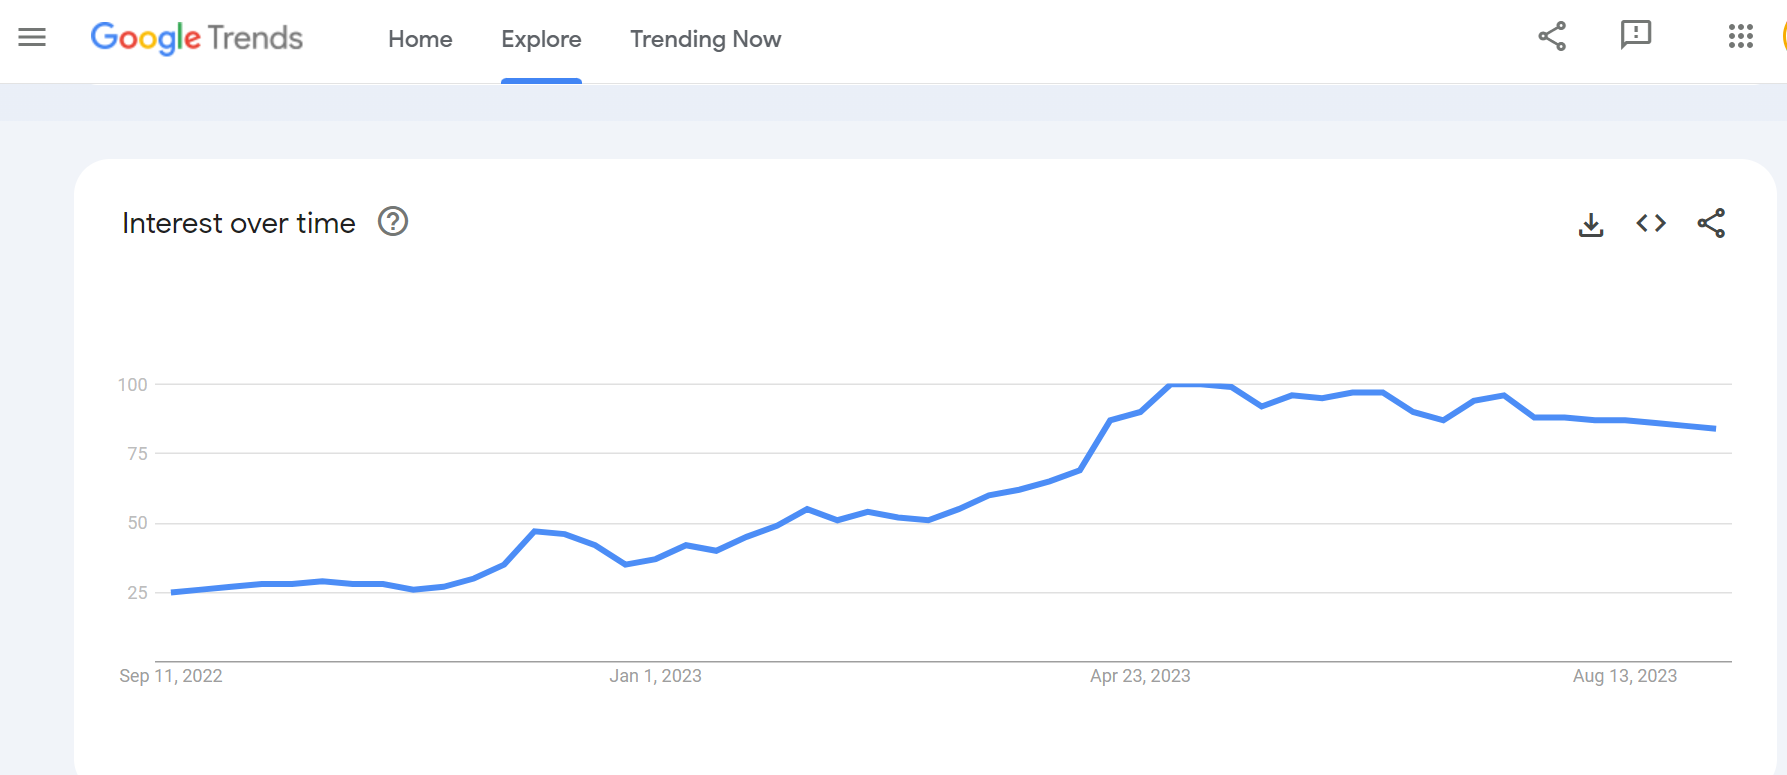
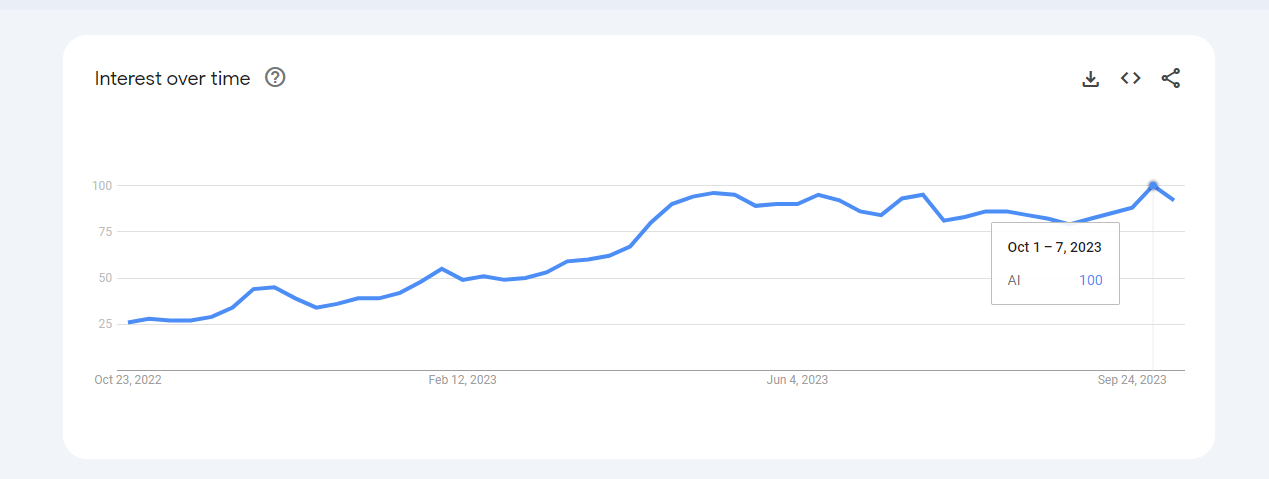
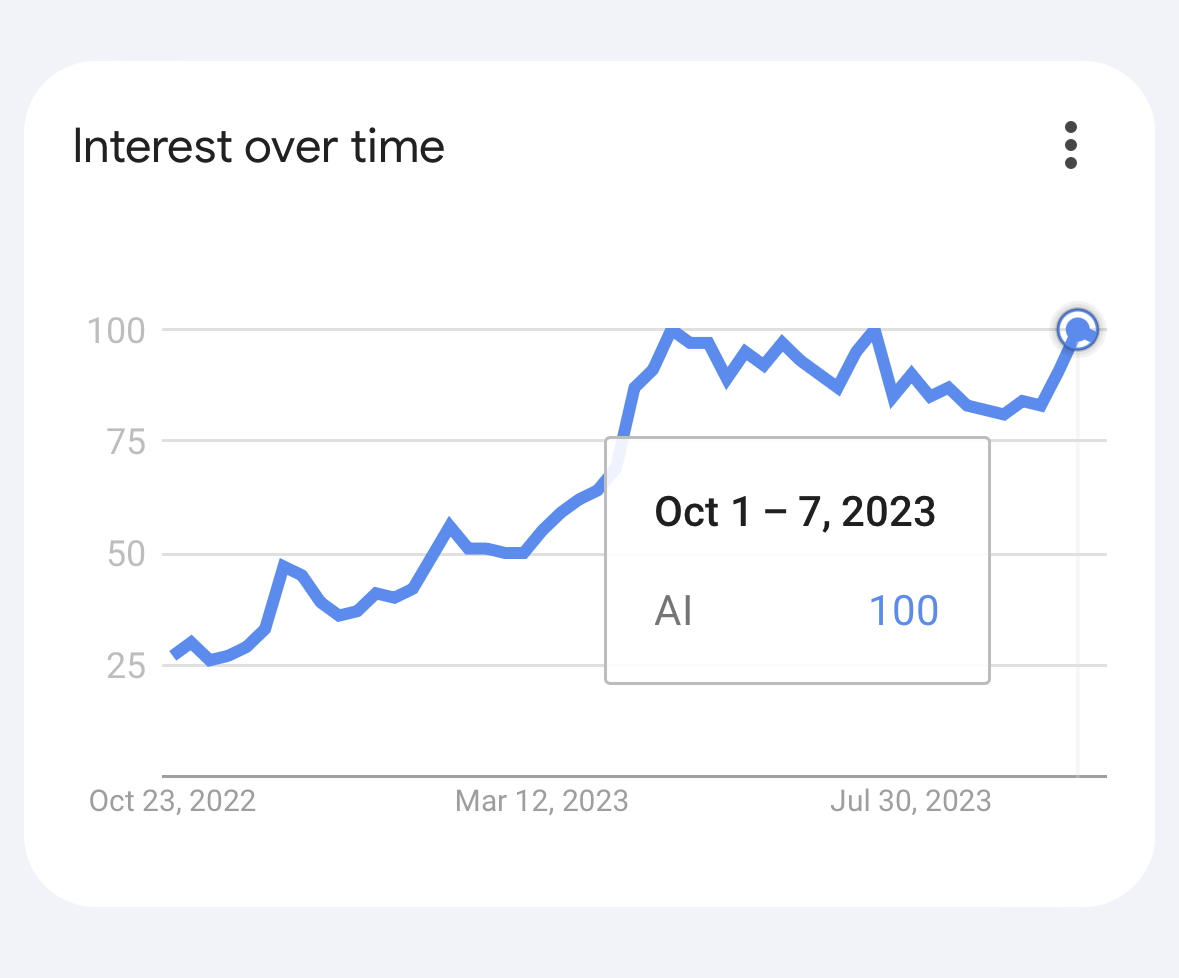
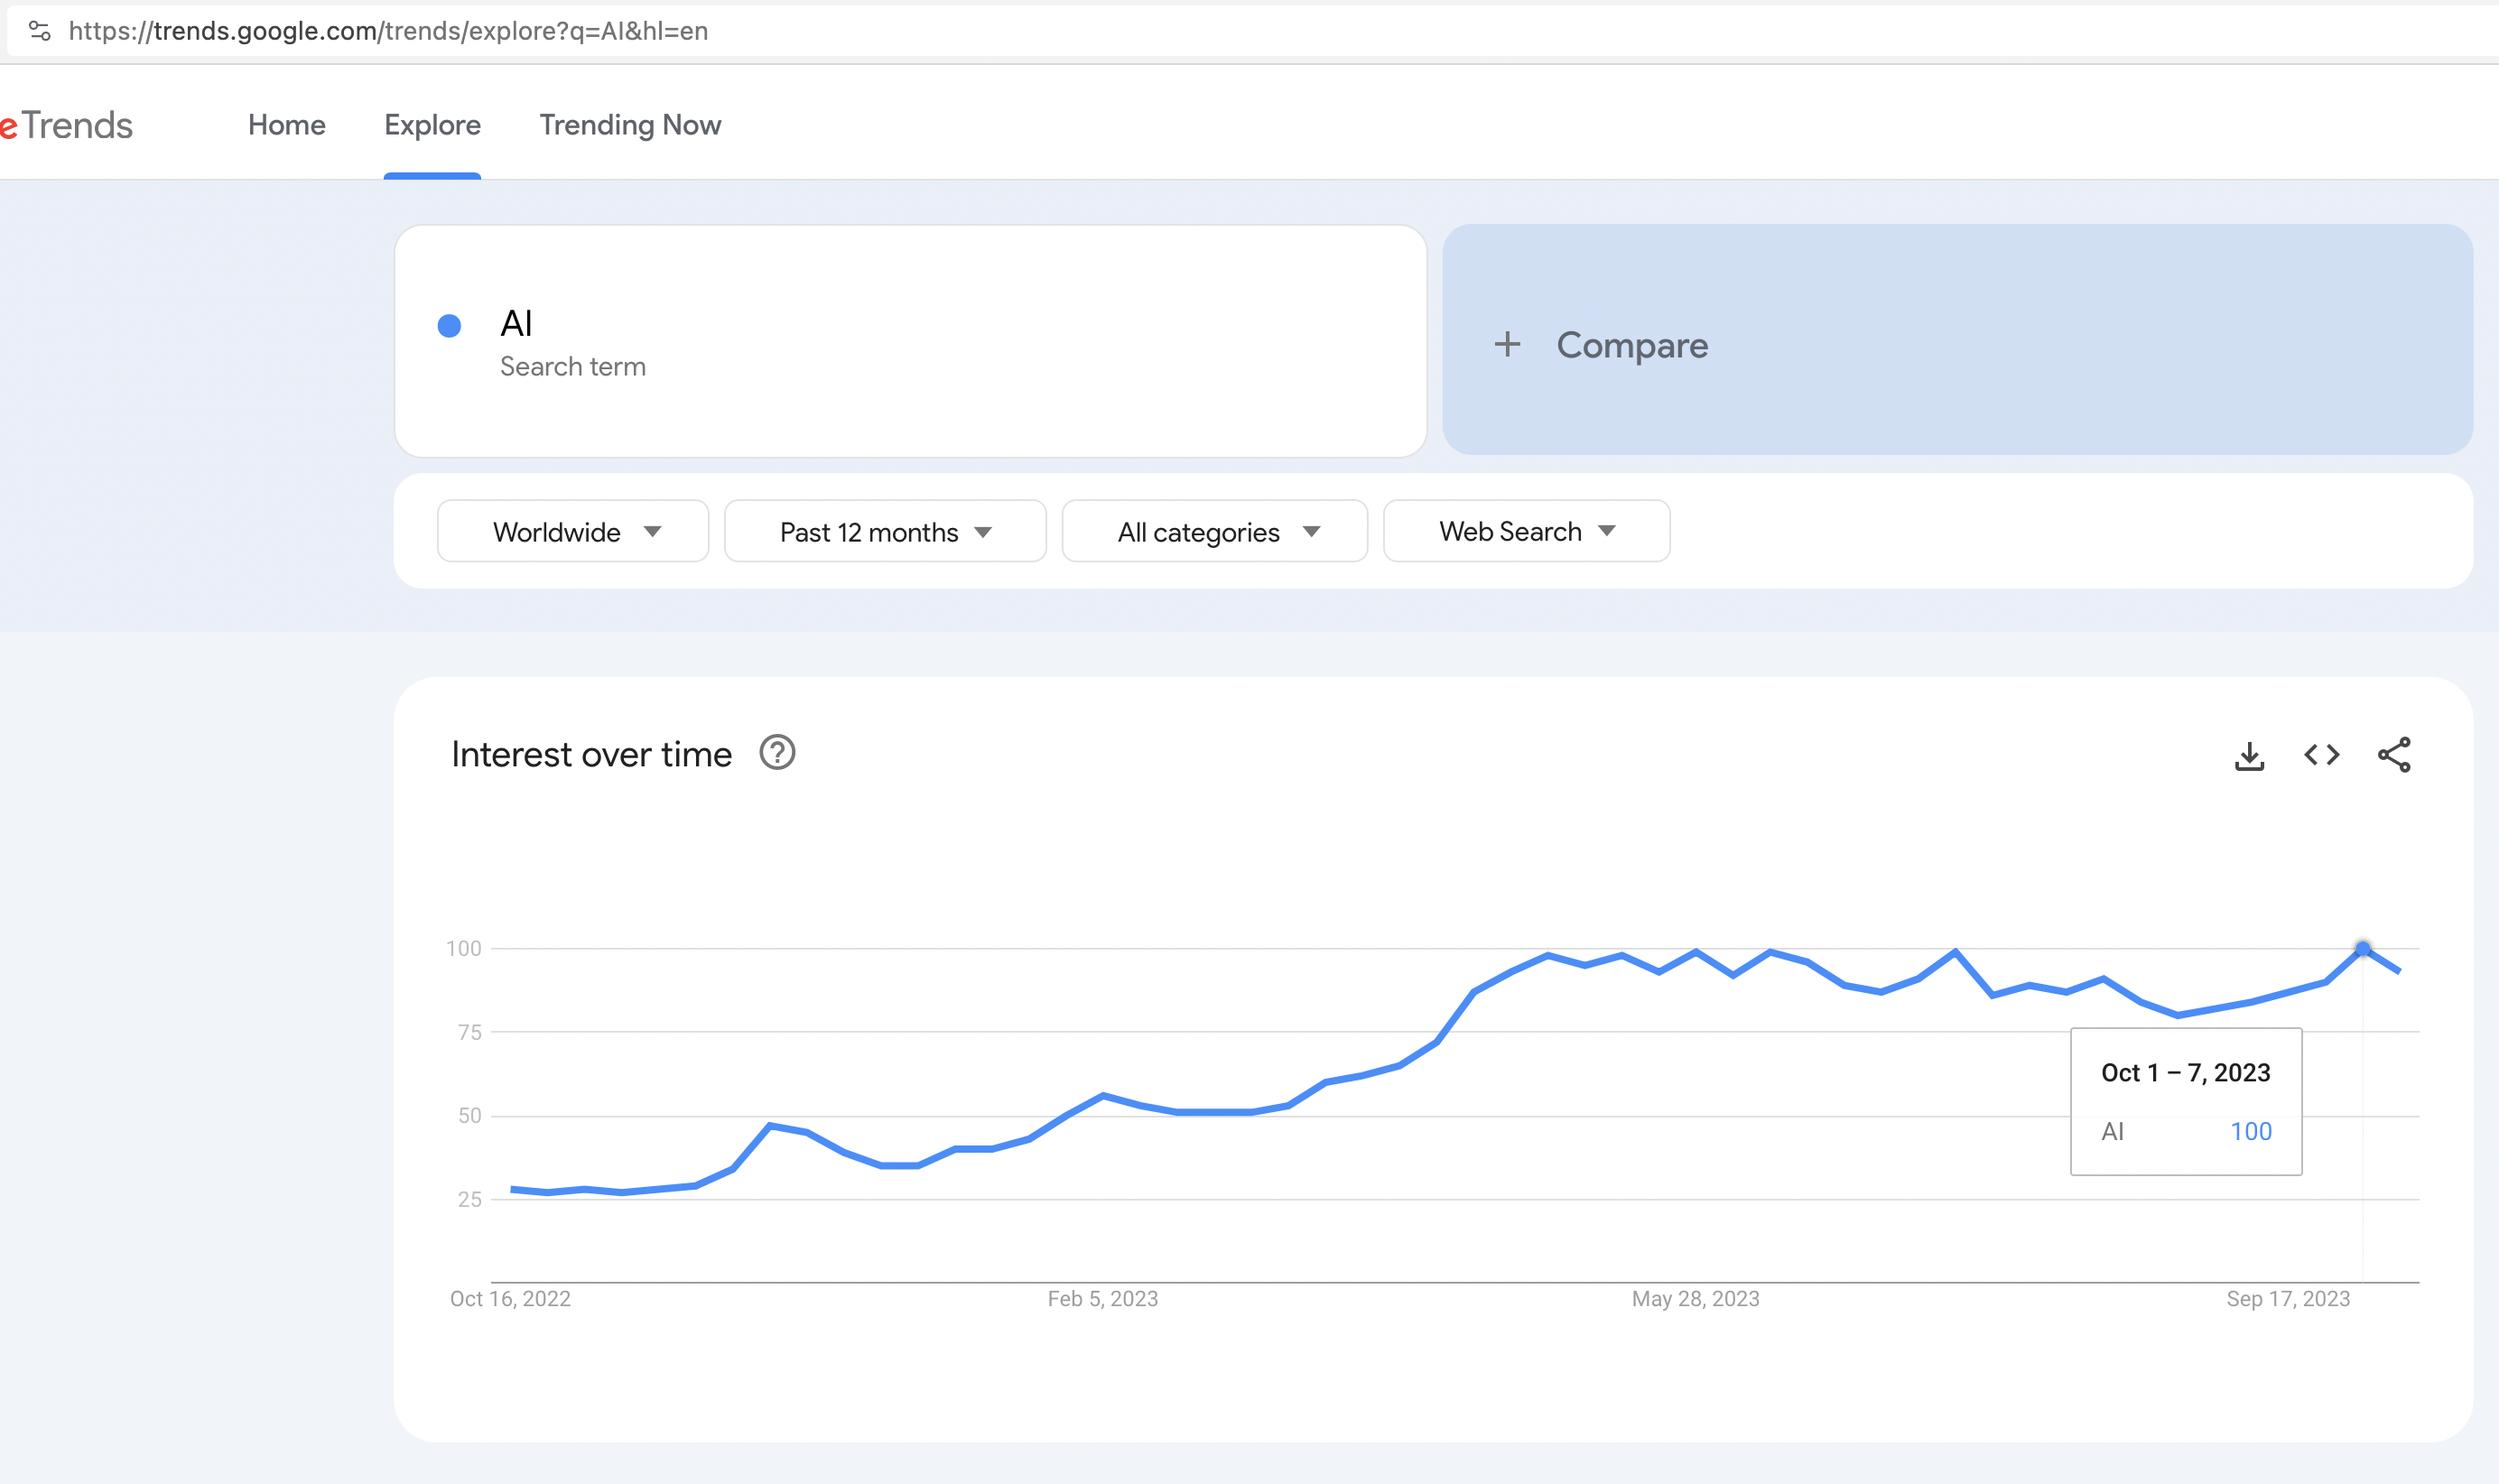
This question will resolve YES, if global search rank for "AI" in Google Trends hits relative value 100, after creation of this market and before Dec 31 2023.
Which means: if "AI" will be at its all-time-high again?
https://trends.google.com/trends/explore?q=AI&hl=en

 1,000
1,000🏅 Top traders
| # | Trader | Total profit |
|---|---|---|
| 1 | Ṁ254 | |
| 2 | Ṁ220 | |
| 3 | Ṁ141 | |
| 4 | Ṁ128 | |
| 5 | Ṁ116 |
People are also trading
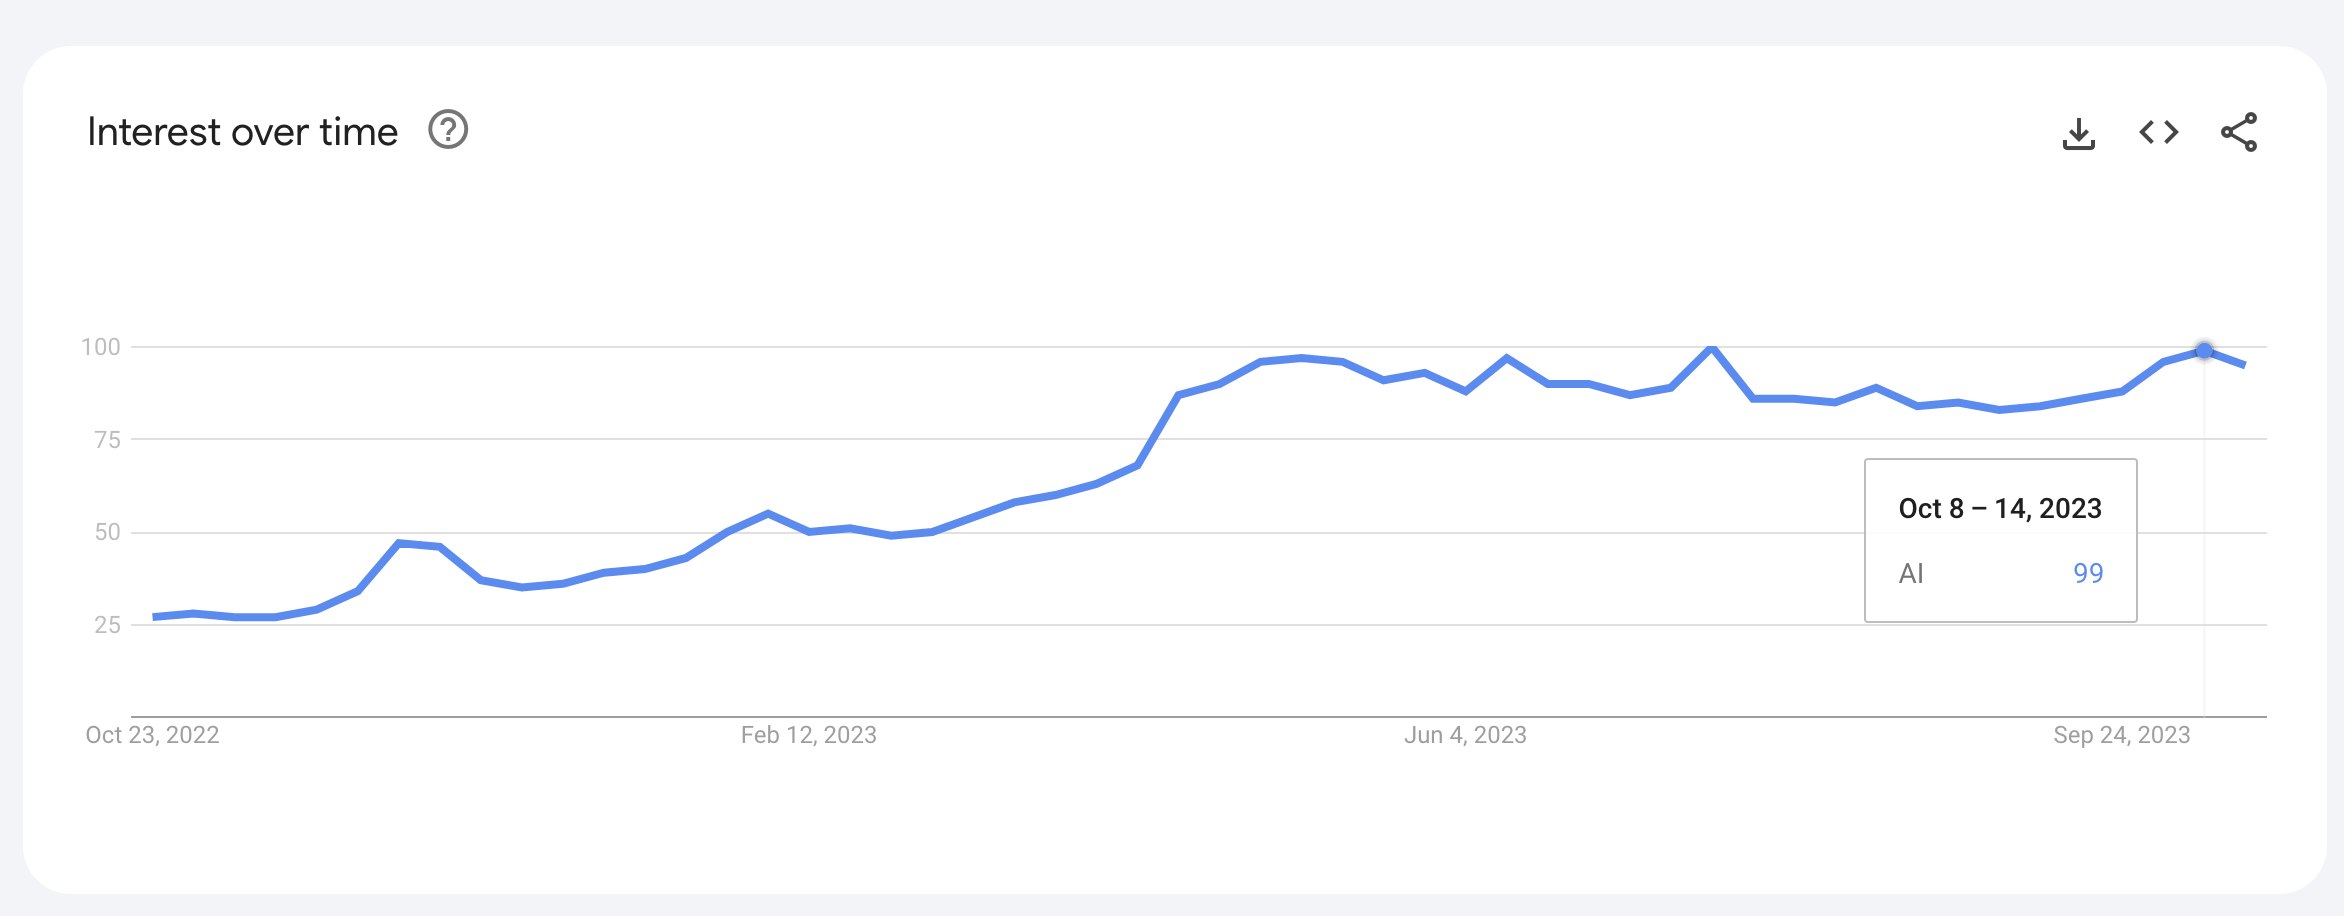
@itsTomekK This is now entirely disambiguated, where the new peak is far higher than the April one. Can resolve YES. :)

If you like google trends, here's more:
https://manifold.markets/benshindel/which-things-will-be-trendy-this-sp?r=YmVuc2hpbmRlbA
@itsTomekK I see 2 sensible options: either resolve to YES because it's clearly at 100 most of the time, so by any reasonable definition it did peak. As I wrote before, it's better than a tie. Another is for you to look at the plot 20+ times over time and resolve to % of the time it's at 100.
Discounting Oct 1-7 because it turns out the graph fluctuates is not a sensible option in my opinion. It would effectively mean you require a peak with a considerable advantage over previous ones, which is not what people were betting on.
@na_pewno Resolving to % right now doesn't sound right, should definitely wait until EOY unless resolving 100% YES.
@HenriThunberg The peak has been achieved so I think it shouldn't wait. At least not in a way that leaves a possibility for NO.
@na_pewno What if it starts showing 99% for more users? (As it currently does for me) Maybe at EOY nobody sees 100% at Oct 8-14, then it will come off more as a temporary data error IMO.
I think some interpretation of the question would still leave room for a YES resolution even on faulty/incomplete data, and wouldn't vividly oppose it, but I think it would be less correct.
@HenriThunberg I thought people just check at different times, but it actually shows different things to different people. I'm pretty sure it's not a data error. This answer on stackoverflow says the data is sampled nondeterministically.

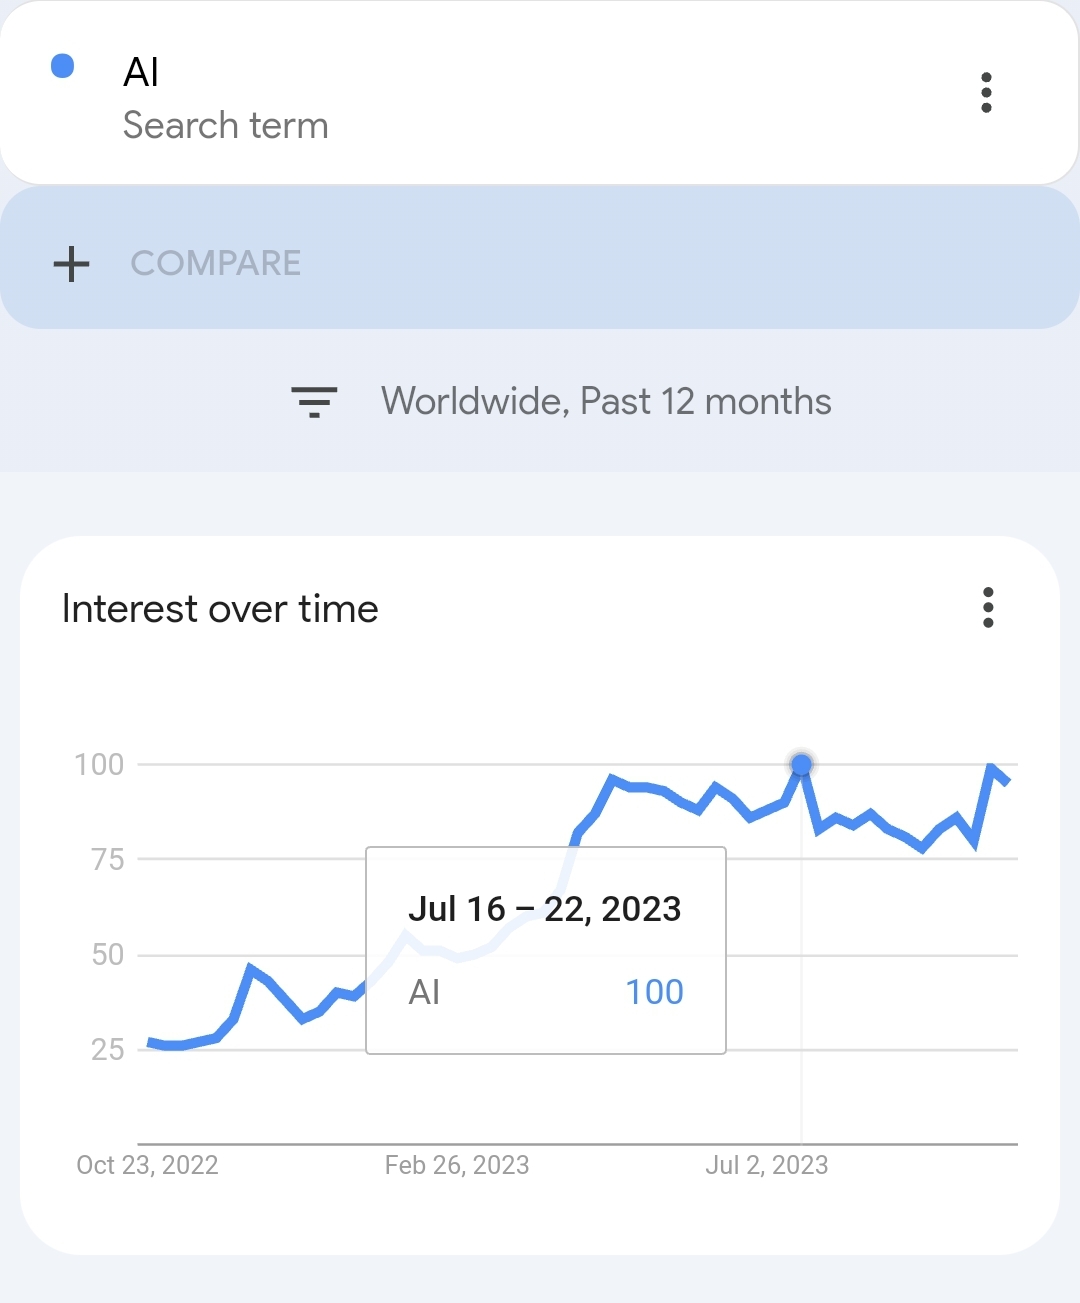
that's not how it looks for me. I honestly think the most fair thing is that this market be resolved N/A. It doesn't make sense that data points in the past can change relative to one another. We made these comments minutes apart; If two people looking at the same time can't agree as to what the graph says then the market cannot be resolved reliably. ever. it doesn't matter if we wait another two months. the graph could change at any point.
@DylanSlagh Even as somebody who has a net loss on this market, I respectfully disagree. I think it's likely that it will stabilize at some point even if it's surprising it hasn't already done that. Resolving N/A at this point sounds rash to me.
@HenriThunberg just for future reference, are you following the link in the description or looking it up from the trends home page? I just can't see how it could be resolved any way other than YES or N/A. When I bet how could I know that a past data point could change relative to another? I expected the market to resolve any second. Its similarly unfair to any NO betters who look and see a data point in the past and expect it to stay at 99 and not fluctuate to 100
@DylanSlagh I use the market link. Both mobilr and desktop show 100 in July.
As the market description stands, I think it's fair to resolve YES based on earlier screenshots. I.e. even a temporary hit at 100 being enough for a YES resolution, even if it then switches back.
That said, with the current uncertainty in resolution decision, I thought it worth to pick up some very cheap NO.
@HenriThunberg can you confirm that it doesn't also show 100 Oct 1-7? If both are 100 seems like it should count given res criteria
@EliLifland Yup, confirming that I've never seen Google Trends do 100 in more than one place. Mobile/desktop same thing.
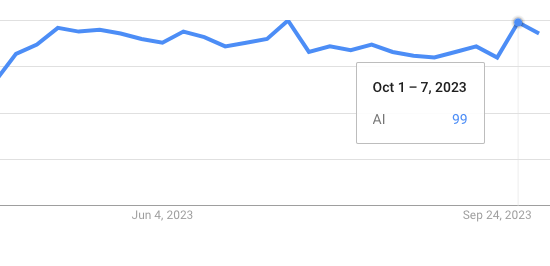
@HenriThunberg I’ve seen it do 100 in more than one place several times in the past few days.
@DylanSlagh No idea how to make sense of showing different numbers to different people lol (I also see 100 in both places)


@EliLifland It's always higher than all previous peaks though, right? Shouldn't that be enough?
@EliLifland Strange. I've never seen it below 100 at least since the "It's not incomplete anymore 🎉" comment below. Could you make a screenshot like this one, with URL and everything? Maybe we're looking at different things?
@EliLifland The other peaks fluctuate (relatively to each other) too, I don't think it's going to stabilize. It's 100 almost every time I look though.
My argument for resolving YES now:
I believe it was at 100 when Oct 8+ started appearing,
it's the highest peak most of the time.
If you took the averages of the fluctuations for all the biggest peaks, I'm confident Oct 1-7 would be the highest.
It's kind of better than a tie, which would resolve YES.
@na_pewno e.g. now the second highest peak is at just 96. Oct 1-7 is the biggest peak, the chart just fluctuates quite a lot for some reason.