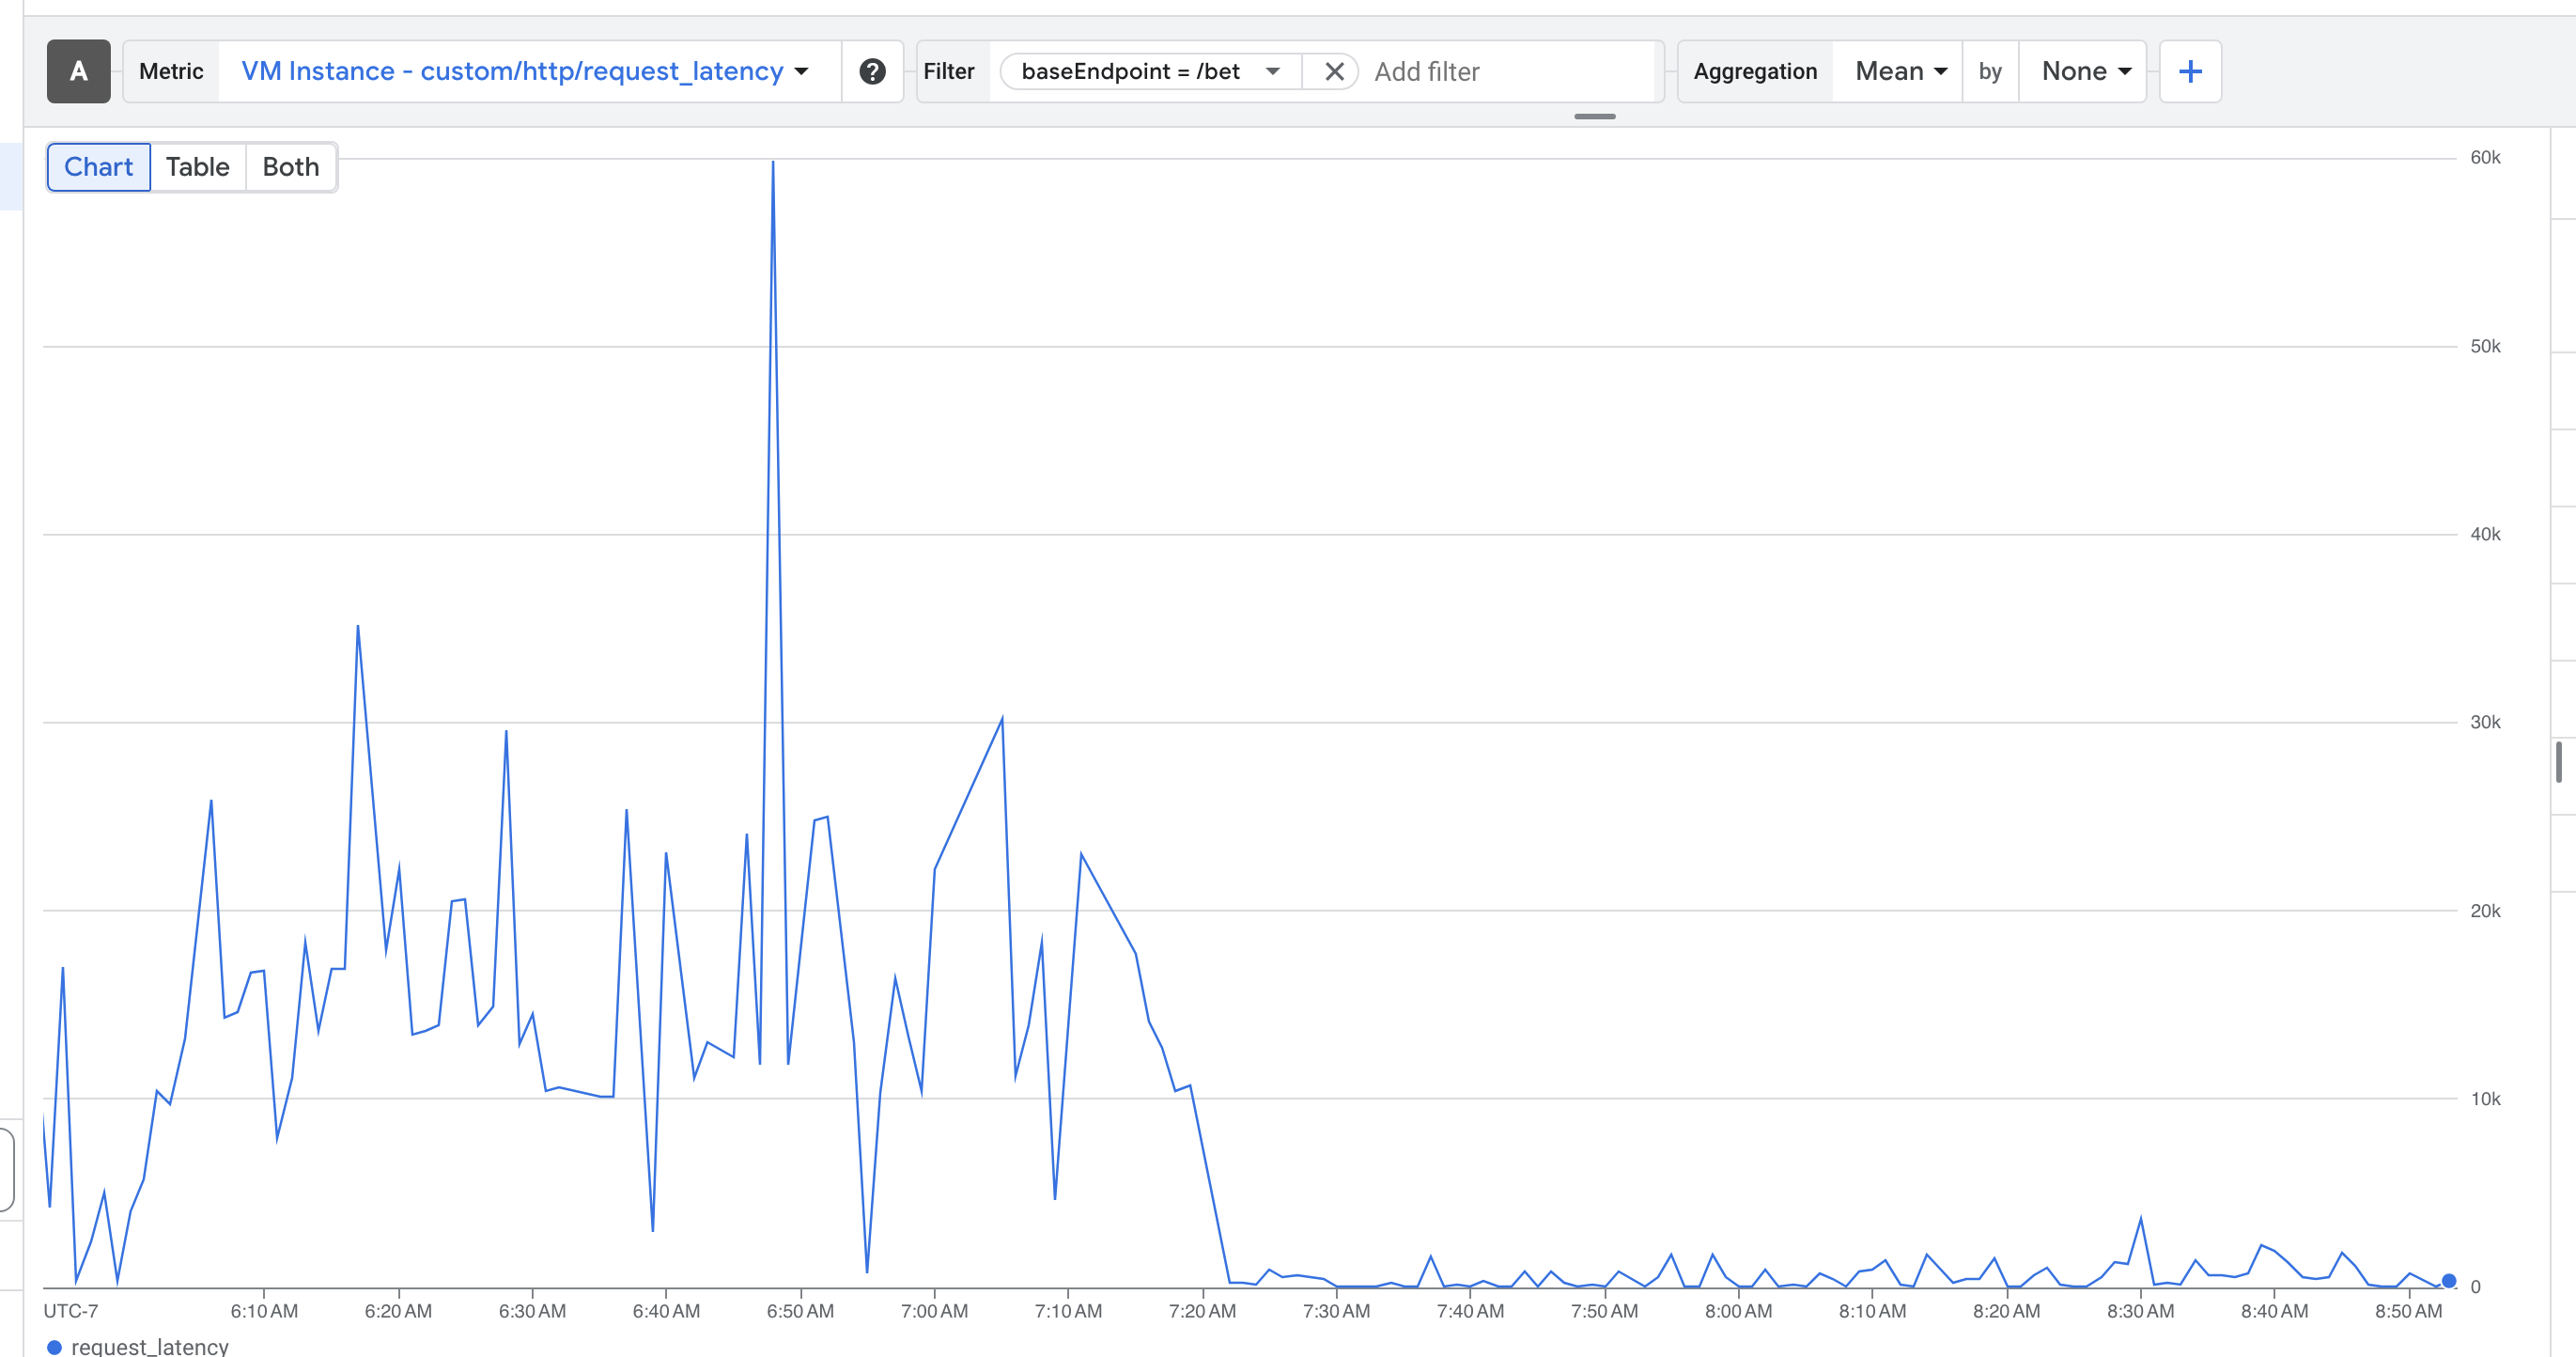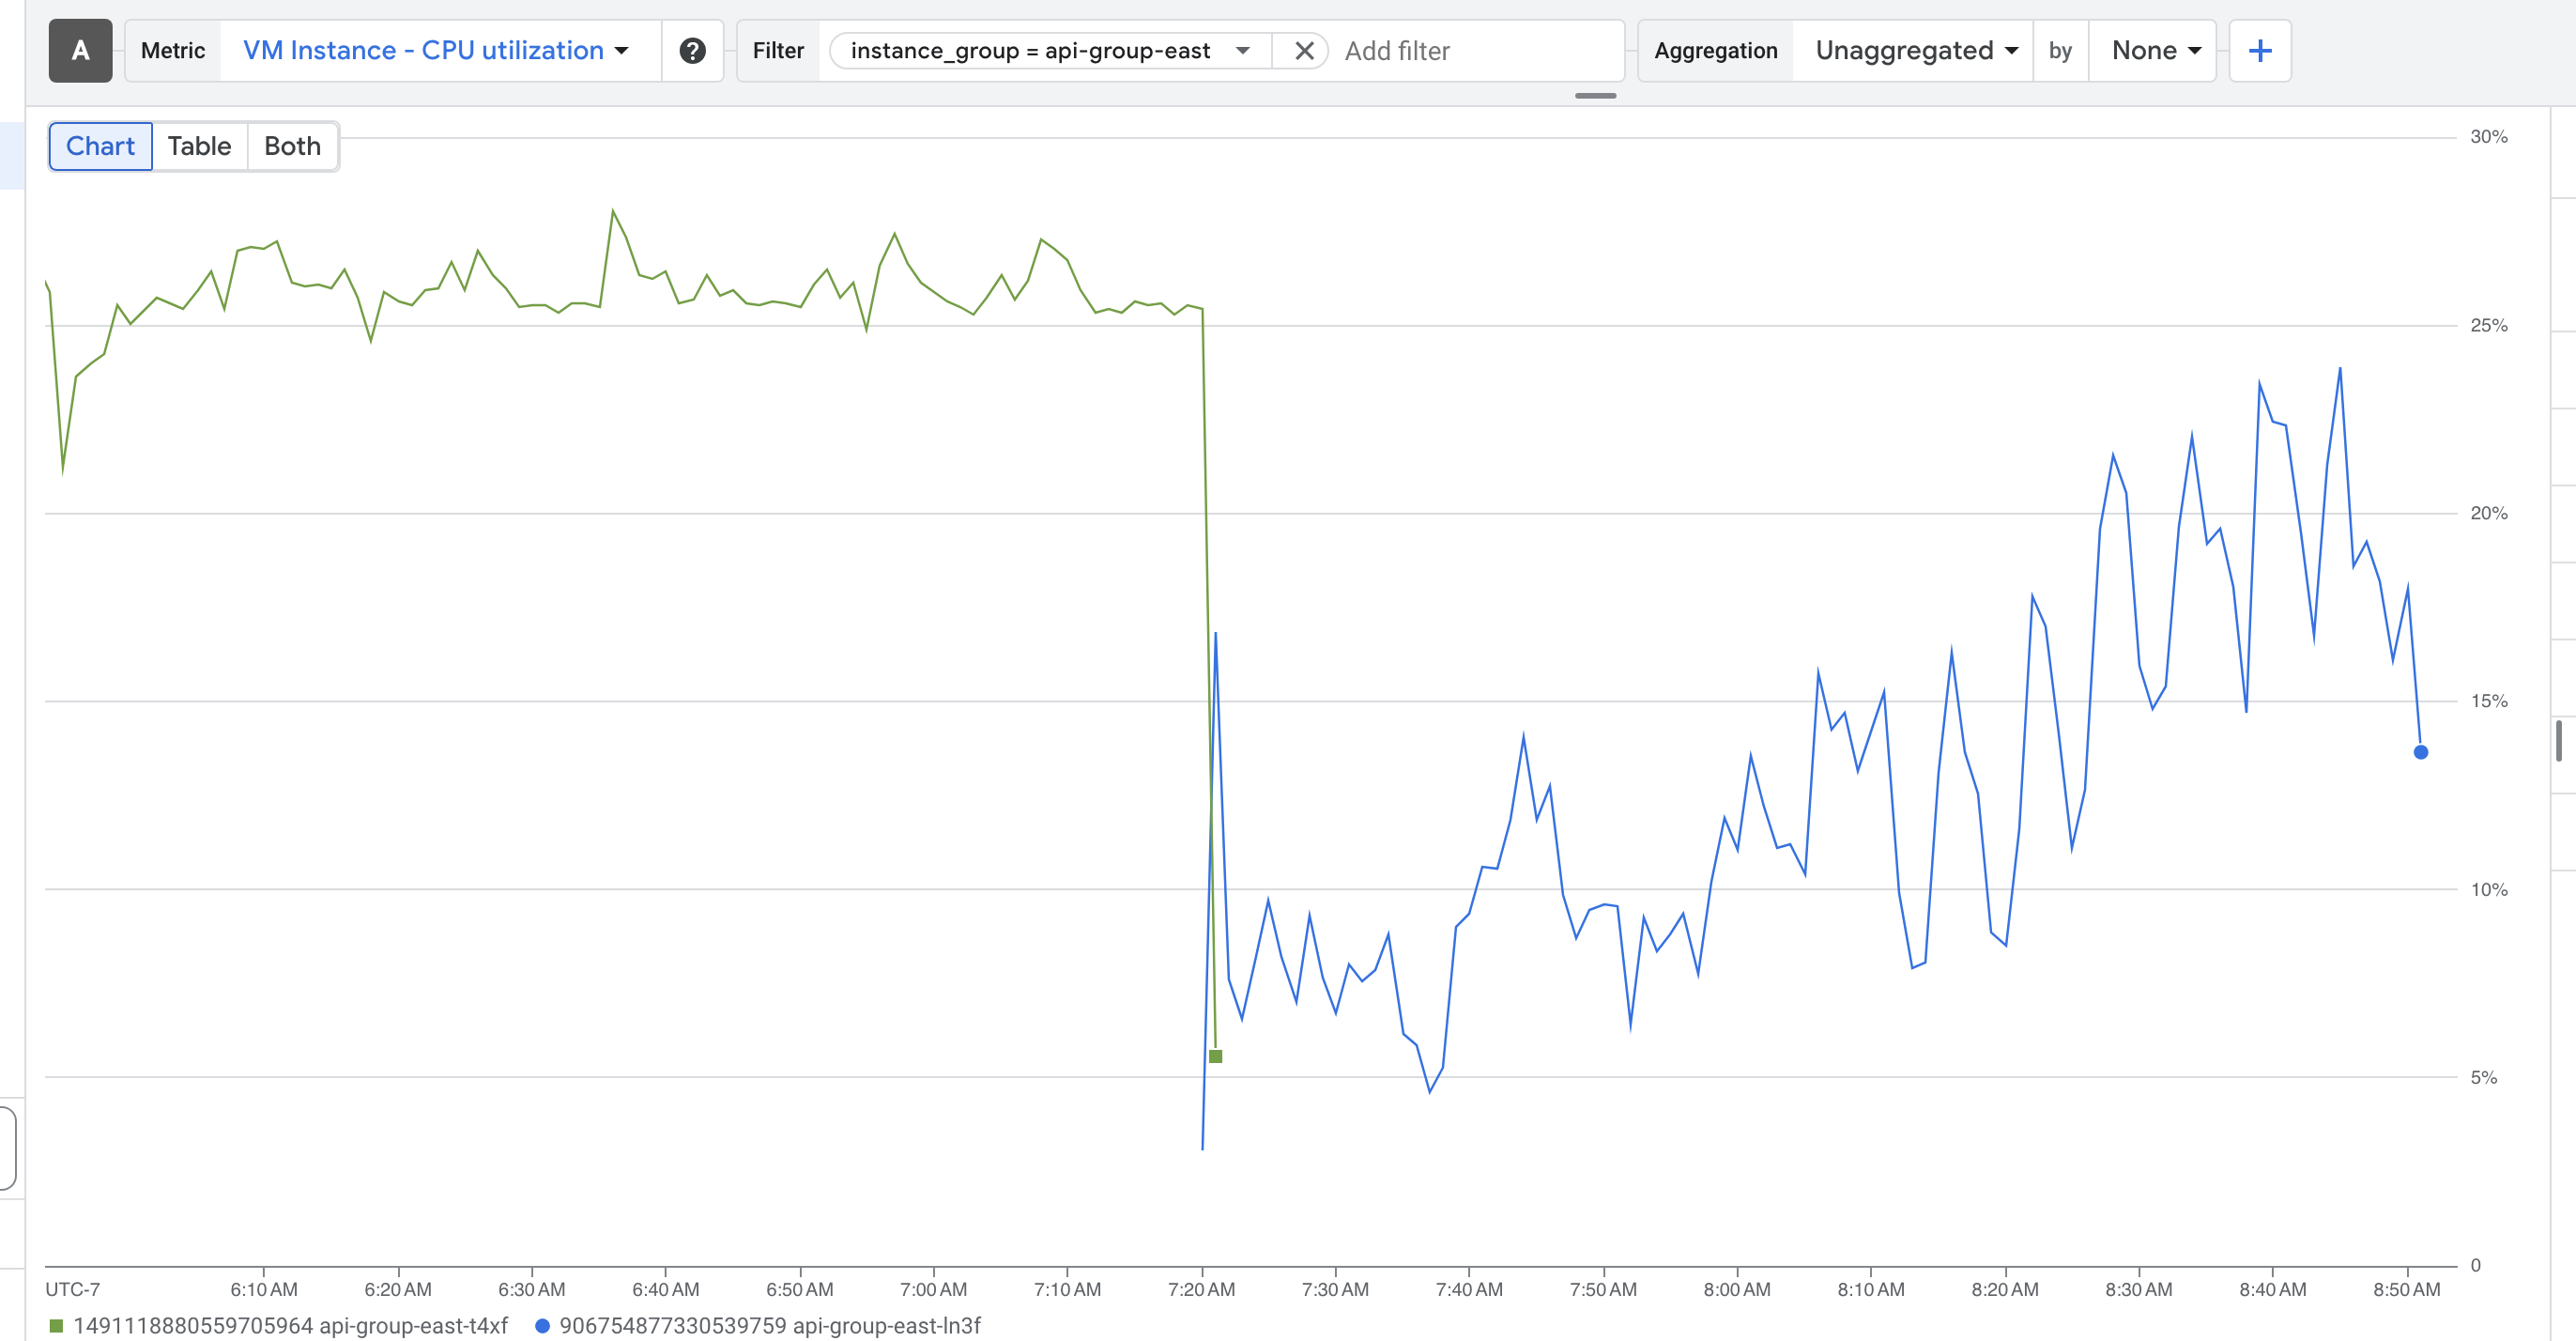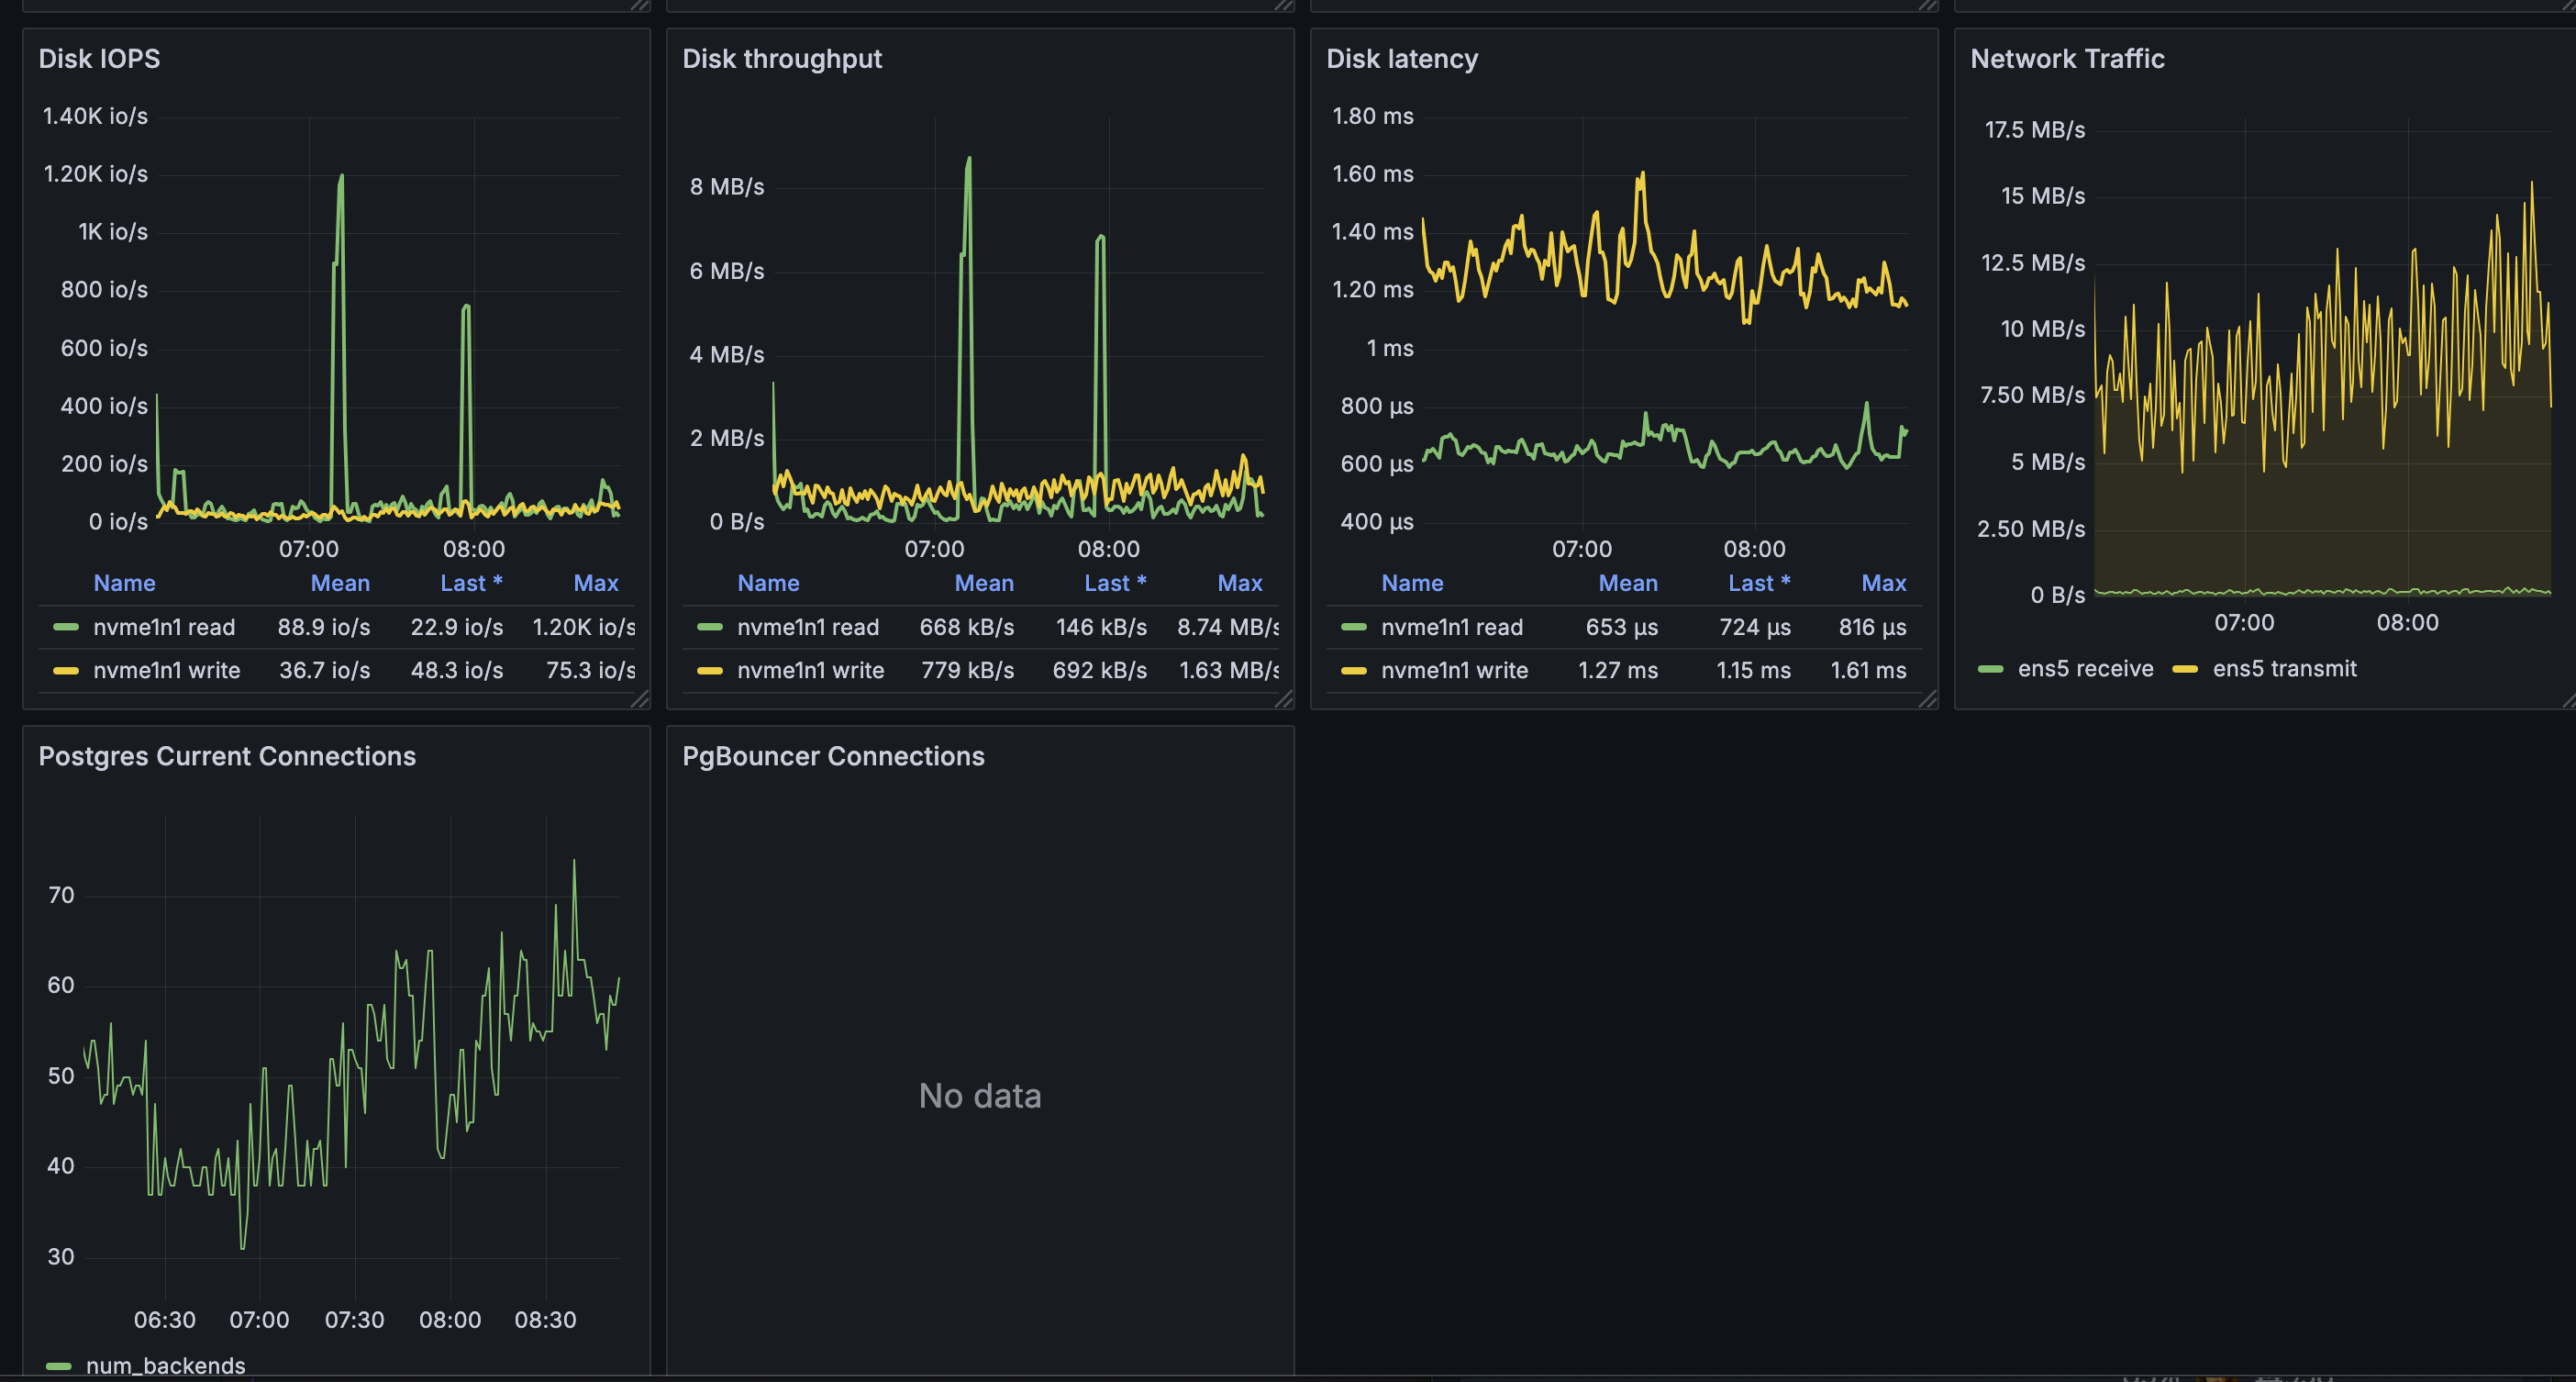
11am Monday (oct 14th) state of affairs:
Things started to deteriorate the night of oct 9th (PST)
api latency slowly builds, leading to site outages every few hours
redeploying the api fixes things for a time
Local host works fine during the outage
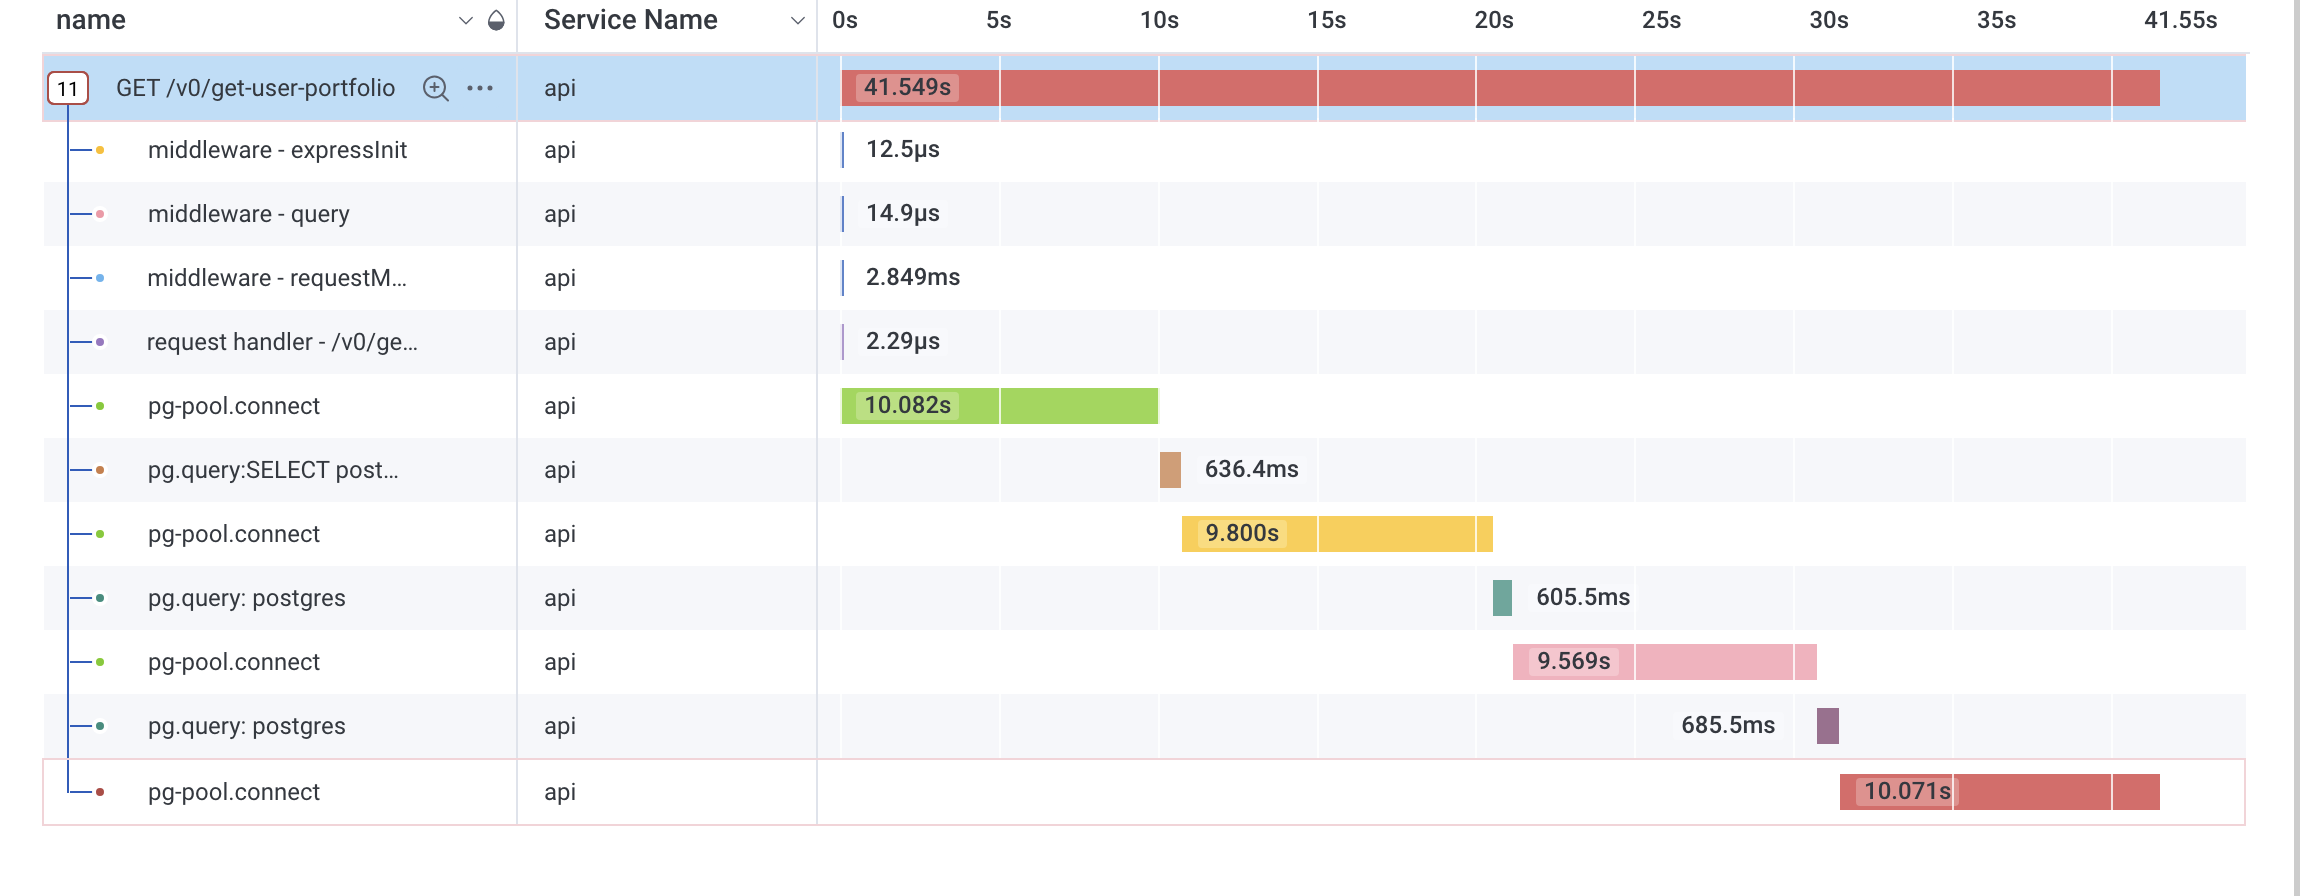
simple queries start to take forever, filling up the connection pool
So far we've :
Set up a read replica that the front end uses when querying directly from the db with the supabase js library
updated our backend pg promise version
checked open connections on api (1.3k), total ingress/egress bytes, total api query numbers, cpu usage (10%), memory usage (10%), all are normal.
Reverted suspicious-looking commits over the past few days
Increased, then decreased pg pool size
Moved some requests from api to the supabase js client that talked directly to the db's load balancer
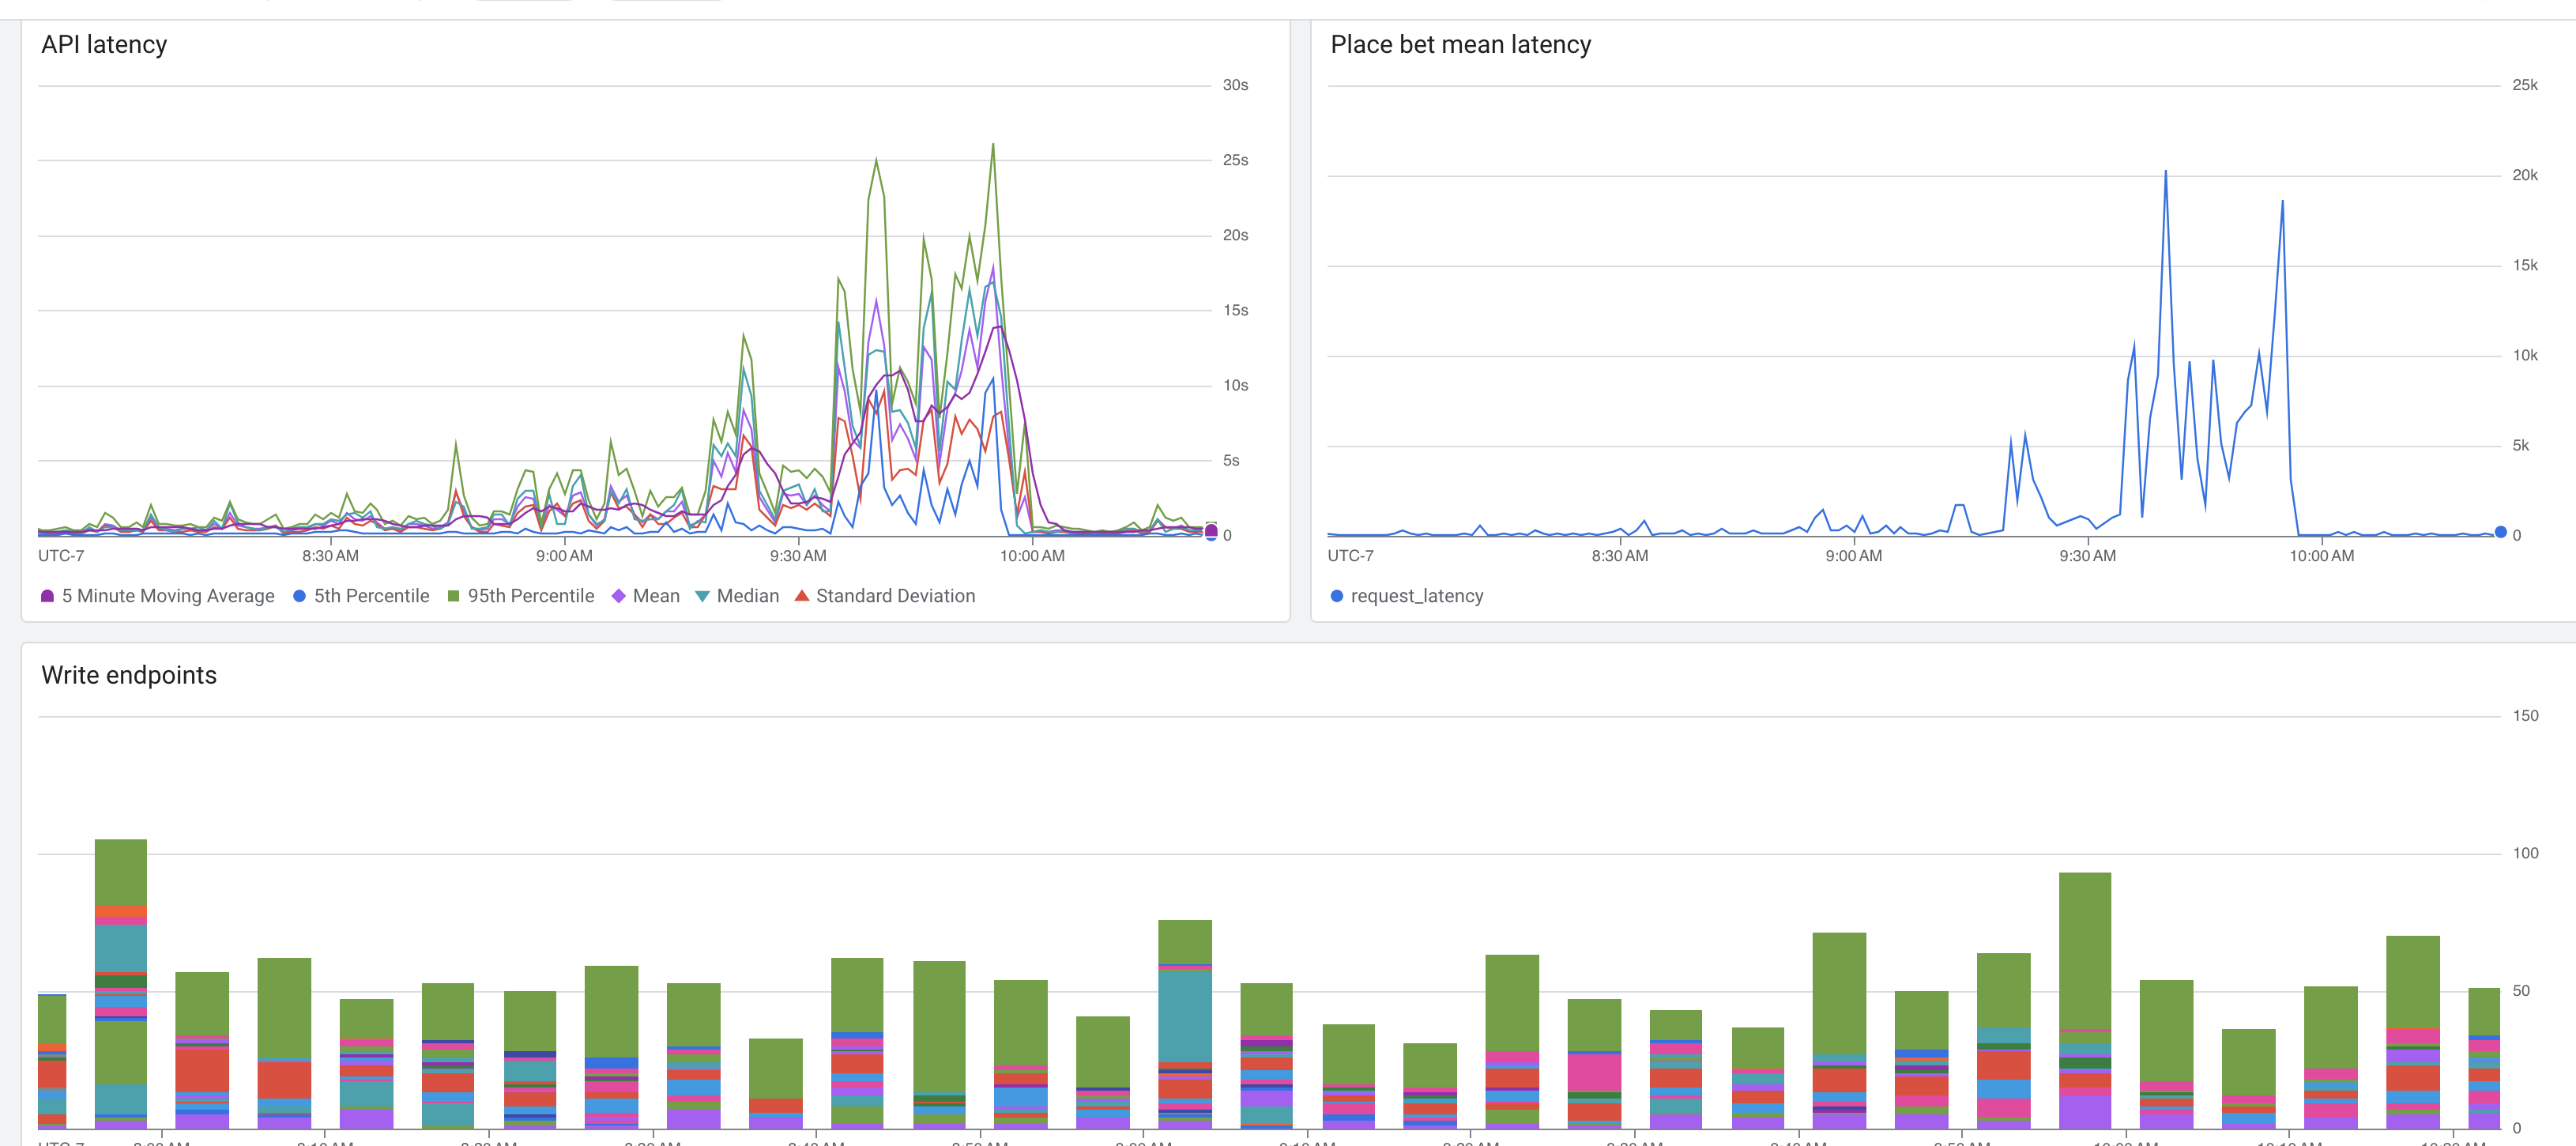
Typical API stats during an outage:
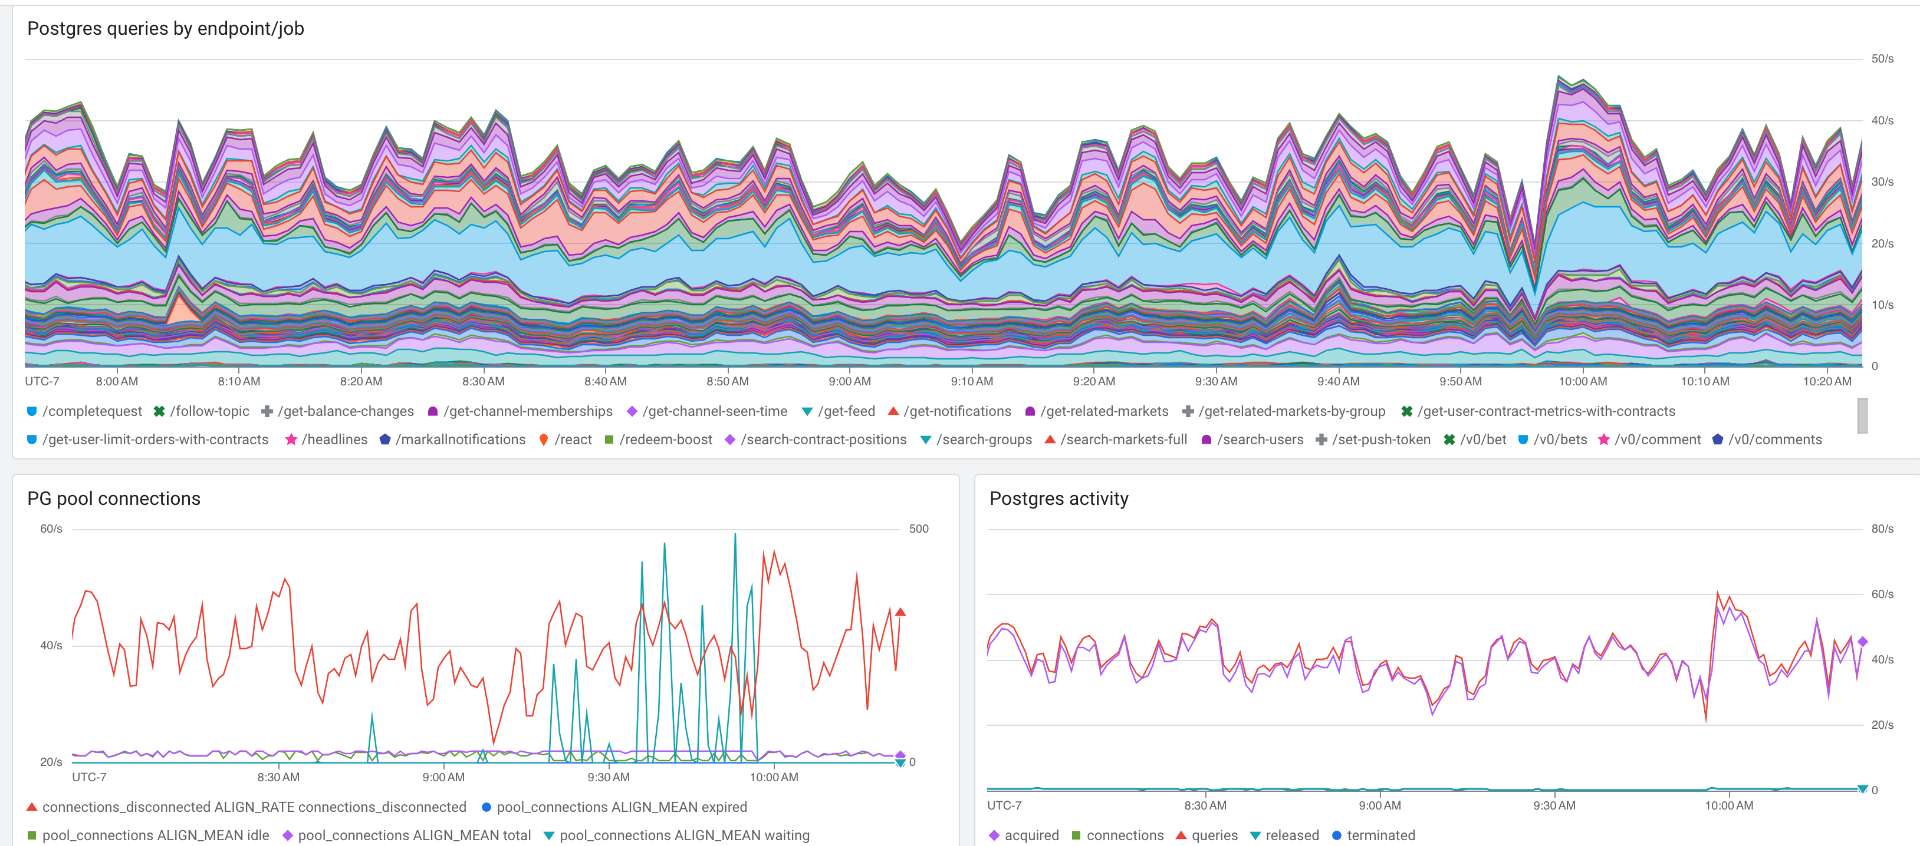

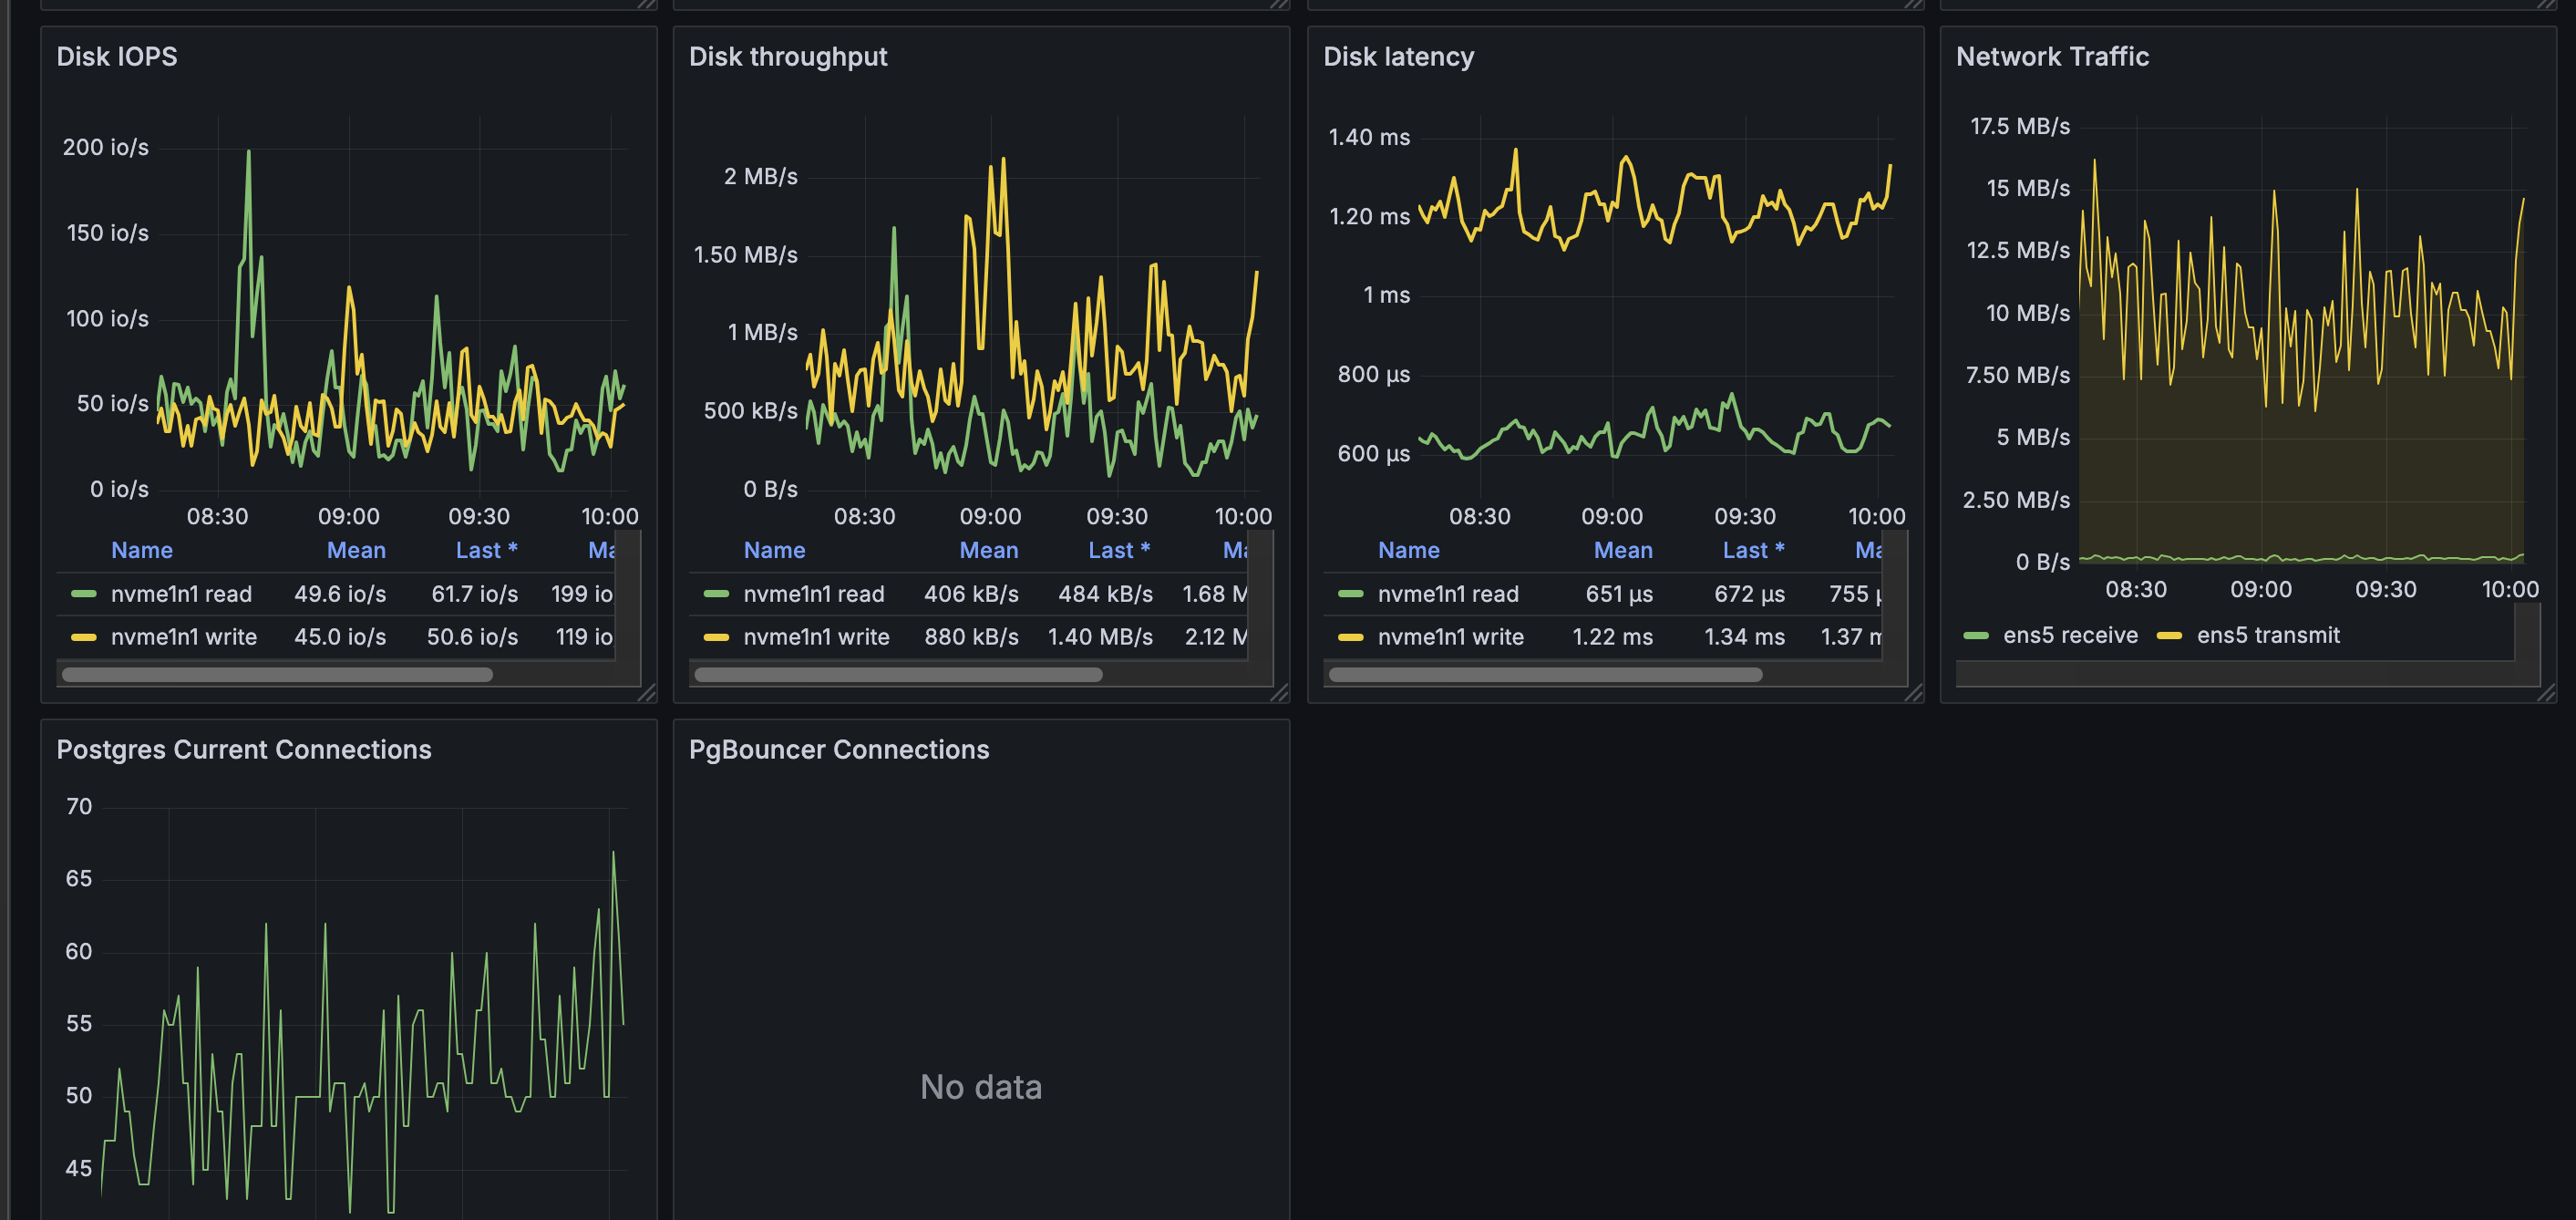
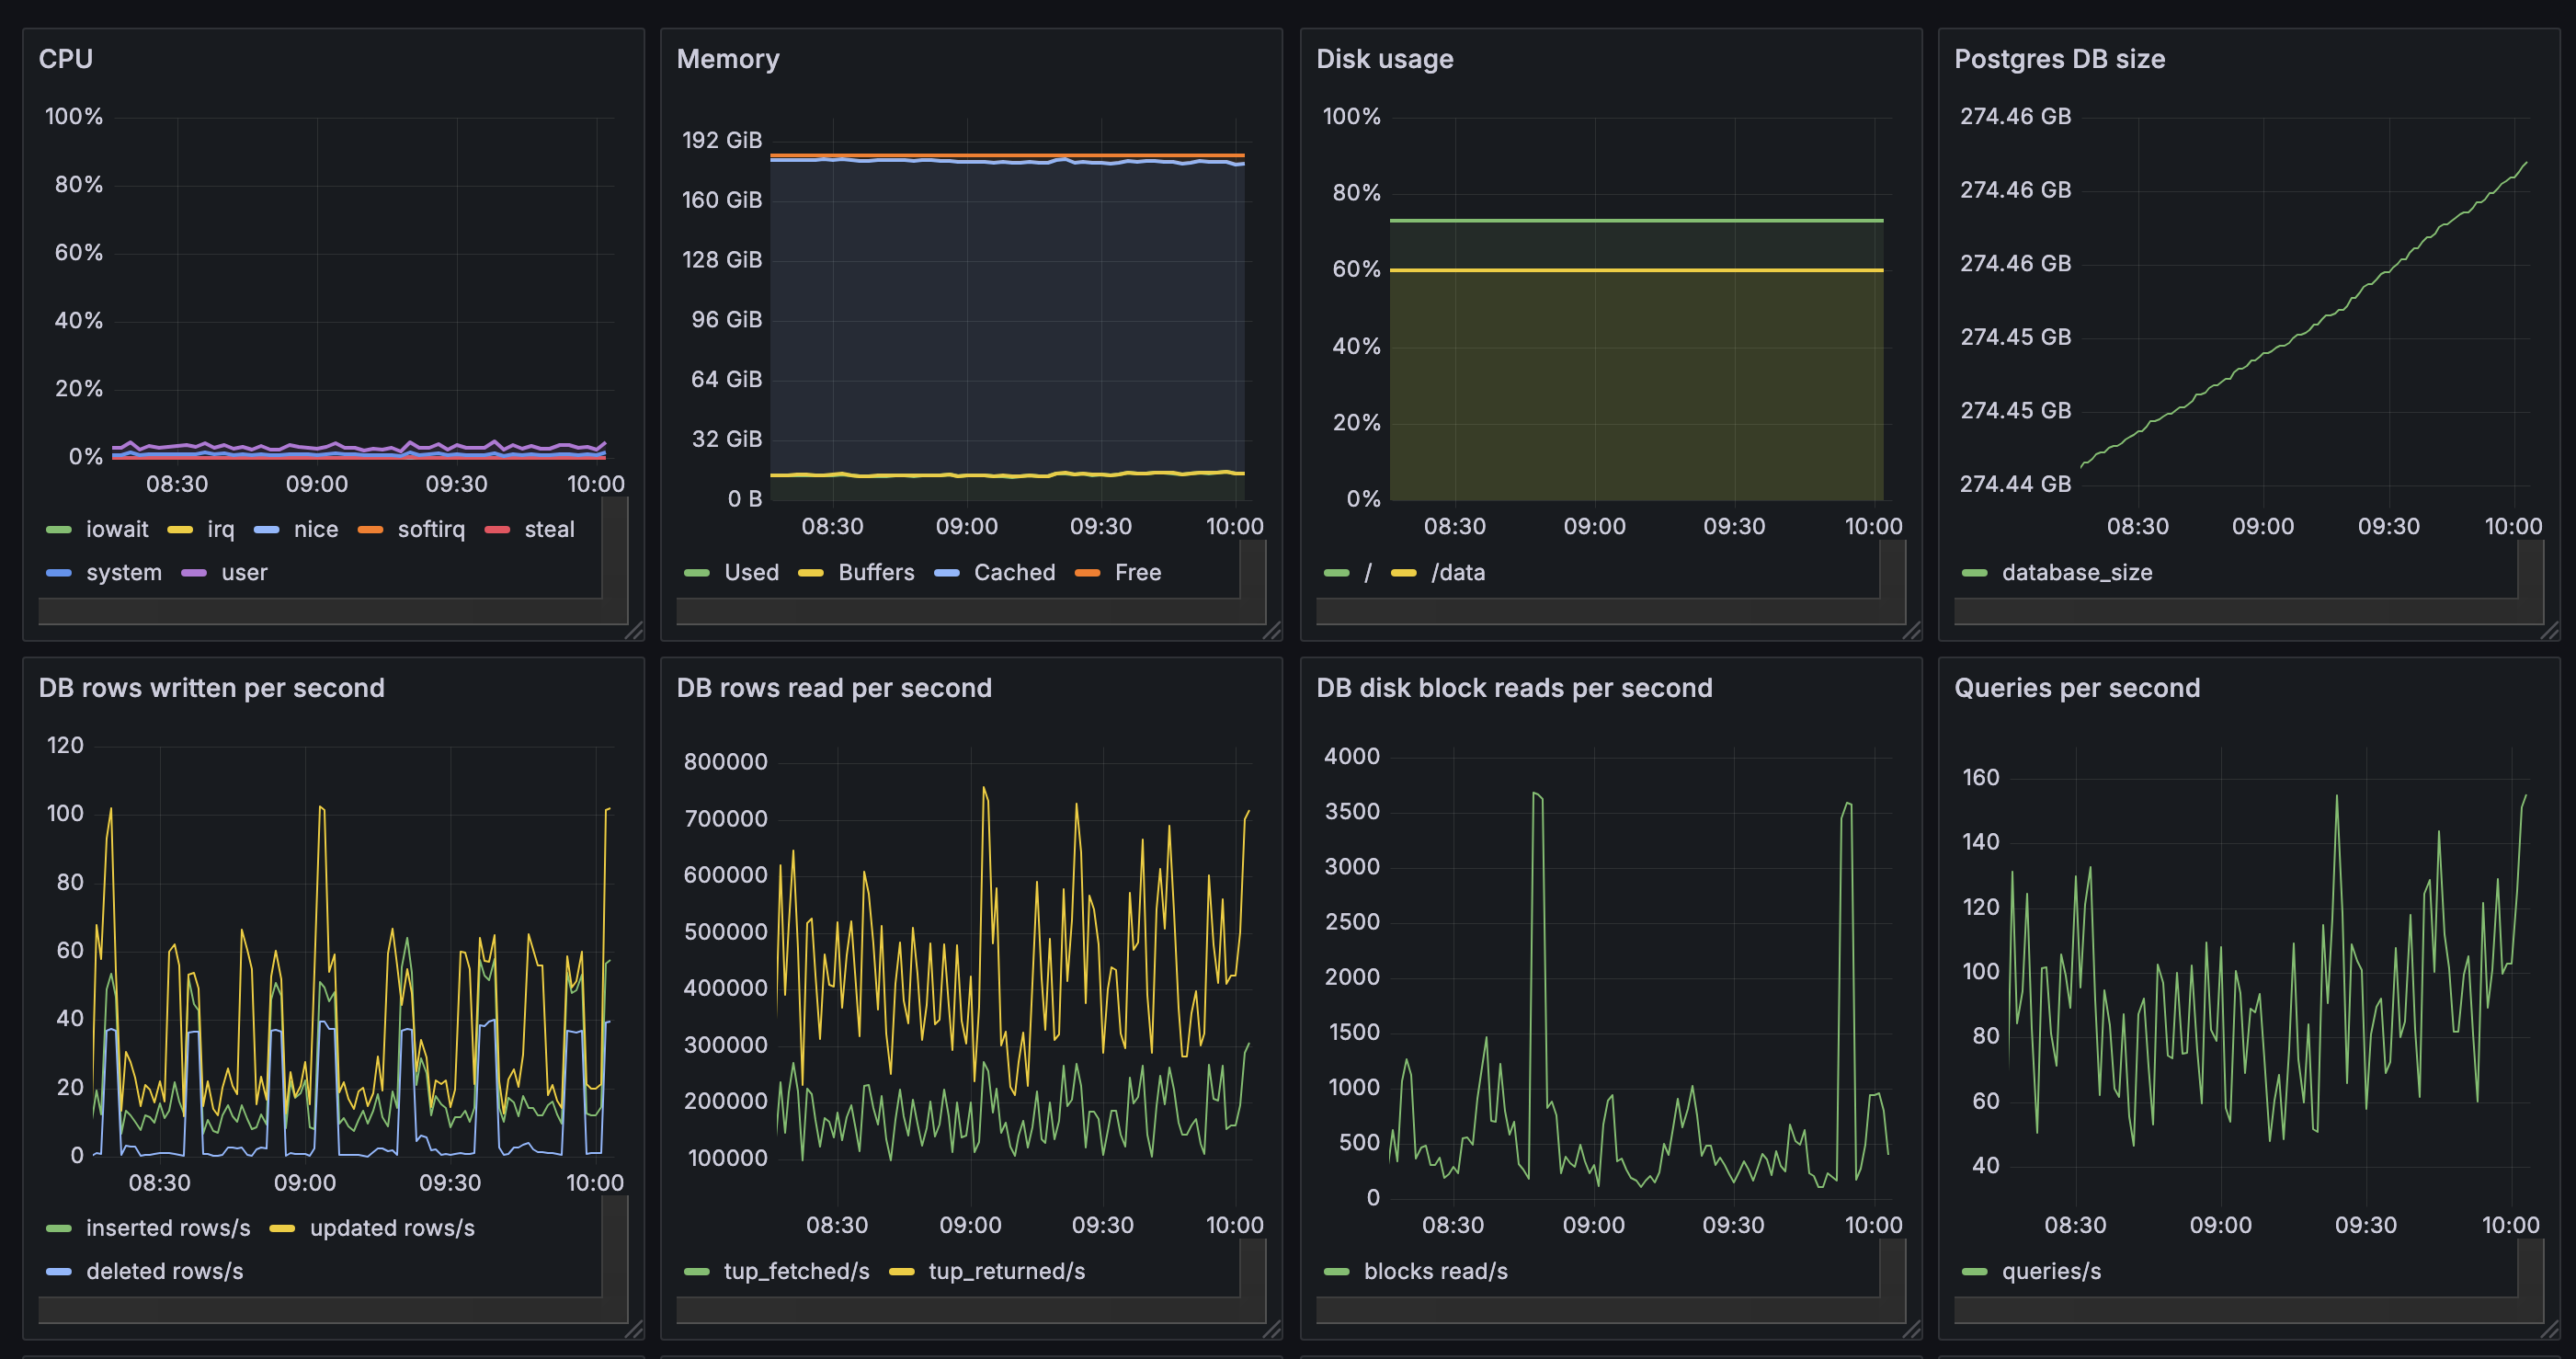
DB stats during an example outage:
I'm happy to provide more info, stats, etc.
repo: https://github.com/manifoldmarkets/manifold
This resolves as NO if we haven't fixed the underlying problem, i.e. even if we have a cron job restarting the server every 2 hours
🏅 Top traders
| # | Trader | Total profit |
|---|---|---|
| 1 | Ṁ11,391 | |
| 2 | Ṁ5,826 | |
| 3 | Ṁ4,648 | |
| 4 | Ṁ2,346 | |
| 5 | Ṁ946 |
I fixed a bug related to redemptions and pushed the commit 10 minutes ago. Will it magically fix the server? We'll have to wait ~an hour to find out
@ian is this supposed to handle my existing negative shares? (since I can still see them). dunno if that's required for the fix (if it were a fix)
@Choms It resolves as no if we haven't fixed the underlying problem, i.e. even if we have a cron job restarting the server every 2 hours
@ampdot If I run manifold on my computer and point it at the same production db that manifold.markets is pointed at, the local site is snappy and every query loads quickly. I'm saying it implies sth is wrong with the server and not the db.
@ian My fix didn't work, but I still think the multiple choice computation must be the problem. Can we just shut off bets on multiple choice, shouldSumToOne = true markets and see if the site improves?
@JamesGrugett I think it's something with the pooler but no idea what, we ruled out DB issues because we added the read replica, upscaled, and as @ian said DB works fine during an issue if you spin up an API locally, we also ruled out memory leak and file descriptor limits on the API, but given the issue disappears after a redeploy (same as for local deploys) it's like something is getting degraded over time on the API. Why I feel it's the pooler? On that screenshot up there there are 4 DB connections for a single request, each connection taking ~10s, which is also the setting for connectionTimeoutMillis. Everything else looks just fine. Maybe also check on those CPU spikes on the container @ian mentioned, I don't see a reason why not make the API multi threaded as a whole. My 2cts :)
@Choms Nice. I think you are right. I wonder if there isn't some way for the pooler to be affected by interruptions to the main thread. E.g. randomly you are blocked for a whole second or two on numeric computations before getting back to handle requests/responses for the pool.
@JamesGrugett it could be but honestly I have no idea how pgpromise is handling those connections, I saw the guy who made it seems active on stack overflow so maybe it's worth asking him
