Resolution Process: On the first day of the three months prior to the US presidential election (i.e. 1 Sep, 1 Oct, 1 Nov) I will record in a spreadsheet the probabilities (rounded to nearest integer) each forecasting product has most recently assigned to either a Democrat or Republican winning in each Electoral College region. When the actual results are finalized post-election, I will take a Brier score based on the forecasts made for the candidate that ultimately won, and add up the total for each forecasting product.
The forecasting product with the lowest Brier score resolves YES, all other forecasting products resolve NO.
Criteria for Inclusion: For an election forecasting product to be eligible to resolve YES, the forecasting product must:
make forecasts for all or nearly all Electoral College regions (e.g. if a forecasting product doesn't track the special districts in Maine and Nebraska, but covers all 50 state-level races, that's fine; so this criterion excludes Metaculus, which only covers 19 battleground states)
use numeric probabilities (can’t just label races as “toss-up” or “likely”, needs to be like a percentage chance out of 100)
be public with its numbers (so Nate Silver's election model, which will be paywalled, won't qualify)
be a cohesive product (so PredictIt, which has some election markets, won’t qualify unless they put together something systematic and organized in the fashion of Polymarket or Manifold)
not be too obscure or small; so a lone non-famous analyst making a forecasting product would not merit inclusion
An election forecasting product that someone adds to this question that fails any of these criteria for inclusion will resolve NO and I won’t track its probabilities.
Below are links to the forecasting products/models that meet the criteria for inclusion so far:
🏅 Top traders
| # | Trader | Total profit |
|---|---|---|
| 1 | Ṁ1,437 | |
| 2 | Ṁ1,345 | |
| 3 | Ṁ655 | |
| 4 | Ṁ287 | |
| 5 | Ṁ268 |
People are also trading
It is looking likely that Donald Trump will win all of the swing states. According to the excel spreadsheet in which I inputted the probabilities for Sep 1, Oct 1, and Nov 1, that would mean Polymarket will be the most accurate forecasting product.

I will wait until all states are called (probably wait on the New York Times, which may take a few days) and input the winning candidate into the relevant cells in the spreadsheet before resolving to the product that was the most accurate.
Am I missing something? For this to resolve YES, Nate Silver has to publicly release model predictions for all 50 states (current predictions and previous months') AND he has to actually have the lowest Brier score. Otherwise it resolves NO (not N/A, btw).
Like, I'll happily keep betting against y'all and take your mana, but I almost feel guilty about having the unfair advantage of ... having read the rules of the market?
@DanHomerick https://www.natesilver.net/p/a-random-number-generator-determined csv is available for download here.
@JimAusman Last I checked Nate Silver's model is not public. That means it cannot count for the purposes of this question per criterion 3. If that's changed, let me know with a link so I can see the probabilities for Sep 1, Oct 1, and Nov 1.
I have taken down the probabilities for Nov 1st. No new probabilities will be added before the election results are known.
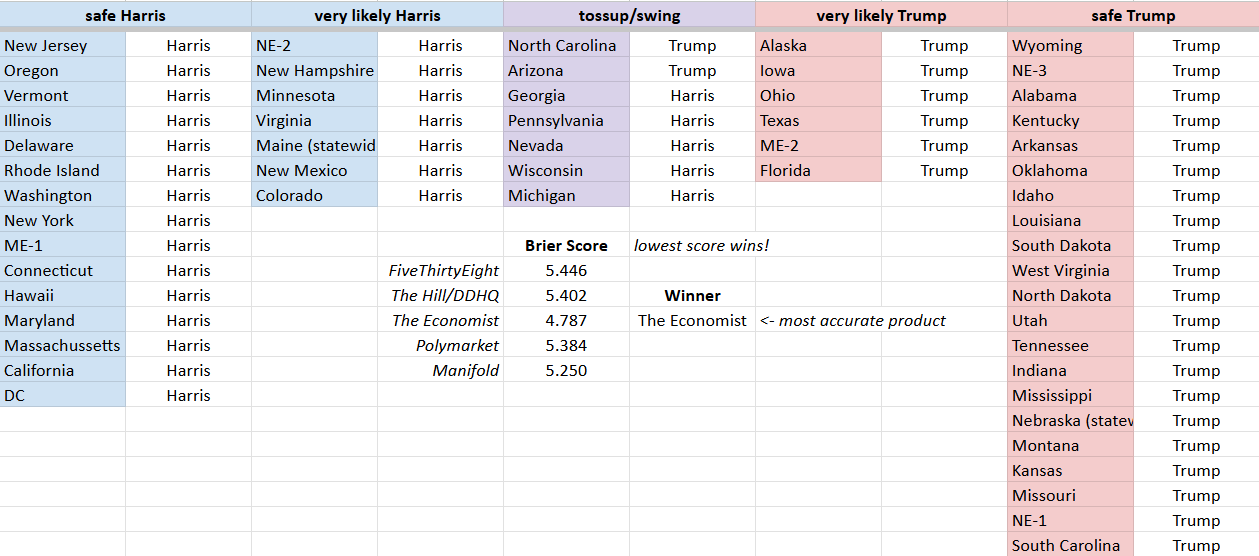
I have also added a simple calculator to the spreadsheet that takes the collected probabilities assigned by each forecasting product for Sep 1, Oct 1, and Nov 1, and determines which model would be the most accurate given a set of electoral outcomes.
Please feel free to copy the spreadsheet and toy around with the calculator. Note: Gave it a try and an @ symbol will be added to the start of the winner cell (not sure why) - if that happens, just remove it.
For example, if Harris wins all the same states that Biden won in 2020, then The Economist will be the most accurate forecasting product of this election cycle:

@cash This is awesome work! Thanks for adding so much detail.
Does this mean no more models can be added? (Ie “other”). Or just that someone would need to find a new model that meets the criteria in the next few days
Here is a copy of the excel sheet with the probabilities I marked down on Sep 1st and Oct 1st. Feel free to download, change the scenarios, compare brier scores at the far right. There are two tabs, one for Sep 1 and one for Oct 1.
@FergusArgyll
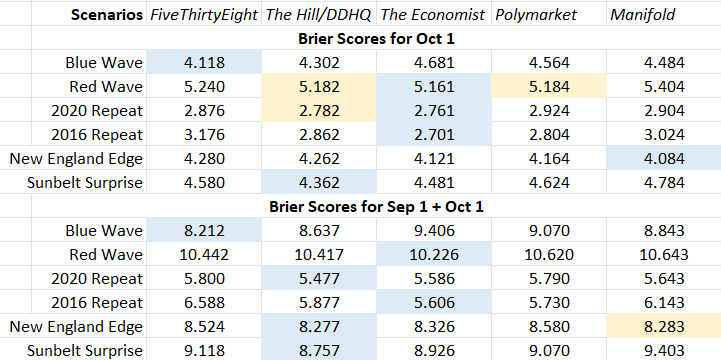
Took a tally of probabilities from each of the election models today and took brier scores to see which model is "winning" under different assumptions:

If just looking at Oct 1, Economist is out ahead if the election looks like 2020 or 2016 again.
But if we tally both the Sep 1 and Oct 1 brier scores, The Hill/DDHQ and The Economist seem to be the top two contenders for realistic scenarios (2020 or 2016 repeats).
Took a tally of probabilities from each of these election models/products on Saturday.
To get a sense of how the models compare right now, here are some election scenarios:
Blue Wave - Harris wins every swing state and takes likely Rep states like Florida and Ohio
Red Wave - Trump wins every swing state and cracks likely Dem states like Virginia and Minnesota
New England Edge - Trump wins a tight race with a couple surprise edge states in New England
Sunbelt Surprise - Harris loses the north and east but wins a tight race with surprise upset in Texas
2020 Repeat - Harris wins, with the same combination of states as Biden won in 2020
2016 Repeat - Trump wins, with the same combination of states as Trump won in 2016
I went and did the brier score calculation in an excel spreadsheet for each of these scenarios, given the odds each election product gave on 1 Sep:

If only accounting for the Sep 1 odds and these hand-picked scenarios, FiveThirtyEight would be the most accurate forecast if there's a Blue Wave in November, and The Economist the most accurate if there is a Red Wave.
The Hill/Decision Desk and Manifold are very nearly tied in brier scores if the exact same states are won by Harris in 2024 as Biden won in 2020, while Polymarket and The Economist are virtually tied if Trump wins the same configuration of states in 2024 as he did in 2016.
The Hill/Decision Desk would be the most accurate forecast if either of the two hypothetical edge cases came to pass, but if Trump won the north while Harris won Texas, both The Economist and Polymarket would be pretty nearly as accurate.
