
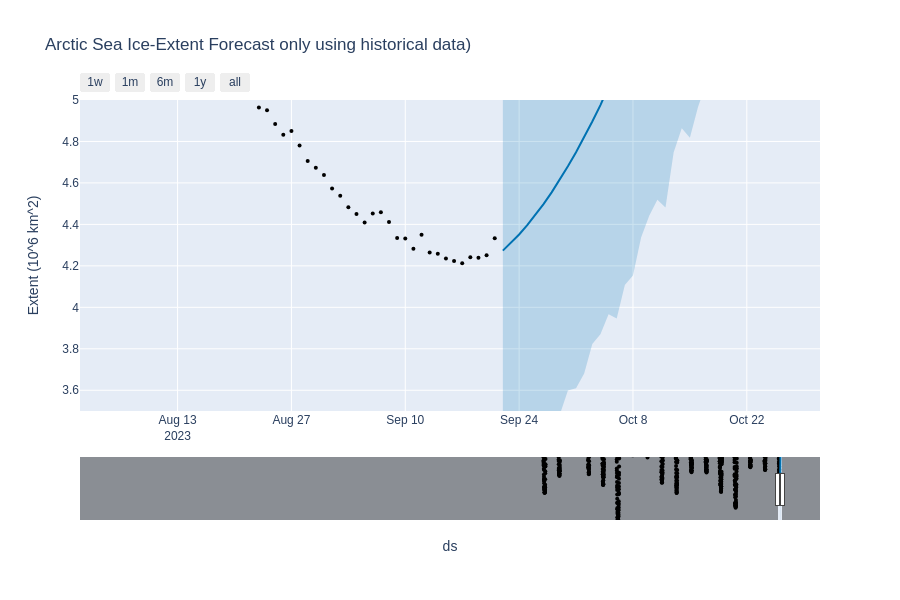
According to the National Snow and Ice Data Center, the lowest daily value for the Arctic Sea Ice extent as it appears in the 2023 column here (in millions of square kilometers):
Graph here (5-day trailing average):
https://nsidc.org/arcticseaicenews/charctic-interactive-sea-ice-graph/
 1,000
1,000🏅 Top traders
| # | Trader | Total profit |
|---|---|---|
| 1 | Ṁ297 | |
| 2 | Ṁ171 | |
| 3 | Ṁ22 | |
| 4 | Ṁ14 | |
| 5 | Ṁ11 |
People are also trading
Edit: New daily data from NSIDC was late today:
NSIDC shows a rise:
2023-09-20 4.251
2023-09-21 4.333
ViSHOP showed a rise:
2023-09-20 4.19038
2023-09-21 4.206245
Tomorrow will be last update for me since it seems its on the rise now...

@parhizj You say 30% (or is that 2/7?) is "very likely", seems a strange description of 30%..
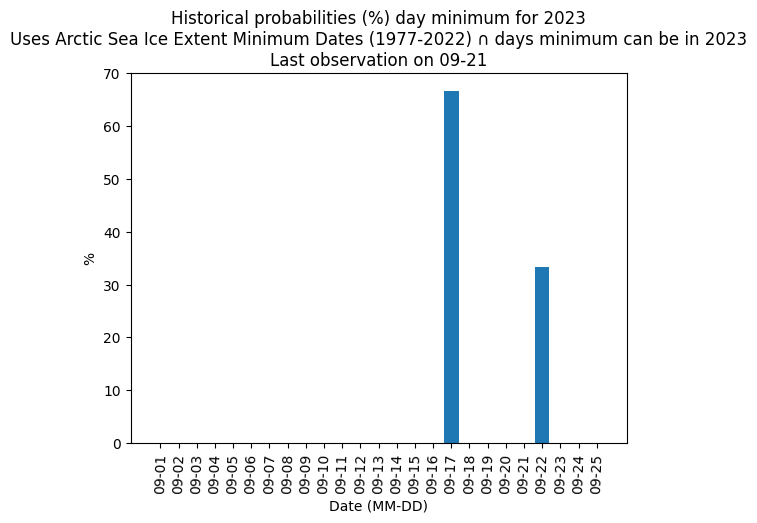
I say 21 of last 25 years do not show large enough drops from 19th to cause a new minimum. ~84% sounds more like "very likely" to me.
Vishop (JAXA) has looked very smooth this year so that showing a rise might be additional evidence that the % should be high like ~84% rather than 30%. OTOH perhaps my 84% is giving too much weight to years that have been showing a rise for several days by 19th Sept.
Only looking at the 7 year out of 44 years that do show a fall to say that a further fall of more than 0.026 is 5/7 ~70% likely seems like very bad methodology to me.
@ChristopherRandles Yes 30 percent even without considering the trends at all does it make it likely. Put another way, intuitively when adding in the trends and that there is only 3 days left makes that 30 percent jump much higher
@ChristopherRandles Basically I just meant what you wrote in your first reply about drops being unlikely. Sorry if I was unclear.
Chartic showing 4.234 suggests a value close to 4.239 (later shown as 4.241) about 0.026 up on yesterdays data minimum.
Only 4 of last 25 years show a subsequent drop of 0.026 (0.028) or more. Is that enough to say there is ~84% chance minimum was 17th? Or is that biased in some way?
Assuming it is later than 18th would seem a strange assumption?
Edit: Both rising....
NSIDC:
2023-09-17 4.213
2023-09-18 4.241
ViSHOP:
2023-09-17 4.141911
2023-09-18 4.166193
My point forecast also shows only rising again (to 4.215)
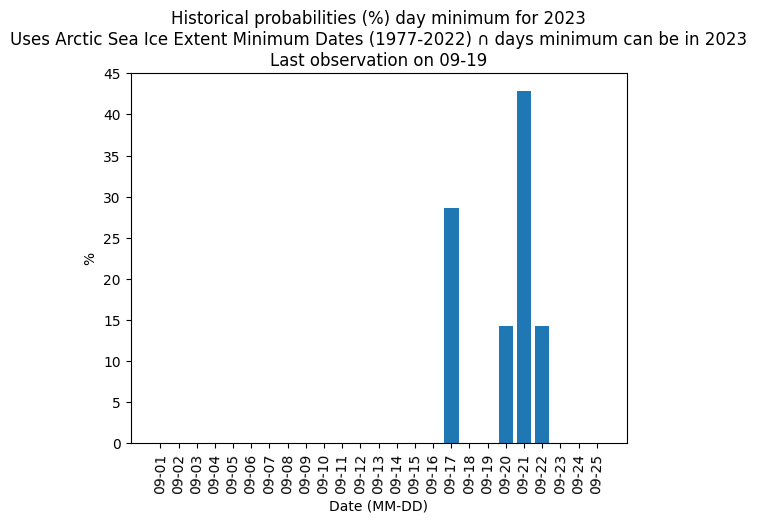
Historically its still likely the minimum might come later if you conditionalize a certain way, but with just that small bump increase from yesterday it becomes more difficult.

@ChristopherRandles Nope nothing. Looks like the load more comments on scrolling to bottom isn't working anymore (checked on another device too)
Looks like a GUI bug.. the comments are still there it's just not loading them
https://manifold.markets/api/v0/comments?contractId=CYPrZbZhJQKViMRgVVFZ
Reported to discord
@parhizj I'll post here temporarily:
Sept. 16 4.216
Sept. 17 4.210
Sept. 18 4.197
Sept. 19 4.215 *(the minimum for future days past the last observation)
Sept. 20 4.224
Sept. 21 4.229
@ChristopherRandles Nah.... yesterday they did update the modification time (overwrite the file) but didn't change any of the data.
@parhizj Only yesterday did I figure out the spreadsheet was not masie but the NSIDC product and found the ftp site for it, got set up for downloading files from ftp site and then today chartic graph updated first. lol
@ChristopherRandles Weird. Well I usually have a script to watch for file size changes to all of the markets I'm interested in so I don't have to put too much effort.