Background: The Waluigi Effect
(If GTrends isn't granular to compare particular days, I'll use the week or highest resolution data which contains both April 1st and May 1st of 2023.)
 1,000
1,000🏅 Top traders
| # | Trader | Total profit |
|---|---|---|
| 1 | Ṁ73 | |
| 2 | Ṁ39 | |
| 3 | Ṁ24 | |
| 4 | Ṁ16 | |
| 5 | Ṁ11 |
People are also trading
@Muskwalker Huh, I just did that check yesterday and it showed 65 for April 1. I wonder why Google trends isn't being consistent - pretty concerning for defining this market.
@Gabrielle 1) I don't know if time zones are a factor, which might make a difference
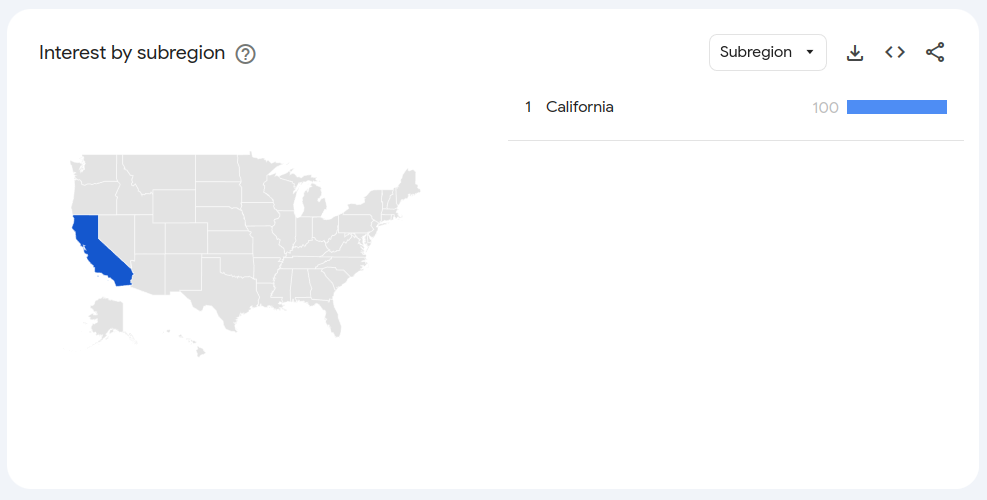
2) I do know that these ranks are apparently relative: "Numbers represent search interest relative to the highest point on the chart for the given region and time. A value of 100 is the peak popularity for the term. A value of 50 means that the term is half as popular. A score of 0 means there was not enough data for this term." (For this screenshot I chose a timeframe starting from the day this market opened.)
3) The above screenshot is worldwide numbers; the search defaults to US, which has weirdly different data: 80 for the no-quoted term on April 1st, and its peak on April 8—a date where 'worldwide' has 0 for both terms.