
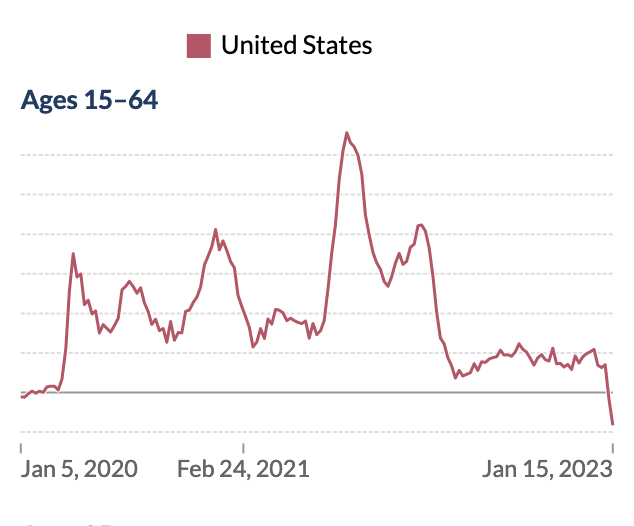
Will excess mortality for those aged 15-64 in the US remain less than 10% above pre-pandemic-based projections until the end of June, according to this graph?
Screenshot from Nov 26; the first dotted line above the solid line is 10%:
Resolution will be based on the last datapoint before the end of June, even if some of June is included in the following datapoint.
[Added: I will resolve this after Oct 1, because apparently it can take some time for this data to come in.]
 1,000
1,000🏅 Top traders
| # | Trader | Total profit |
|---|---|---|
| 1 | Ṁ32 | |
| 2 | Ṁ15 | |
| 3 | Ṁ5 | |
| 4 | Ṁ4 |
People are also trading
I want to note "The reported number might not count all deaths that occurred due to incomplete coverage and delays in reporting" from the graph description; I've also seen some discussion that excess mortality data may not be very useful until a while later because it takes a while to get all the data in. I don't remember details and am not currently up for looking into this more but I want to flag that if this is true it might be a good idea to have the market resolve some number of months after the time period in question